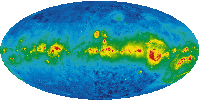
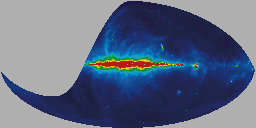
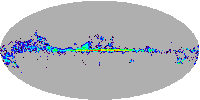
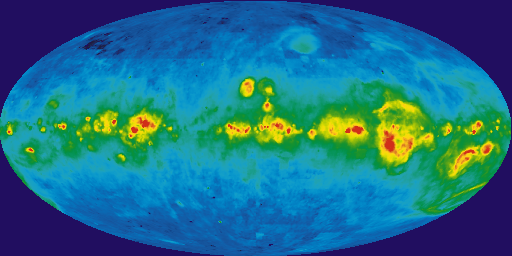
Owens Valley Radio Observatory Long Wavelength Array sky maps were used to produce this 3-color composite image of the long wavelength radio sky. The 36.528, 52.224, and 73.152 MHz data are represented as red, green, and blue respectively. The maps are scaled by ν2.5 before combining and the brightness scale is logarithmic. Therefore, regions with a ν-2.5 power law spectrum tend to appear white, and regions with a flatter spectral index tend to appear blue. Detailed Product Description
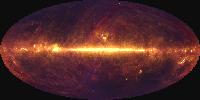
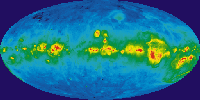
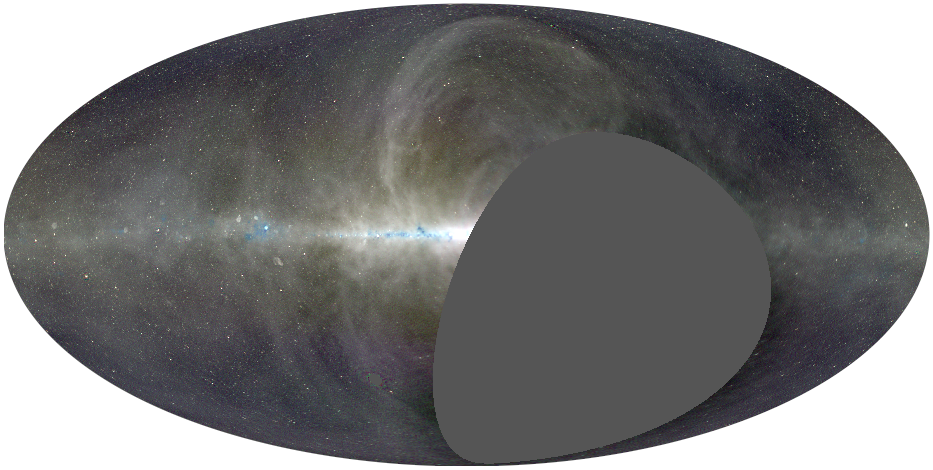
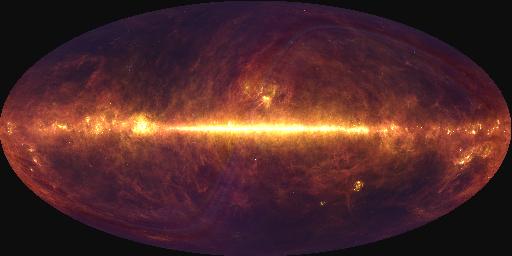
Maps from the Improved Reprocessing of the IRAS Survey (IRIS) were used to produce this 3-color composite image of the infrared sky. The 25, 60 and 100 um data are represented as blue, green, and red, respectively. Low-level residuals from removal of the zodiacal light show as stripes parallel to the ecliptic. Detailed Product Description
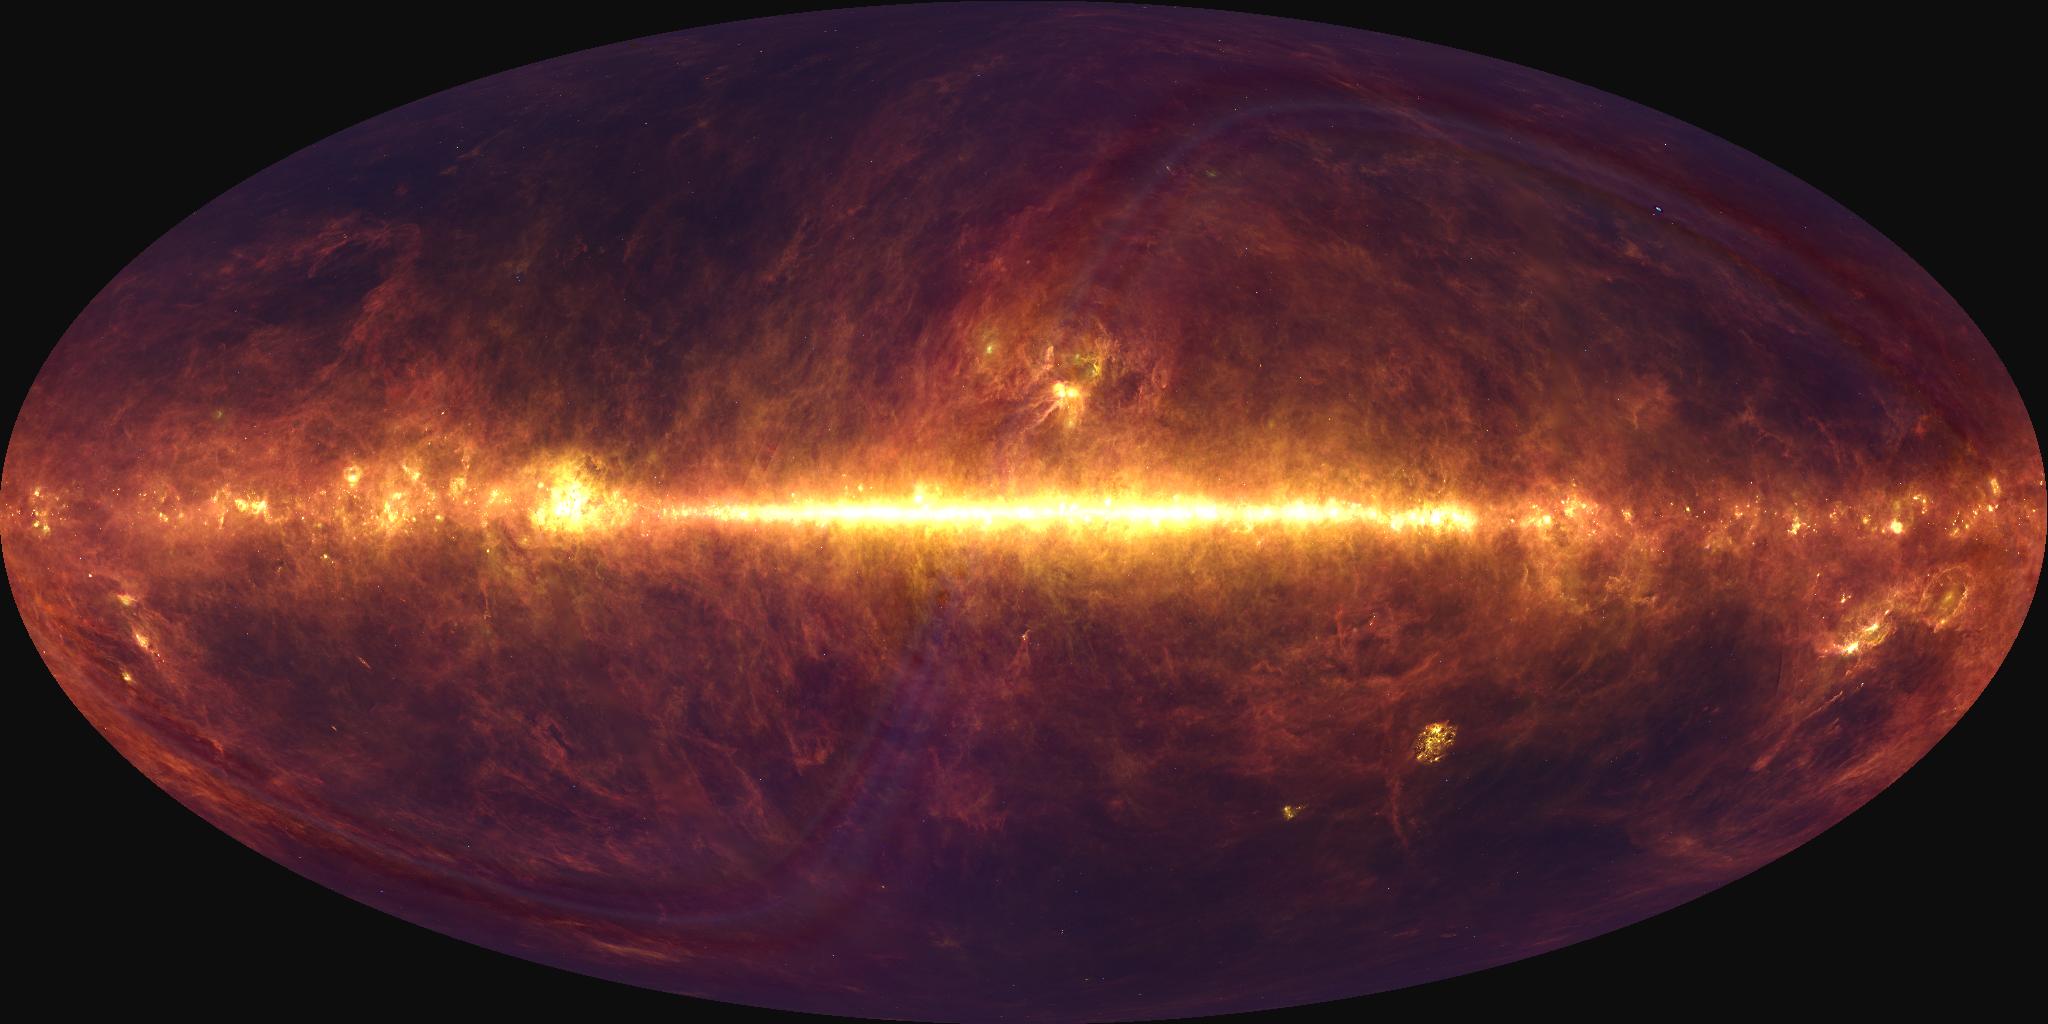
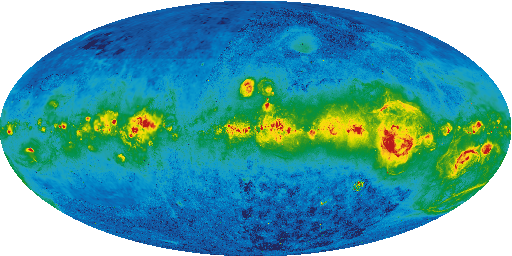
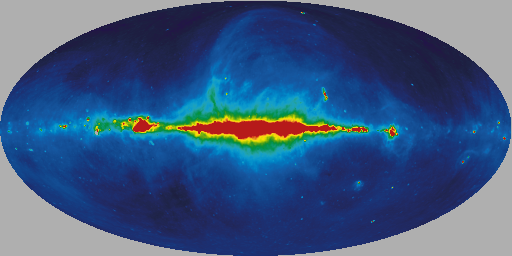
All-sky map of diffuse Galactic 12 micron dust emission (Meisner and Finkbeiner 2014). The images here are Galactic Mollweide projections of the low resolution (nside=1024, 3.4 arcminute pixel size) HEALPix map produced by the authors. Detailed Product Description
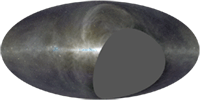
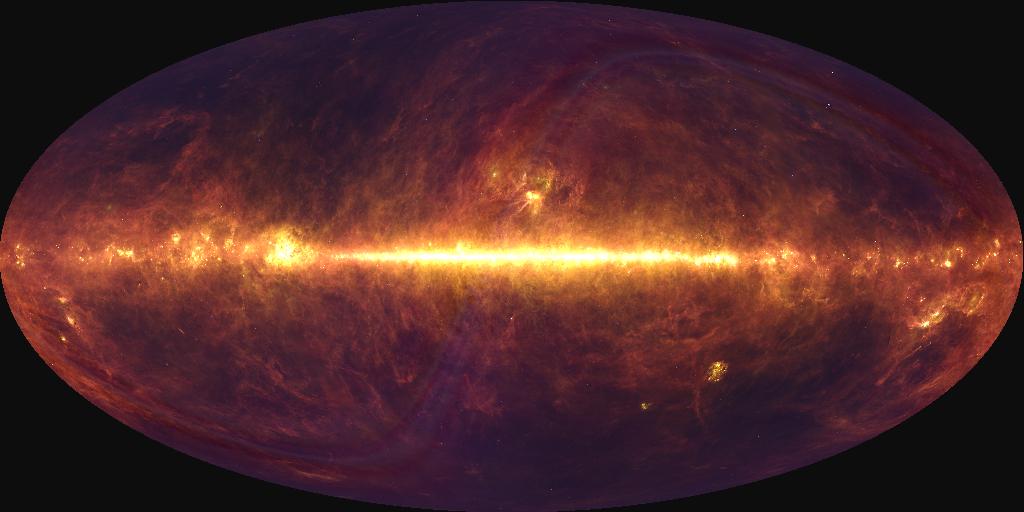
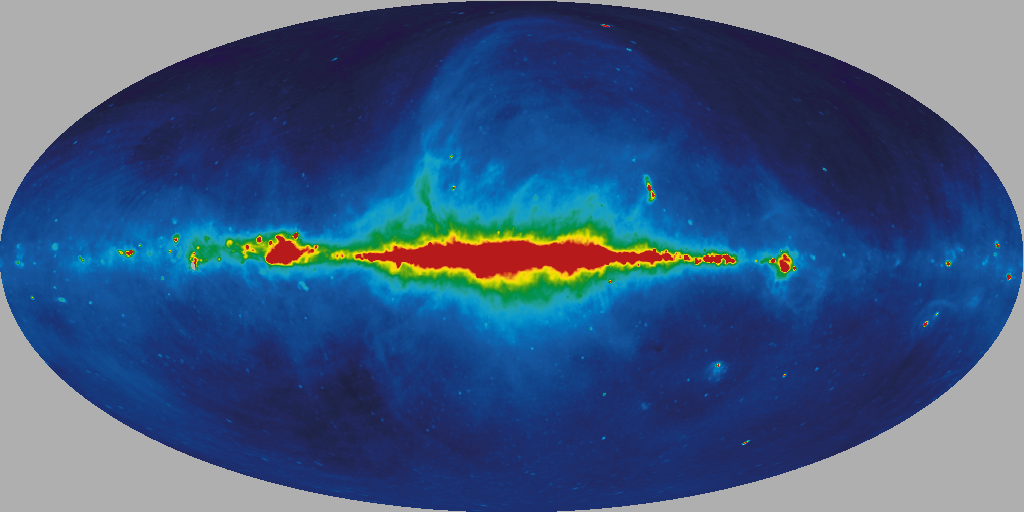
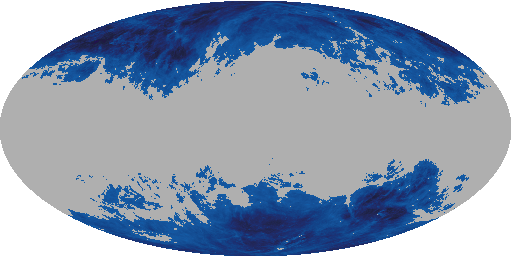
The 160 micron map from AKARI data release 1, degraded to 3.4 arcminute HEALPix pixels and then projected to a Mollweide image. Unsampled pixels appear white. Detailed Product Description
Data from WHAM, VTSS and SHASSA have been combined by D. Finkbeiner (2003) to form an all-sky composite H-alpha map. The H-alpha intensity is provided in units of Rayleighs; no correction has been made for extinction effects. Detailed Product Description
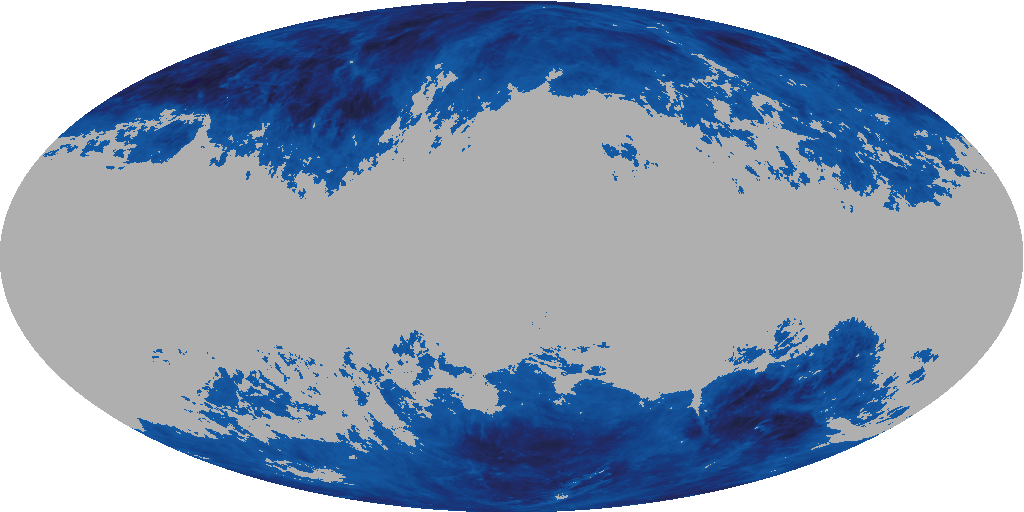
The velocity-integrated H-alpha map from the Wisconsin H-Alpha Mapper all-sky survey data release DR1. The H-alpha intensity is provided in units of Rayleighs; no correction has been made for extinction effects. Detailed Product Description
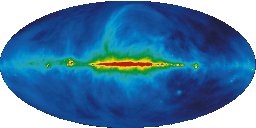
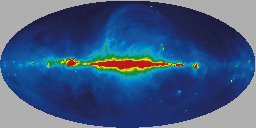
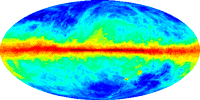
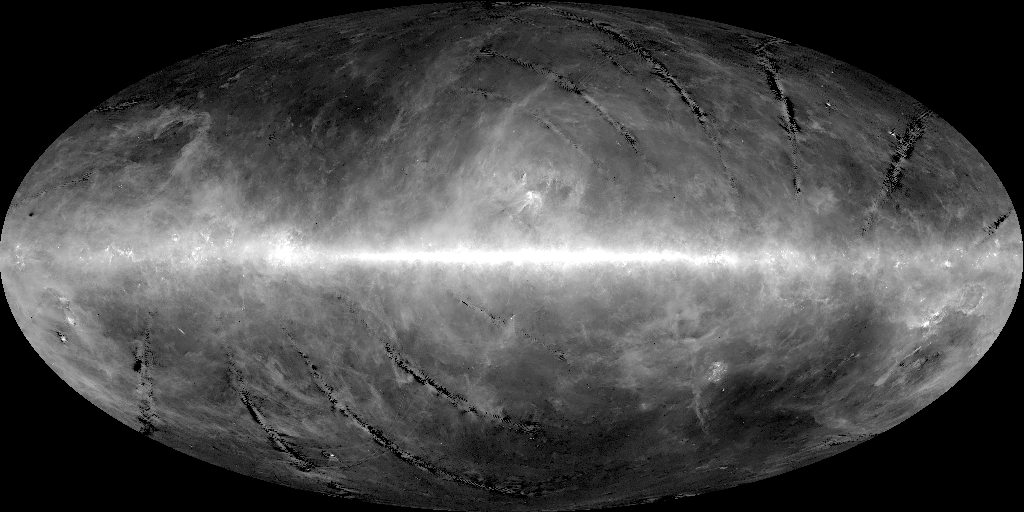
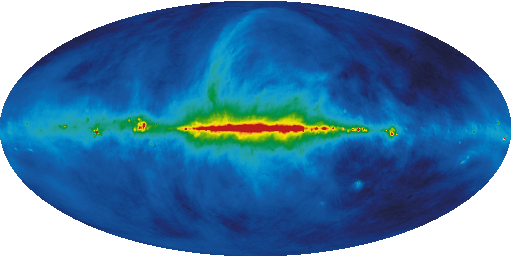
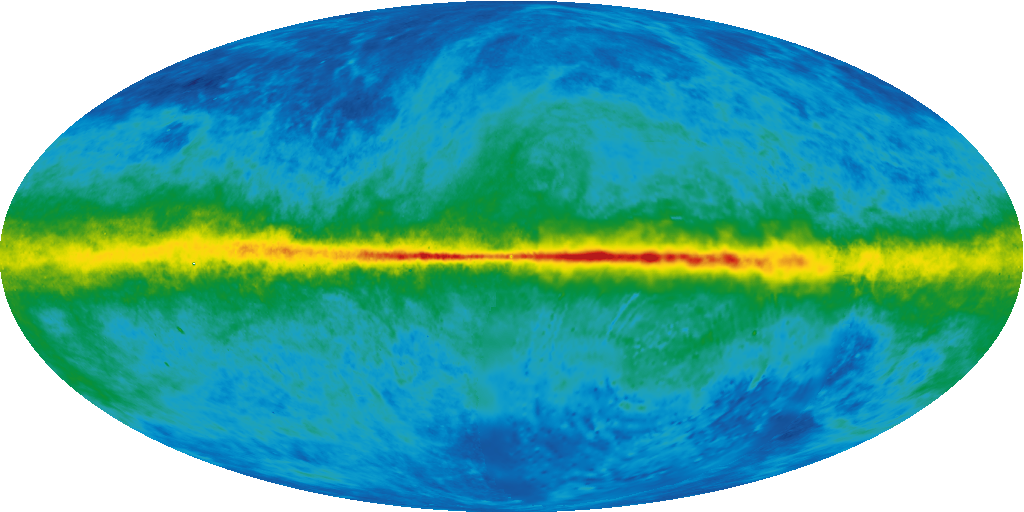
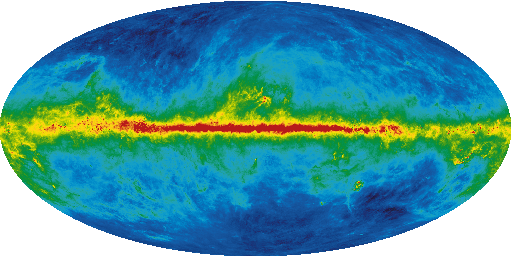
The reprocessed Haslam 408 MHz map of Remazeilles et al. (2014). Scan striping was reduced relative to the original Haslam 408 MHz map using a Fourier filtering technique, and strong extragalactic sources were removed using a combination of Gaussian fitting and minimum curvature spline surface inpainting. Detailed Product Description
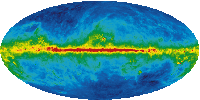
The Haslam 408 MHz map is derived from 4 separate surveys. Scan striping and contributions from strong point sources have been mitigated (compared to the original map) through the use of filtering in the Fourier domain. Detailed Product Description
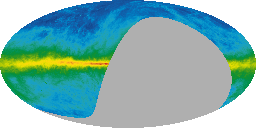
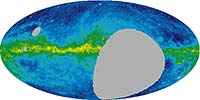
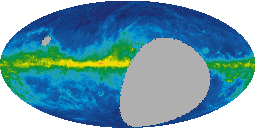
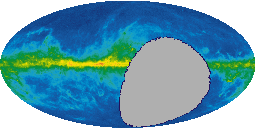
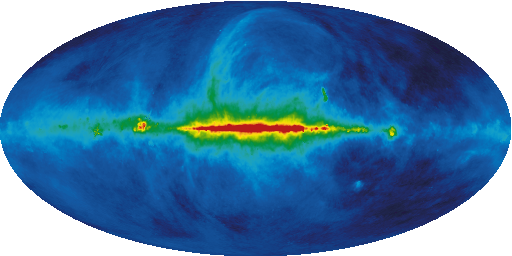
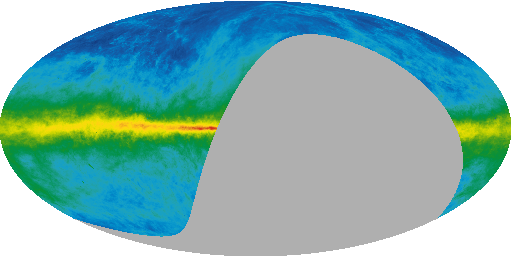
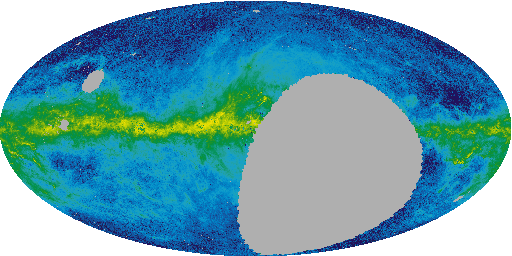
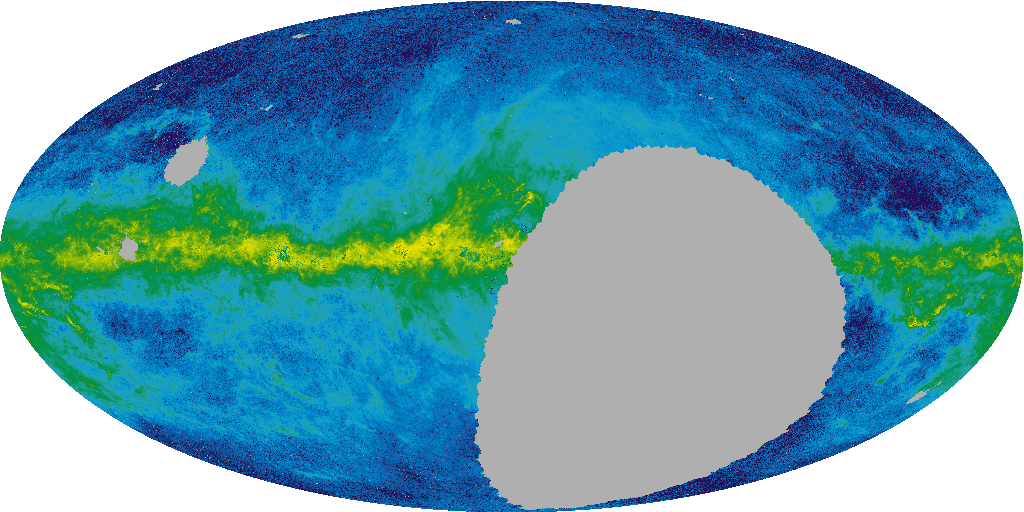
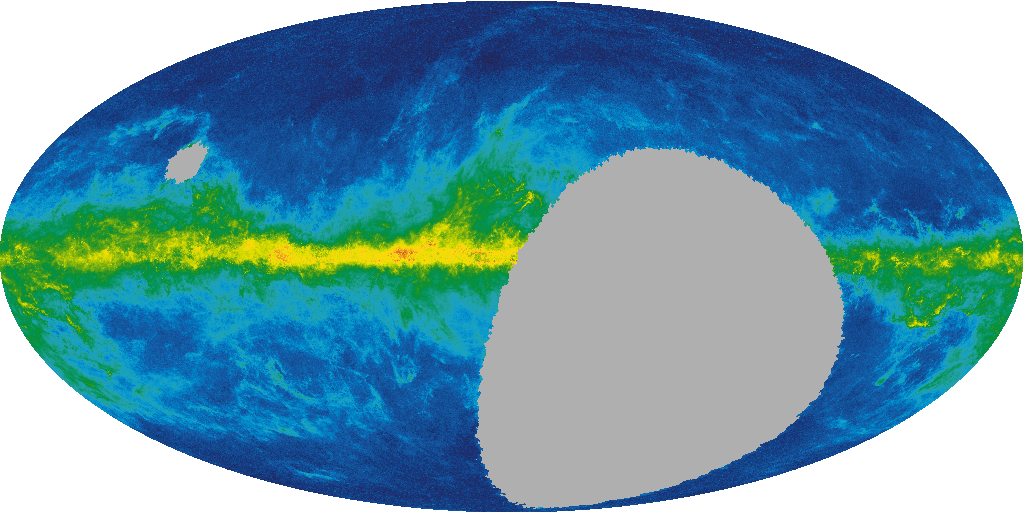
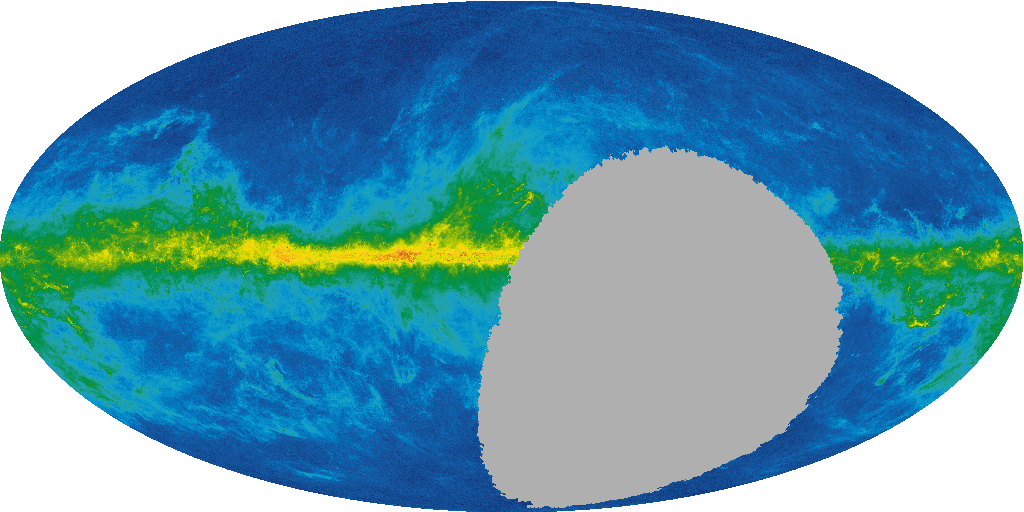
The CHIPASS 1.4 GHz continuum map, covering the sky south of +25 degrees declination. The map results from a reprocessing of archival data from the HI Parkes All-Sky Survey (HIPASS) and the HI Zone of Avoidance (HIZOA) survey by Calabretta, Staveley-Smith, and Barnes (2014). Detailed Product Description
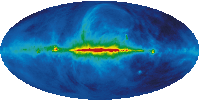
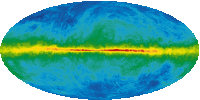
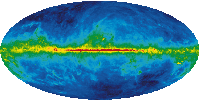
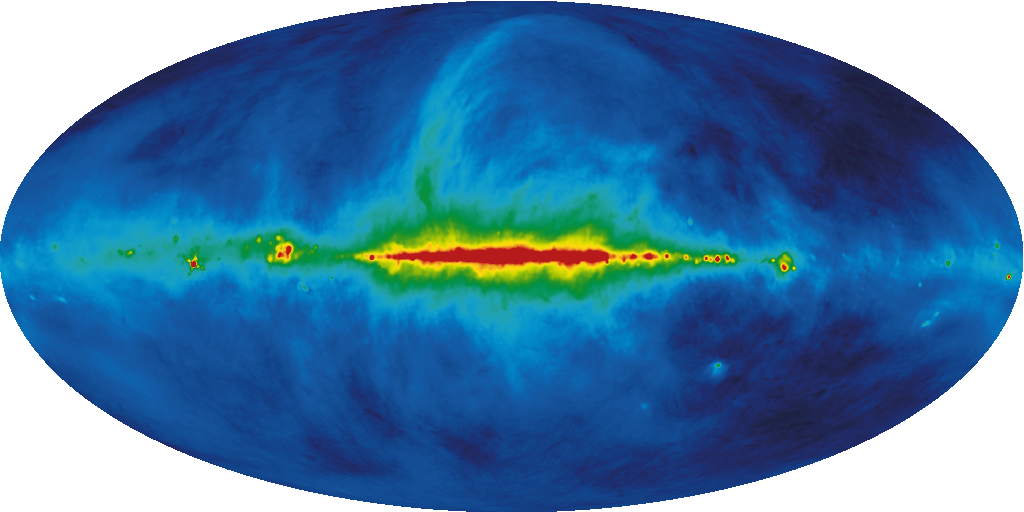
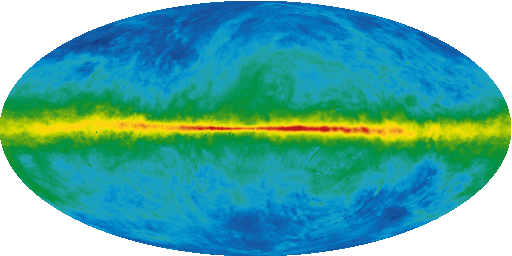
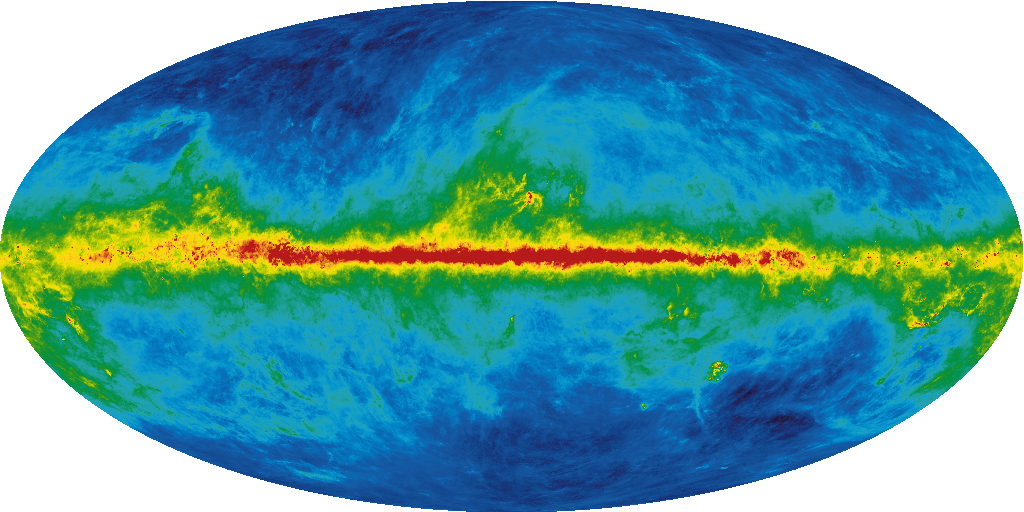
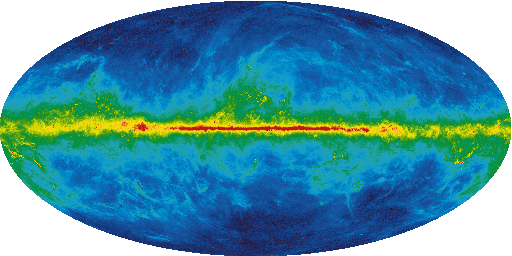
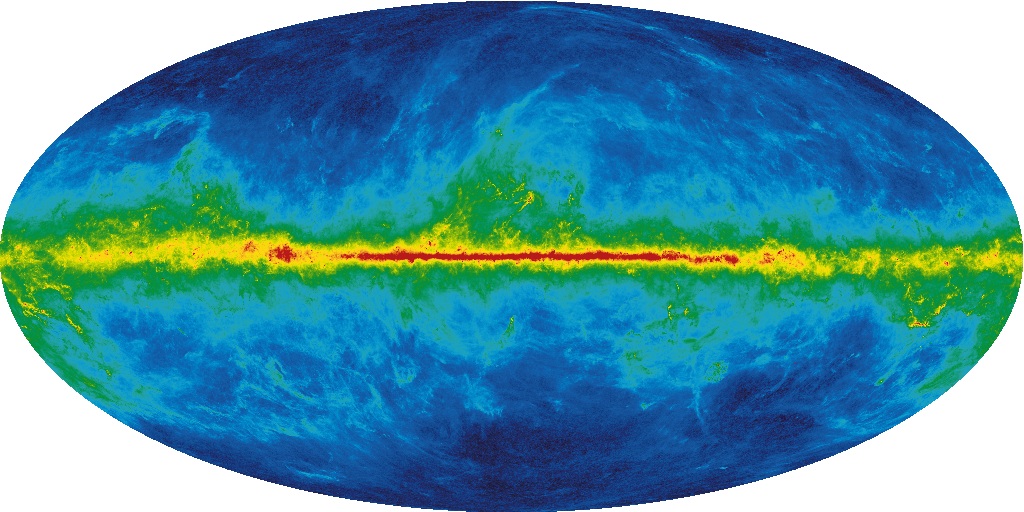
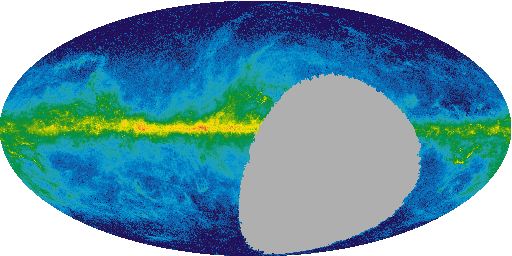
An all-sky 1420 MHz continuum map formed from surveys of the northern sky with the 25-m Stockert telescope and the southern sky with the 30-m Villa-Elisa telescope. Detailed Product Description
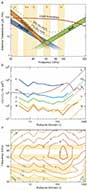
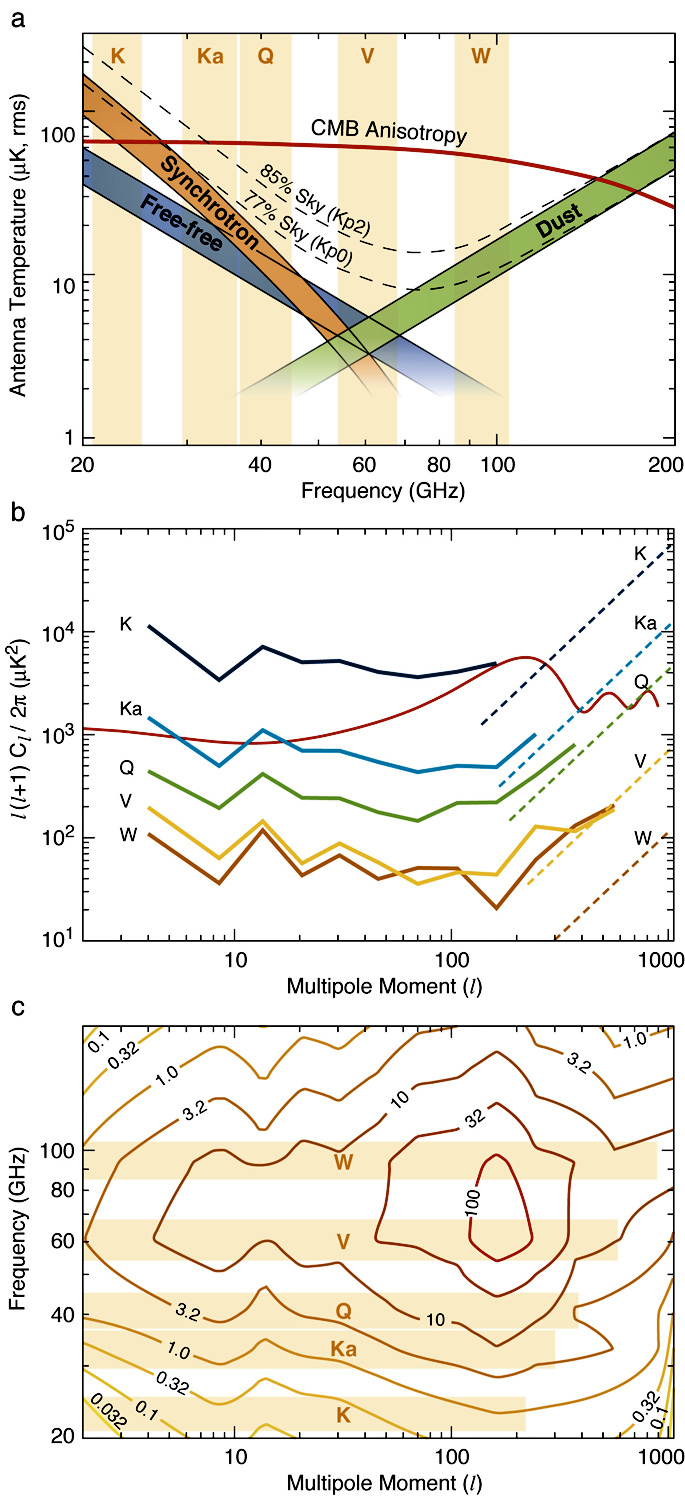
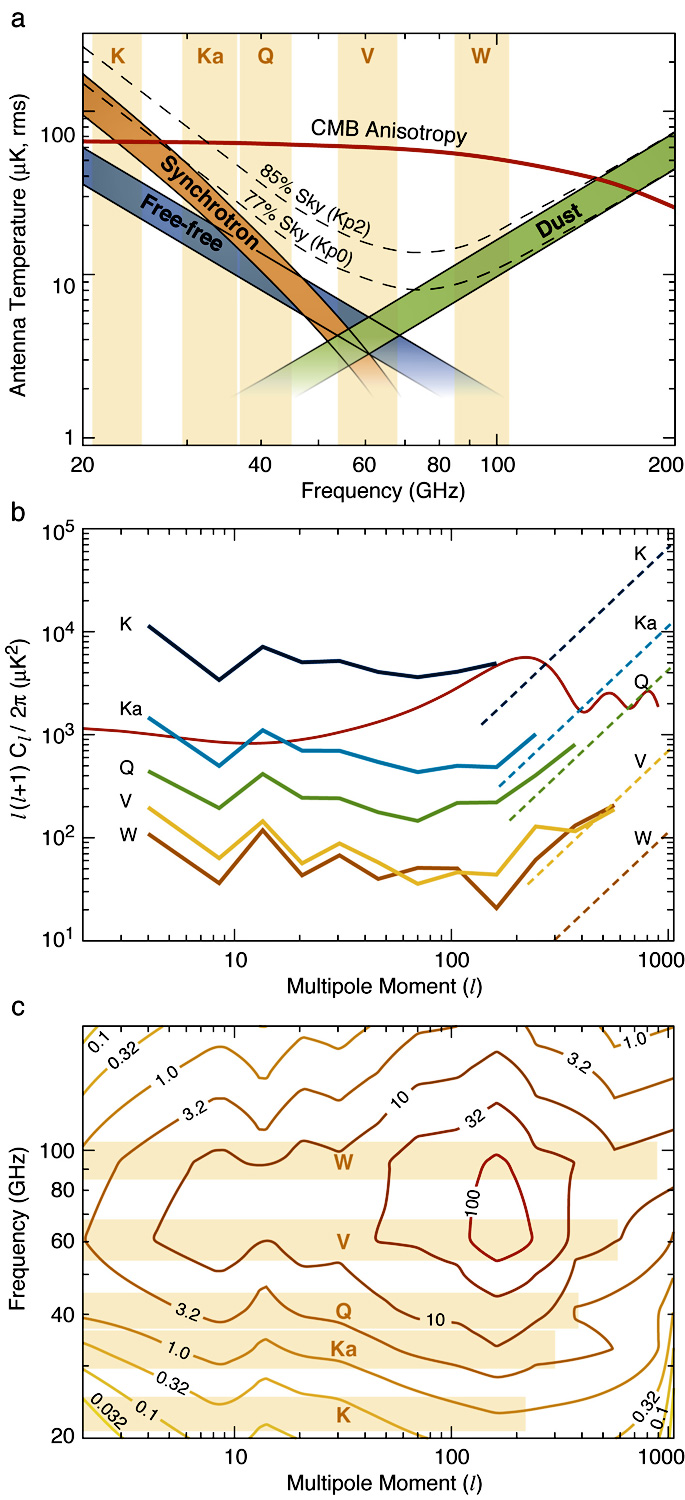
This figure, from Bennett et al. 2003 , compares the CMB anisotropy to the foreground anisotropy in frequency space and harmonic space. The WMAP frequency bands were chosen to be near the minimum of the galactic emission. (a) Spectra of the CMB anisotropy and the galactic emission as a function of frequency. (b) Foreground angular power spectra for each WMAP band using the Kp2 sky mask. The spectrum at each frequency is derived as a cross-power spectrum between radiometers minus the WMAP-derived CMB model. In K- and Ka-band, where cross-power spectra are not available, the noise bias has been estimated and subtracted. Point source fits for each band are shown in the dashed lines on the right. The spectra are expected to asymptotically join these lines. Note that the diffuse foreground spectra (excluding point sources) go as C_l ~ l^(-2). (c) The contour plot shows the ratio of the CMB anisotropy to the foreground anisotropy (for the Kp2 mask) as a function of frequency and multipole moment. The ratios are expressed in power units.
The 25,60 and 100 um IRAS/ISSA plates were used to produce this 3-color composite image of the infrared sky. Unobserved portions of the sky are white. Residuals from removal of the zodiacal light show as stripes parallel to the ecliptic. Detailed Product Description
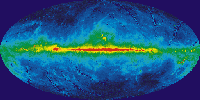
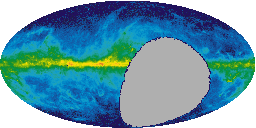
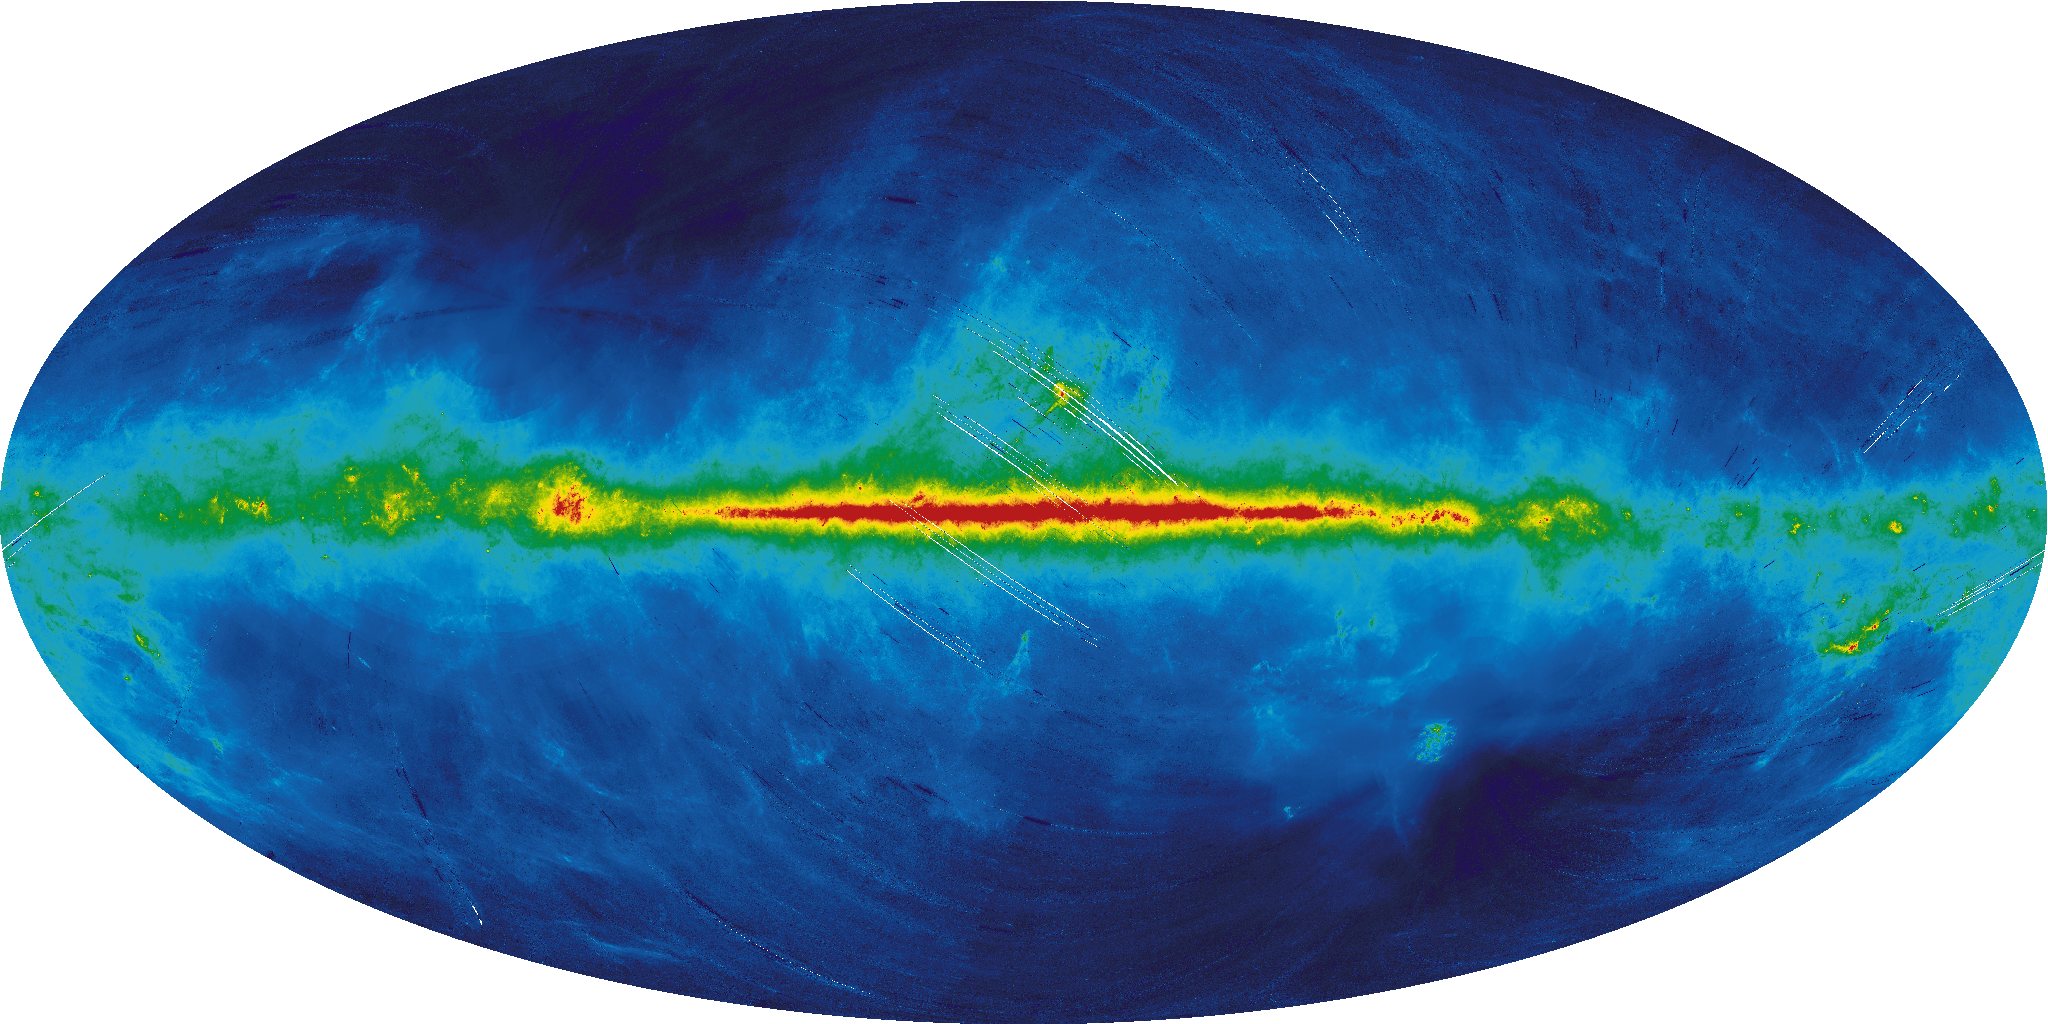
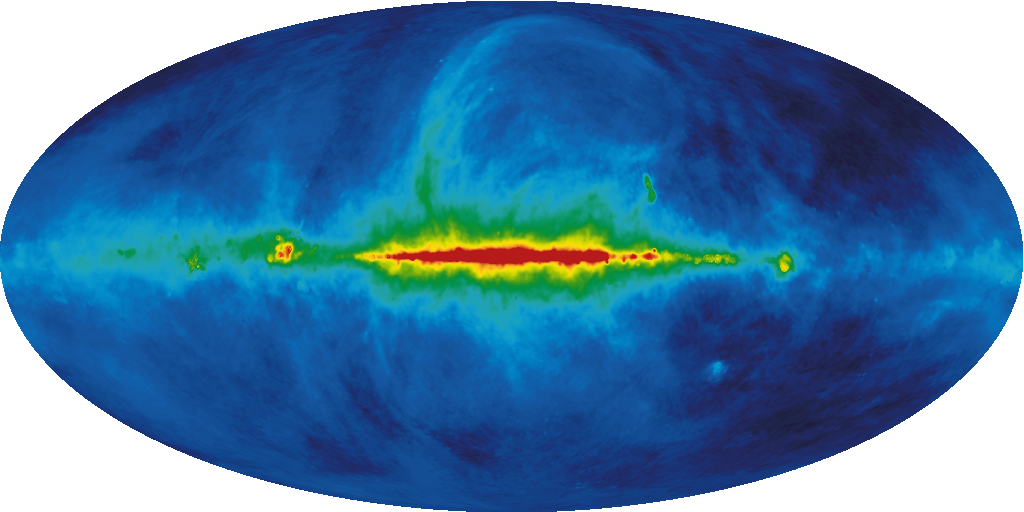
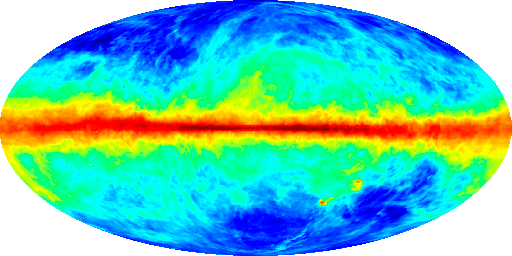
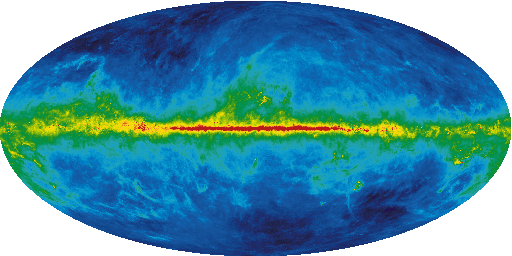
Composite neutral hydrogen column density, consisting of the 21 cm survey of Hartmann et al. (1997) supplemented with the lower resolution southern sky map constructed by Dickey & Lockman (1990). Detailed Product Description
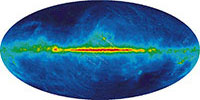
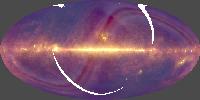
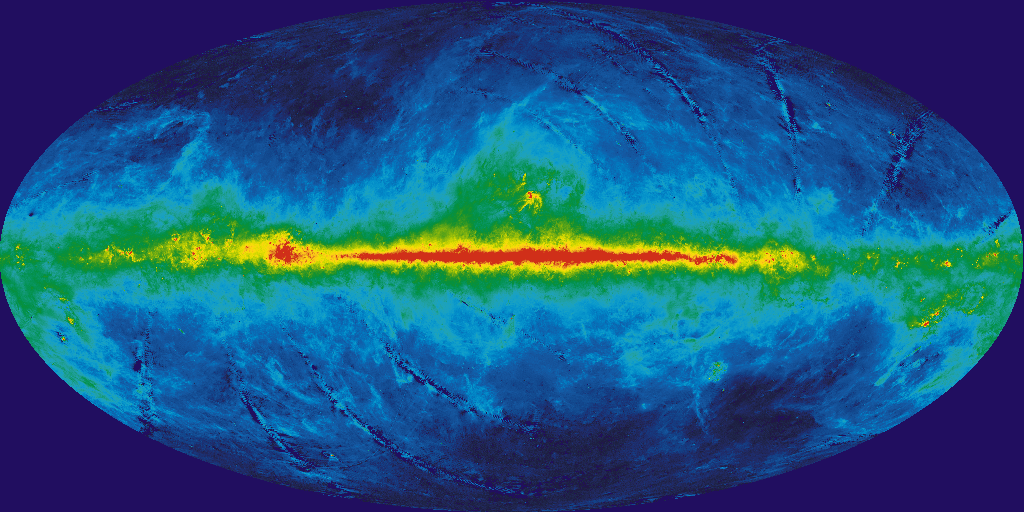
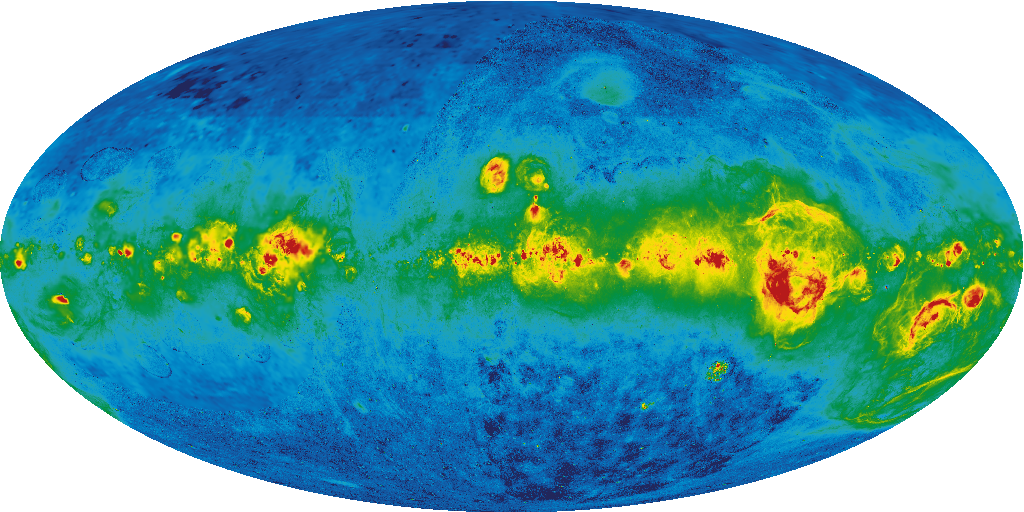
Using a combination of COBE and IRAS data, Finkbeiner, Davis & Schlegel (1999) derived models for thermal dust emission at microwave and submillimeter frequencies. This map is based on their best-fit two-component Model#8. Detailed Product Description
Maps of Galactic reddening, E(B-V), in magnitudes, as derived from IRAS and COBE/DIRBE data by Schlegel, Finkbeiner and Davis (1998), from Pan-STARRS1 stellar photometry by Schlafly et al. (2014), from Pan-STARRS1 and 2MASS stellar photometry by Green et al. (2015) and Green et al. (2018), from Planck and DIRBE/IRAS data by Meisner and Finkbeiner (2015), from HI4PI data together with the Schlegel, Finkbeiner and Davis reddening map by Lenz et al. (2017), and from Pan-STARRS1 and 2MASS stellar photometry and Gaia parallaxes by Green et al. (2019). Detailed Product Descriptions: SFD98, Schlafly et al., Green et al. 2015, Meisner and Finkbeiner 2015, Green et al. 2018, Lenz et al. 2017, Green et al. 2019
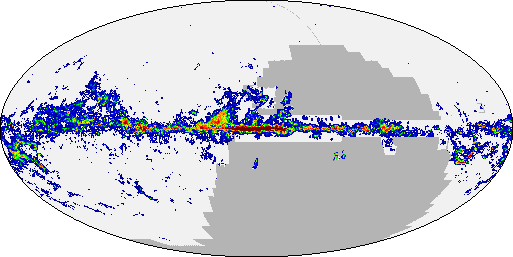
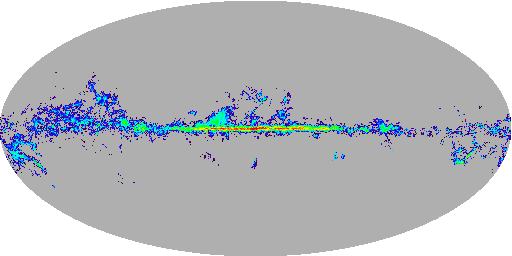
The Dame et al. (2001) composite map of interstellar molecular clouds, as traced by the 115 GHz line of Carbon Monoxide (CO). The CO line intensity has been integrated over all observed velocities. Detailed Product Description
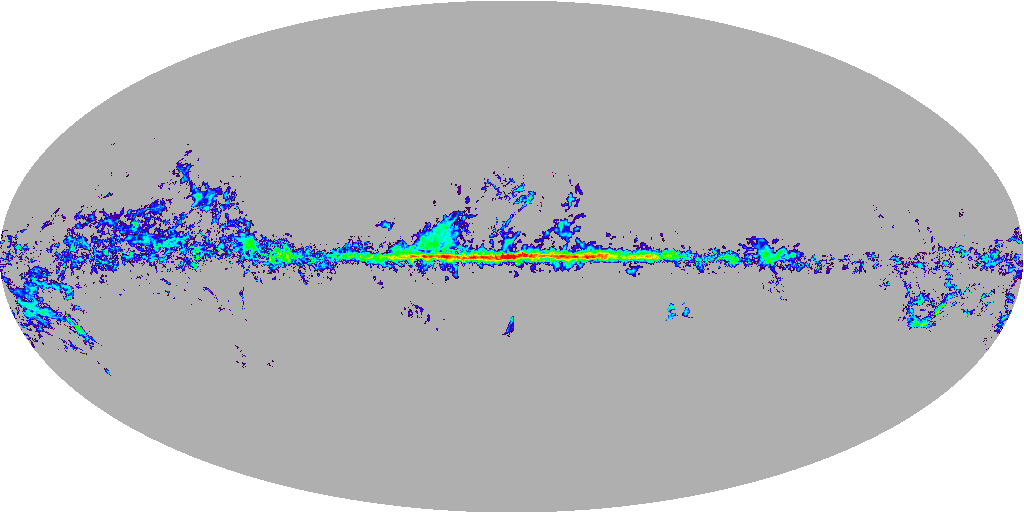
Map of 115 GHz Carbon Monoxide (CO) line intensity, formed by combining the earlier Dame et al. 2001 survey with the northern sky survey of Dame & Thaddeus (2022). The CO line intensity has been integrated over +/-36 km/sec. Detailed Product Description
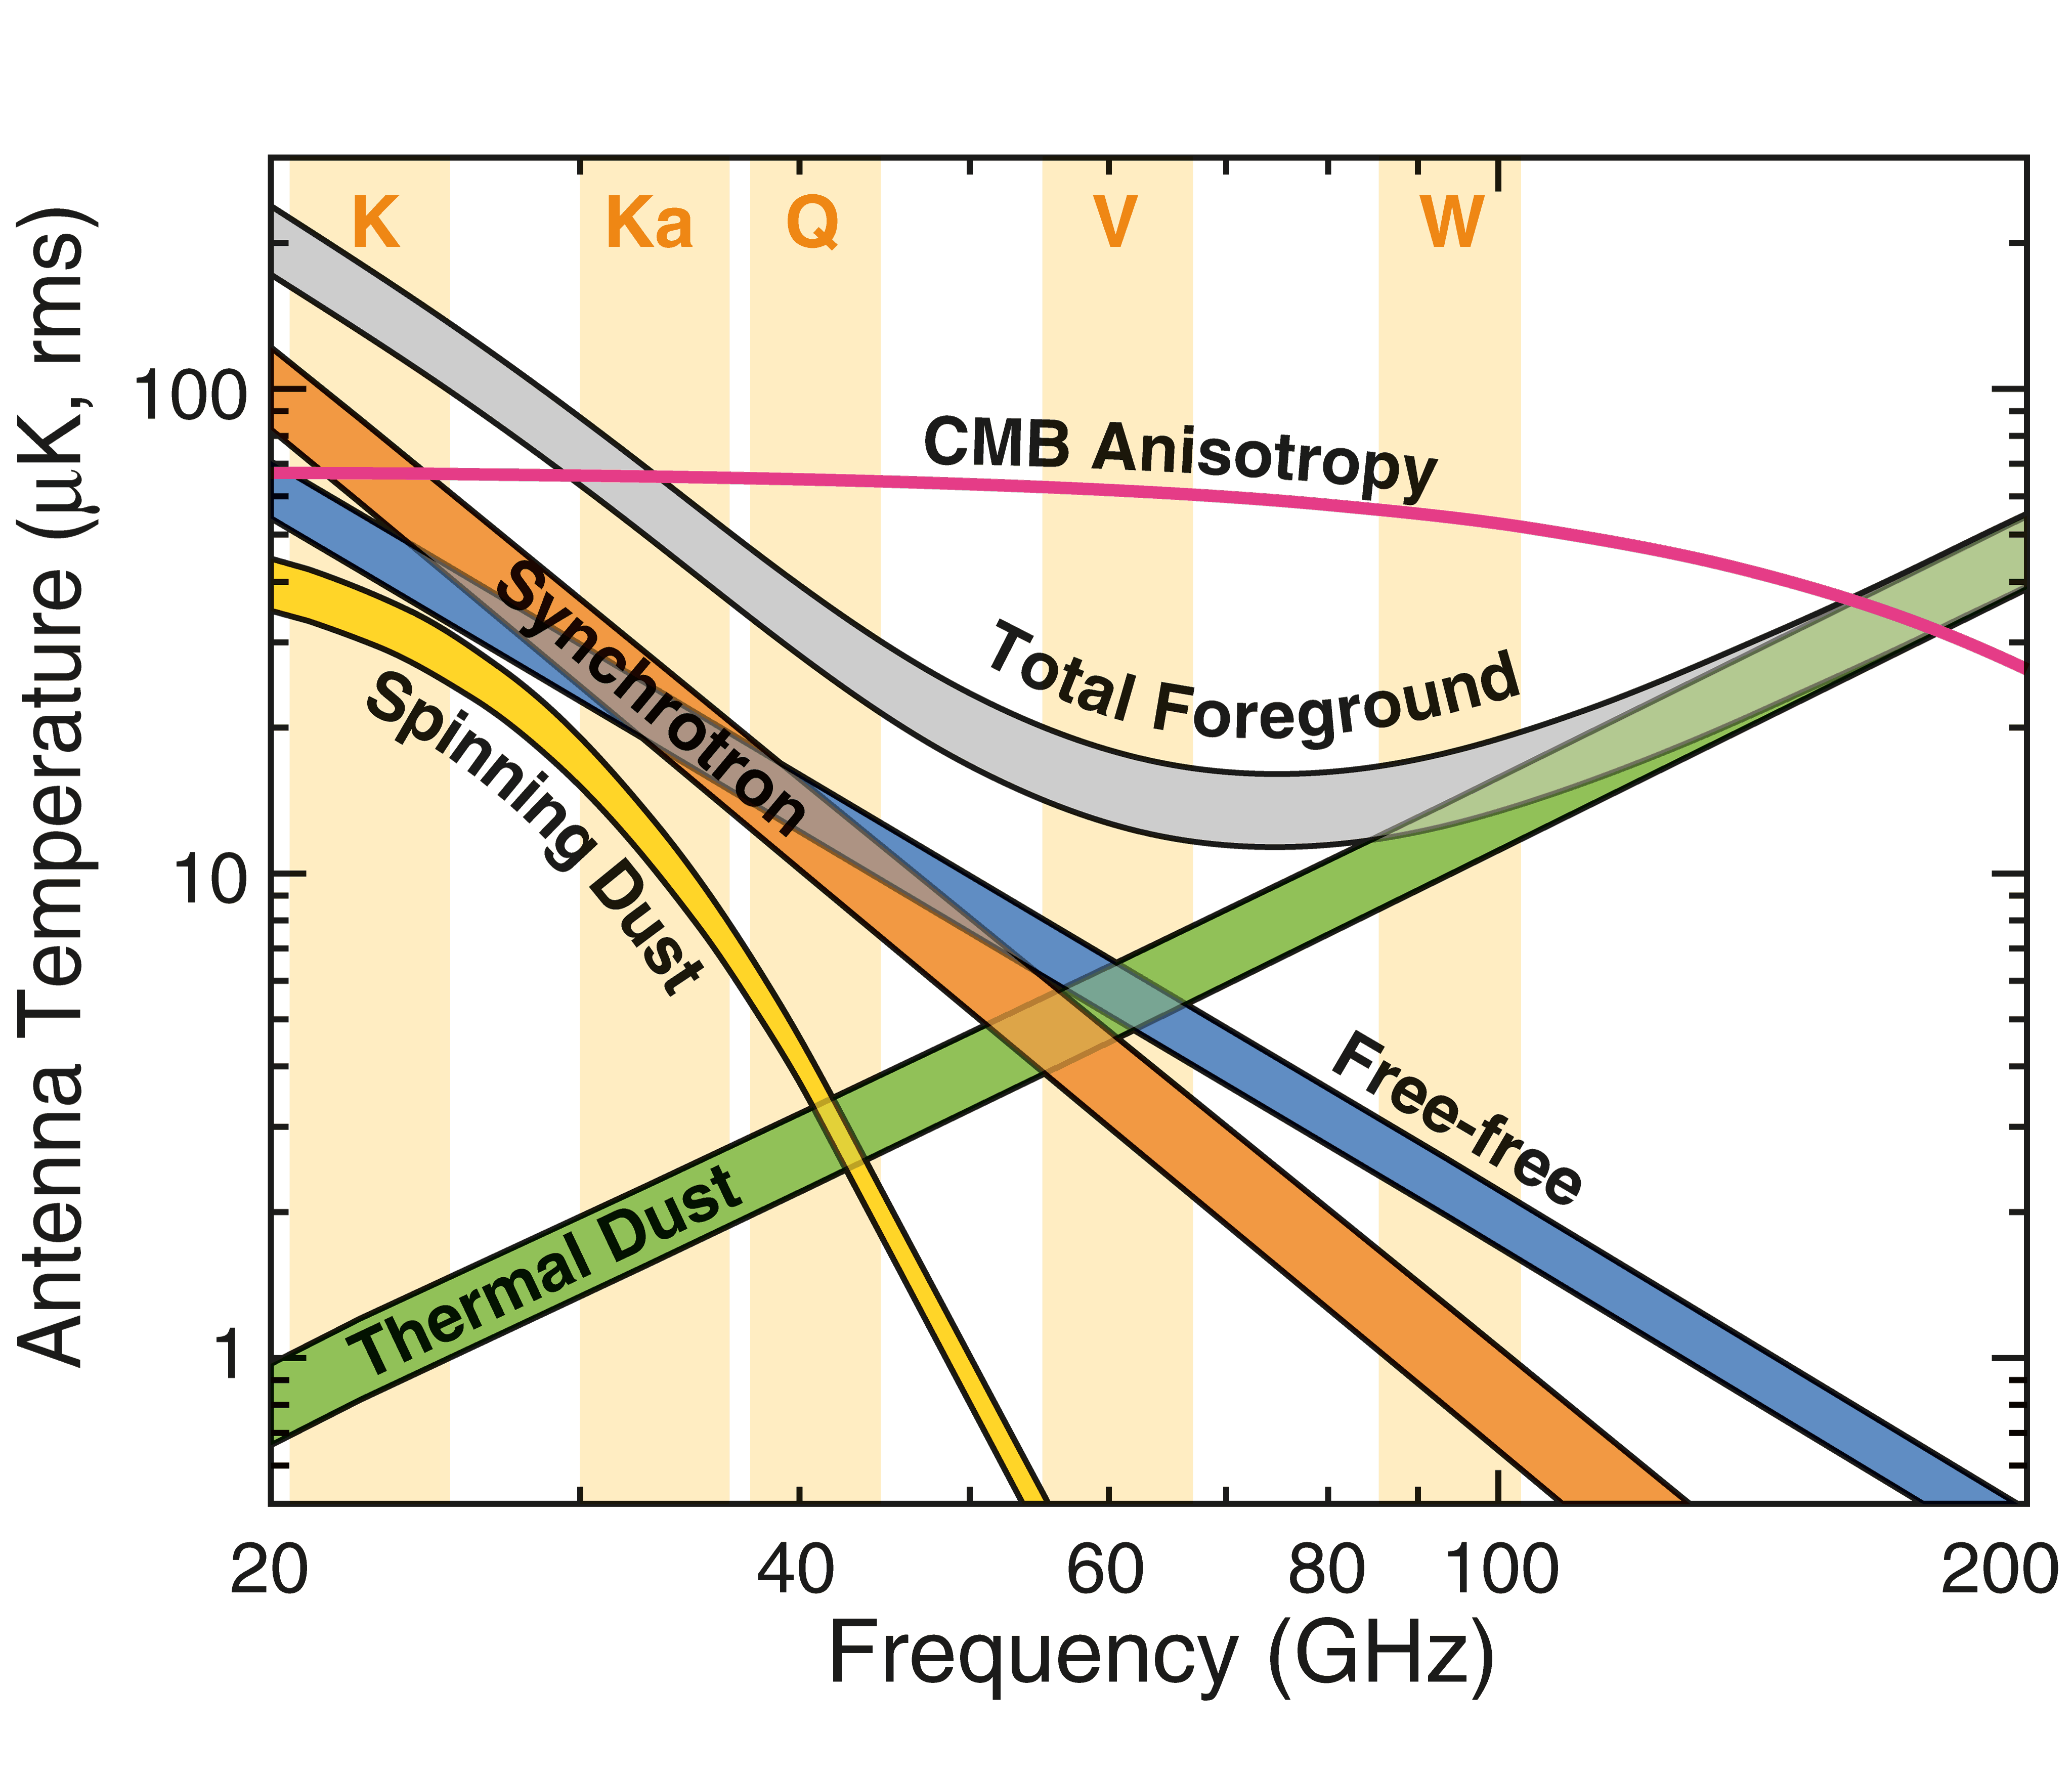
This figure, from Bennett et al. 2013 , shows the rms anisotropy as a function of frequency from the CMB (red line) and sources of foreground emission: synchrotron, free-free, spinning dust, and thermal dust emission. The lower and upper curves for each foreground component show the anisotropy for two sky cuts, retaining 77% and 85% of the sky respectively.


