

Foreground Polarization
Three-Year Wilkinson Microwave Anisotropy Probe (WMAP) Observations: Foreground Polarization, A. Kogut, et al., 2007ApJ...665..355K, reprint / preprint (0.6MB) / bundled figures (298KB) / individual figures / ADS / astro-ph
| WMAP Three-year Paper Figures, Kogut, et al. | ||
| Individual figures are provided for use in talks. Proper display of PNG transparency in PowerPoint requires saving files to your computer before Inserting them. Please acknowledge the WMAP Science Team when using these images. Image Credit: NASA / WMAPScience Team |
||
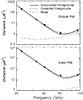 |
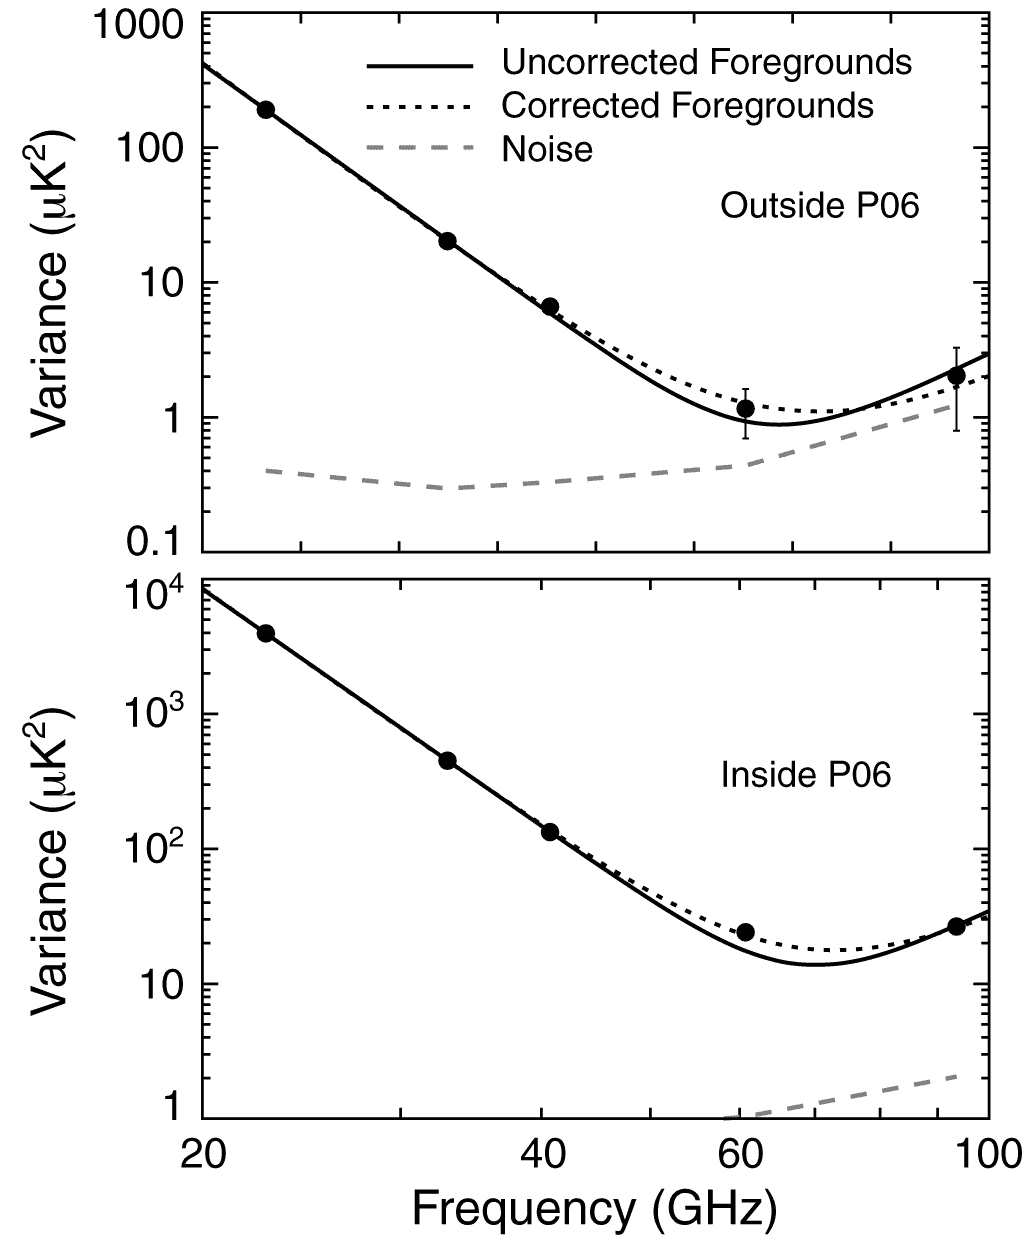
Fig. 1 Estimated signal variance at each WMAP frequency band for 3.°7 pixels. The solid line shows a two-component fit with power-law synchrotron and thermal dust emission assuming no spatial correlations between the two components. |
PNG (12 kb - 512x619 pixels) PNG (27 kb - 1024x1238 pixels) PS (65 kb) |
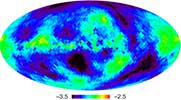 |
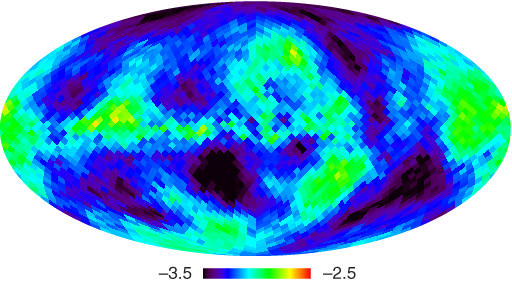
Fig. 2 Spectral index of polarized synchrotron emission between 22 and 33 GHz (Mollweide projection in Galactic coordinates). The map has been smoothed with a position-dependent tophat varying from 7° radius near the plane to 18° radius at high latitude. |
PNG (57 kb - 283x512 pixels) PNG (105 kb - 566x1024 pixels) EPS (384 kb) |
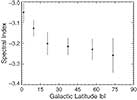 |
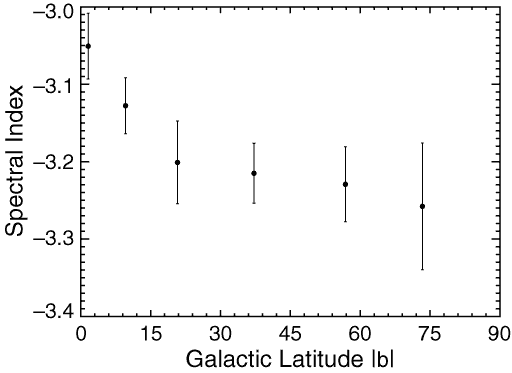
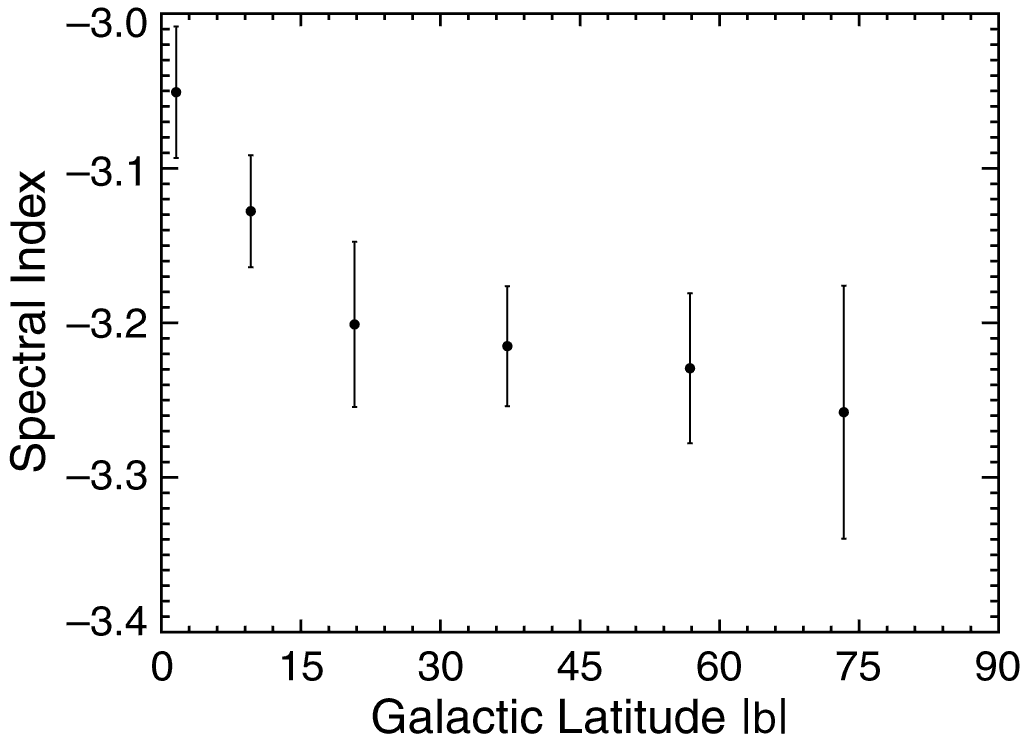
Fig. 3 Spectral index of polarized synchrotron emission binned by Galactic latitude. The spectral index steepens off the Galactic plane. Similar behavior is observed in external edge-on spiral galaxies. |
PNG (6 kb - 373x512 pixels) PNG (12 kb - 745x1024 pixels) PS (29 kb) |
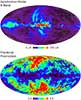 |
Fig. 4 Polarized synchrotron model parameters. (Top) Antenna temperature P = (Q²+U²)0.5 of polarized synchrotron emission at K band. Vectors indicate the polarization direction. (Bottom) Synchrotron fractional polarization, derived by dividing the polarized model by the unpolarized maximum-entropy synchrotron model at K band. |
PNG (278 kb - 514x634 pixels) PNG (731 kb - 1028x1268 pixels) EPS (625 kb) |
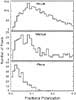 |
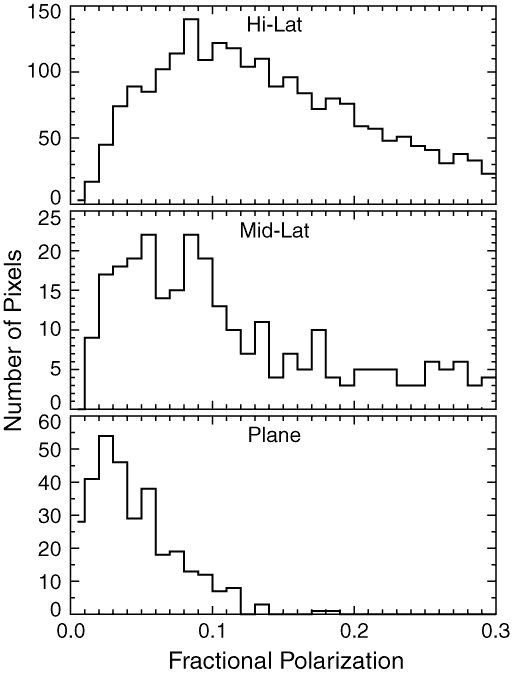
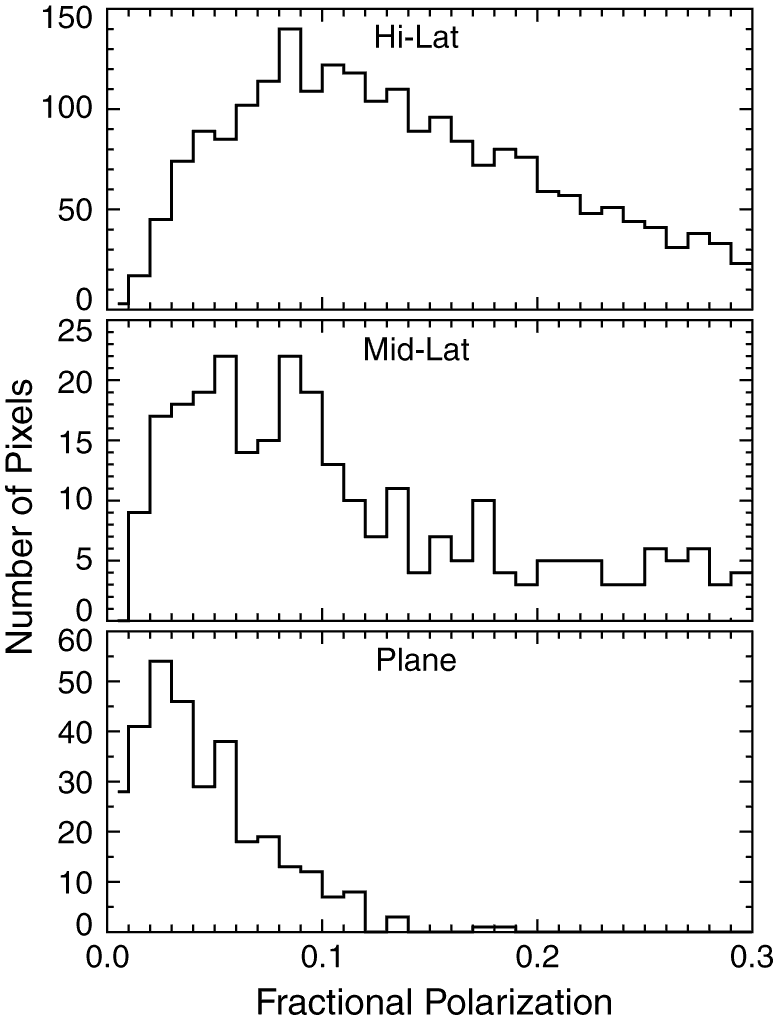
Fig. 5 Histogram of synchrotron fractional polarization fs. (Top) High latitude region outside the P06 mask. (Middle) Mid-latitude region inside P06 but with |b| > 5°. (Bottom) Galactic plane, |b| < 5°. |
PNG (9 kb - 512x675 pixels) PNG (14 kb - 777x1024 pixels) PS (48 kb) |
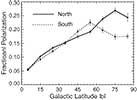 |
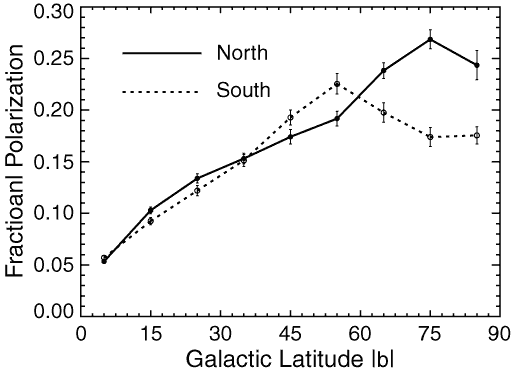
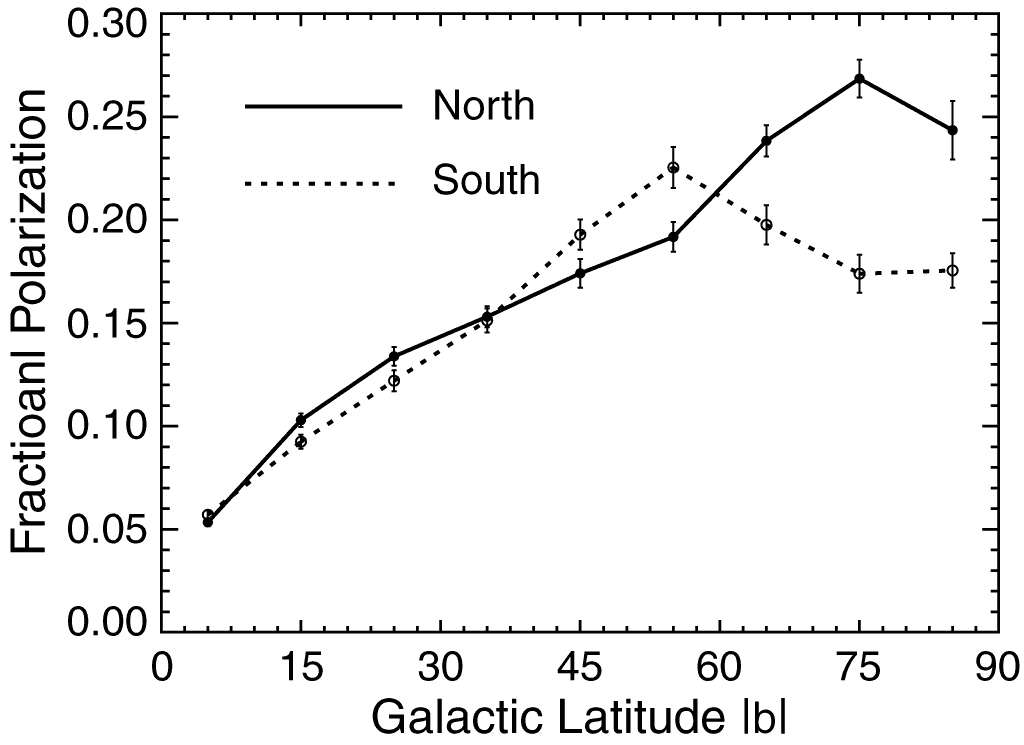
Fig. 6 Synchrotron fractional polarization fs binned by Galactic latitude for the northern (filled symbols) and southern (open symbols) hemispheres. Each point shows the mean fractional polarization fs for all pixels in a latitude bin with signal-to-noise ratio greater than one. |
PNG (8 kb - 373x512 pixels) PNG (17 kb - 745x1024 pixels) PS (47 kb) |
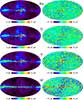 |
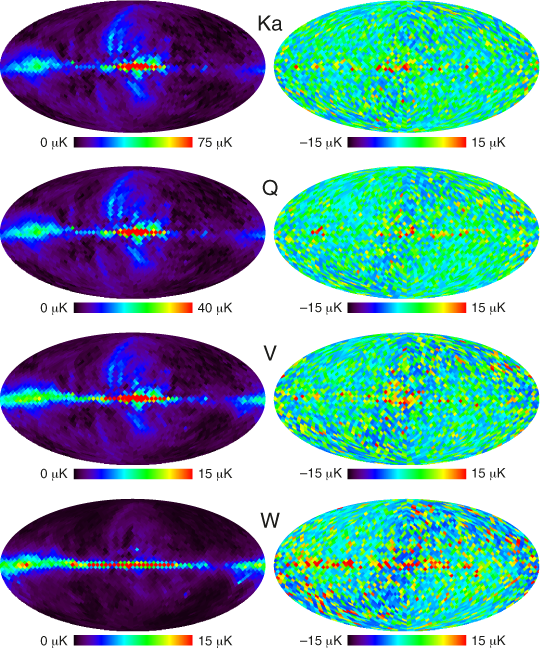
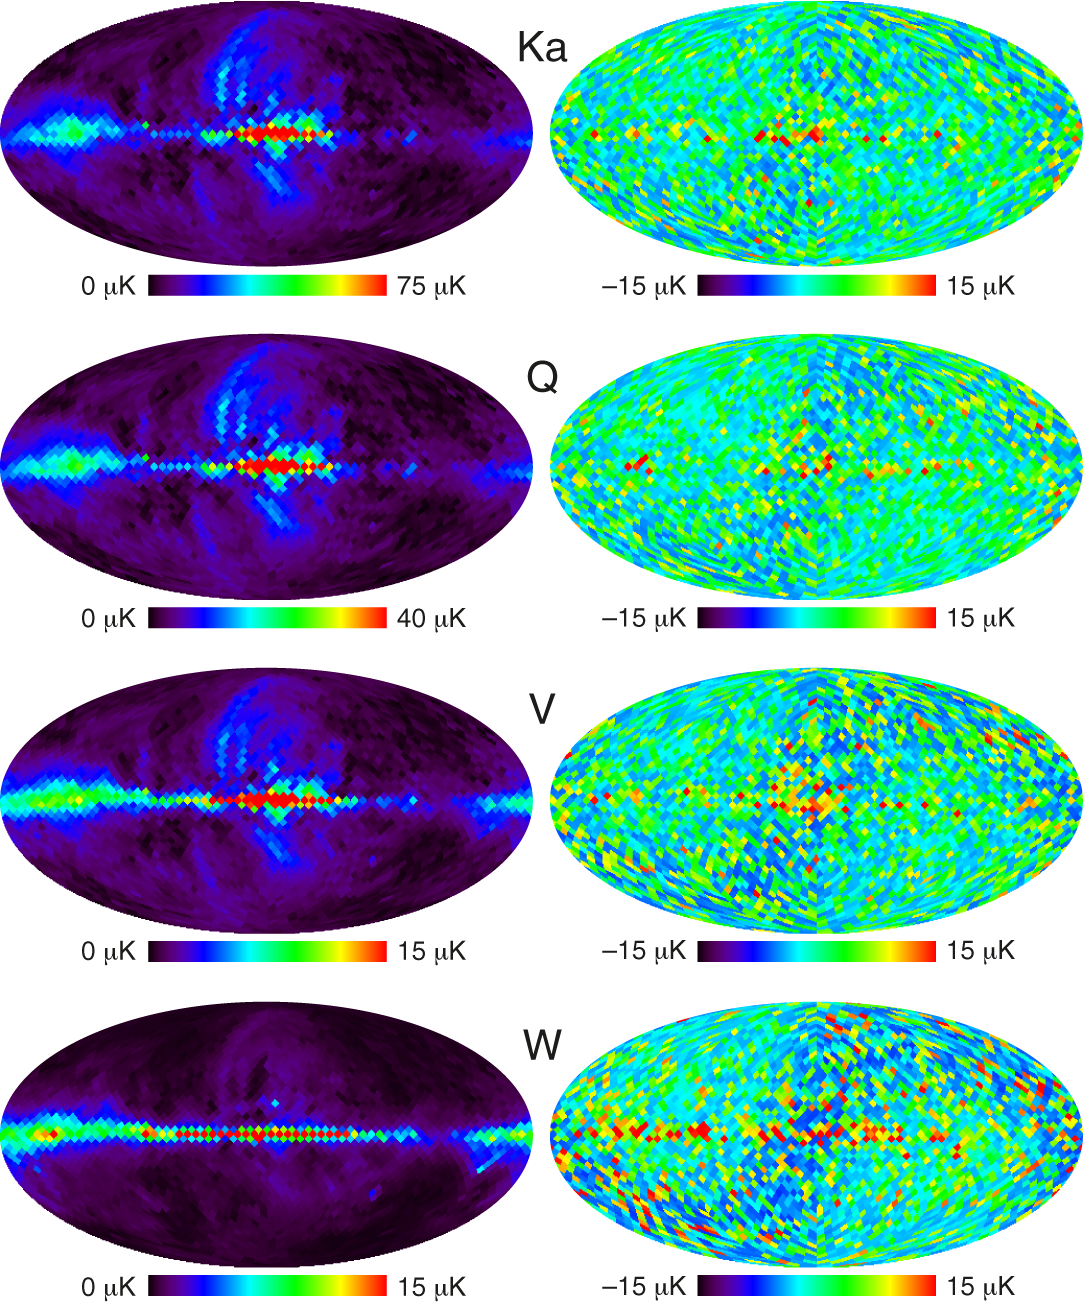
Fig. 7 Polarized foreground model and residuals for the pixel-by-pixel polarization model. (Left) Antenna temperature of polarized emission at each band. The polarization direction is not shown. (Right) Residuals after subtracting foreground model. |
PNG (558 kb - 540x650 pixels) PNG (1.5 mb - 1084x1305 pixels) EPS (670 kb) |
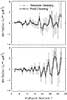 |
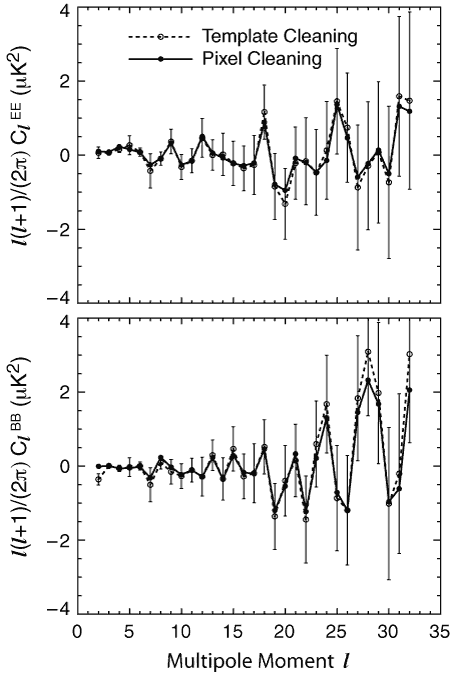
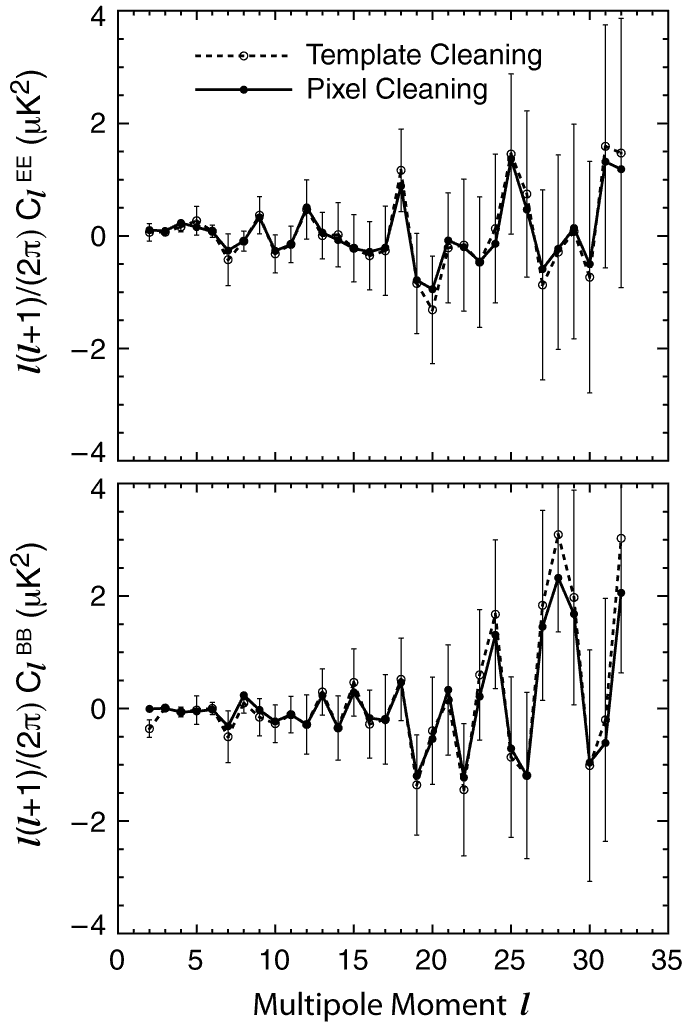
Fig. 8 CMB power spectra outside the P06 mask, derived from Q and V band data after subtracting two different foreground models. (top) EE power spectra. (bottom) BB power spectra. The CMB spectra are robust with respect to different foreground models. |
PNG (16 kb - 450x674 pixels) PNG (25 kb - 684x1024 pixels) PS (78 kb) |
