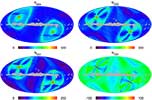
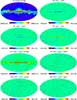
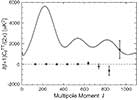
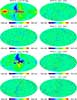
WMAP 3-Year Paper Figures
| WMAP 3-year Paper Figures, Jarosik et al. | ||
|
Figures from the paper "
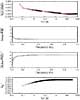
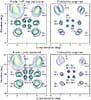
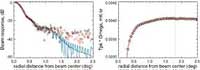
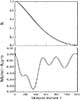
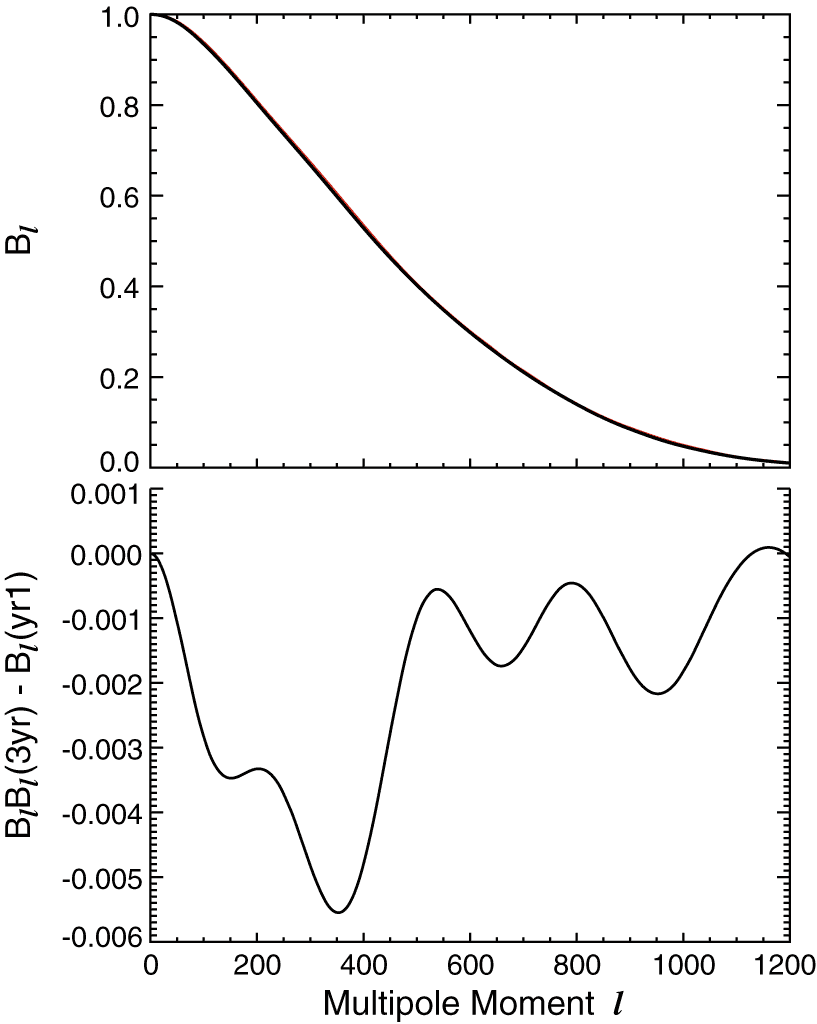
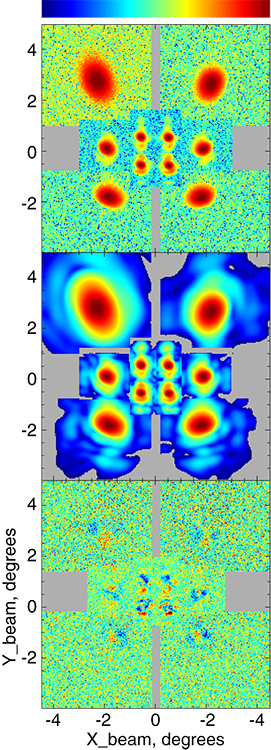
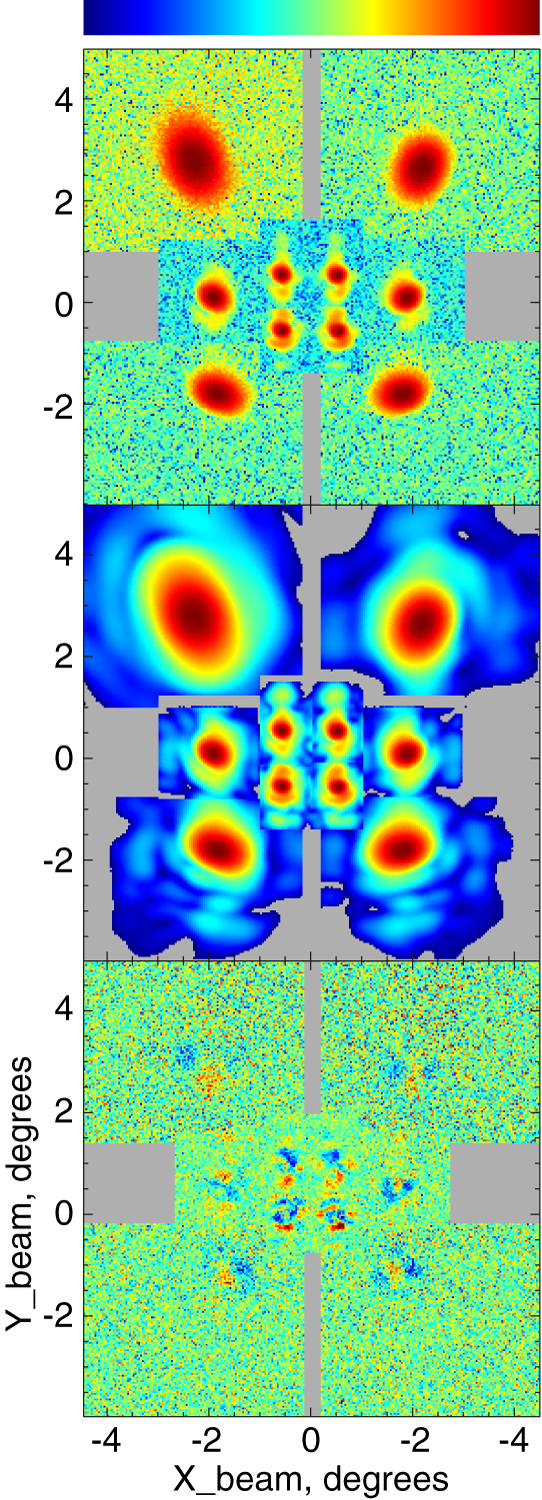
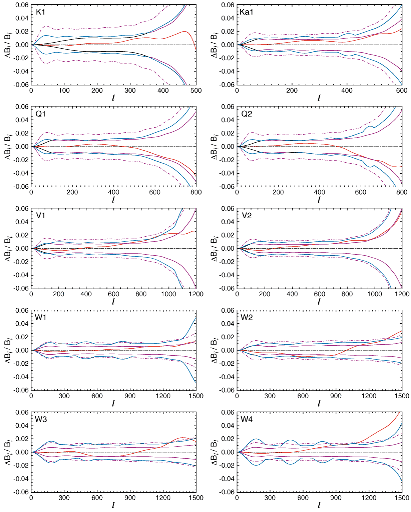
Three-Year Wilkinson Microwave Anisotropy Probe (WMAP) Observations: Beam Profiles, Data Processing, Radiometer Characterization and Systematic Error Limits" in a form suitable for use in talks. Please acknowledge the WMAP Science Team when using these images. |
||
![]() |
Fig.1 The temperature of the middle of the B side primary mirror vs. the Sun azimuth in the spacecraft coordinate system. The red data were taken during the first year of observations, the black during the second and the blue during the third. |
PNG (8 kb - 365x512 pixels) PNG (18 kb - 729x1024 pixels) EPS (15 kb) |
![]() |
Fig. 2 Comparison of the hourly gain determinations (black) based on measurement of the CMB dipole to two different versions of the radiometer gain model. These data are for the V223 detector and the time range spans the three years of WMAP science data collection. |
PNG (15 kb - 385x512 pixels) PNG (34 kb - 769x1024 pixels) EPS (379 kb) |
![]() |
Fig. 3 Difference between the temperature sky maps produced using two different gain models. Raw data from from the V2 differencing assembly for year-1 was processed both with the original (year-1) and the improved (3-year) gain models. |
PNG (90 kb - 298x512 pixels) PNG (122 kb - 596x1024 pixels) EPS (266 kb) |
![]() |
Fig. 4 Amplitude of the quadrupole difference between temperature maps produced using the original and improved gain models. The horizontal axis is the difference between the mean slopes of the gain models. |
PNG (7 kb - 375x512 pixels) PNG (16 kb - 750x1024 pixels) EPS (17 kb) |
![]() |
Fig. 5 Noise and Filter Properties of the W11 Radiometer. The top panel displays the measured autocorrelation function of the W11 radiometer noise (black diamonds) and the parameterized fit to these data (red line) as described in § 2.5. |
PNG (10 kb - 409x512 pixels) PNG (26 kb - 817x1024 pixels) EPS (2.5 mb) |
![]() |
Fig. 6 Predicted (top) and measured (bottom) focal plane for the A side for the co- and cross-polar beams. The contours are spaced by 3 dB and the maximum value of the gain in dBi is given next to selected beams. |
PNG (37 kb - 467x512 pixels) PNG (106 kb - 934x1024 pixels) EPS (429 kb) |
![]() |
Fig. 7 Left: Profile of the A-side V2 band beam comparing year-1 (black), 3-year combined (red), the model of the beam (green), and the Hermite fit to the beam profile (blue). Right: The accumulated solid angle as a function of radius for A-side V2. |
PNG (14 kb - 250x714 pixels) PNG (34 kb - 500x1427 pixels) EPS (22 kb) EPS (10 kb) |
![]() |
Fig. 8 The beam transform for the A side of the V2 DA, comparing first-year and 3-year results. The top panel shows the beam transform from both the first year (red) and 3-year (black) analysis - they are nearly indistinguishable at this level. |
PNG (8 kb - 409x512 pixels) PNG (19 kb - 817x1024 pixels) EPS (36 kb) EPS (28 kb) |
![]() |
Fig. 9 Beams in the WMAP focal plane. The top panel shows the measured beams, the middle panel shows the beam model, and the bottom panel shows the residuals. |
PNG (399 kb - 271x750 pixels) PNG (1.2 mb - 542x1500 pixels) EPS (344 kb) |
![]() |
Fig. 10 The uncertainties of the beam transform functions for all bands. The uncertainties of the window functions are double these. The cyan lines are the new uncertainties. The black line is the uncertainty for year-1. |
PNG (25 kb - 411x512 pixels) PNG (69 kb - 821x1024 pixels) EPS (331 kb) |
![]() |
Fig. 11 Schematic overview of the 3-year WMAP sky map processing pipeline. Substantive changes from the year-1 processing (Hinshaw et al. 2003a, Figure 1) are indicated in boldface. |
PNG (20 kb - 427x512 pixels) PNG (59 kb - 853x1024 pixels) EPS (120 kb) |
![]() |
Fig. 12 Difference between the low-l polarization power spectra with and without removal of the transmission-imbalance modes from the N-1 matrices. The black and red lines are the differences between the power spectra of combined Q-band and V-band polarization data for the E and B modes respectively. |
PNG (8 kb - 374x512 pixels) PNG (17 kb - 747x1024 pixels) EPS (11 kb) |
![]() |
Fig. 13 Maps of the Nobs, NQQ, NUU, and NQU weights for K band year-1 spm sky coverage. These maps are measures of the noise covariance and are used when the maps are degraded from r9 to r4. |
PNG (231 kb - 341x518 pixels) PNG (1.0 mb - 681x1035 pixels) EPS (1.0 mb) |
![]() |
Fig. 14 WMAP 3-year combined and year-by-year difference maps of Stokes I for K-band and V-band. The residual Galactic plane features in the K-band difference maps are consistent with the absolute calibration error of 0.5 %. |
PNG (459 kb - 500x648 pixels) PNG (1.7 mb - 1000x1296 pixels) EPS (2.1 mb) |
![]() |
Fig. 15 Cross power spectrum of year-1 and year-2 null maps. For each year Stokes I null maps were formed for DA combinations ((V1-V2) + (W1-W2) + (W3-W4))/6, and the year-to-year cross spectrum calculated. |
PNG (8 kb - 369x512 pixels) PNG (17 kb - 738x1024 pixels) EPS (21 kb) |
![]() |
Fig. 16 WMAP 3-year combined and year-by-year difference maps of Stokes Q (top 4 panels) and U (bottom 4 panels) for K-band. Galactic foreground emission is clearly visible in both Stokes Q and U of the three year combined maps. |
PNG (552 kb - 500x653 pixels) PNG (2.0 mb - 1000x1305 pixels) EPS (2.1 mb) |


