FIRAS Scientific ResultsThe images shown below depict data taken with the Far Infrared Absolute Spectrophotometer (FIRAS) instrument aboard NASA's Cosmic Background Explorer (COBE). The colors generally do not map linearly into sky brightness. Use the FIRAS data products for quantitative analysis. Additional images are available in the COBE Slide Set. Image Credit: NASA / COBE Science Team To view the original images, click on thumbnails below: 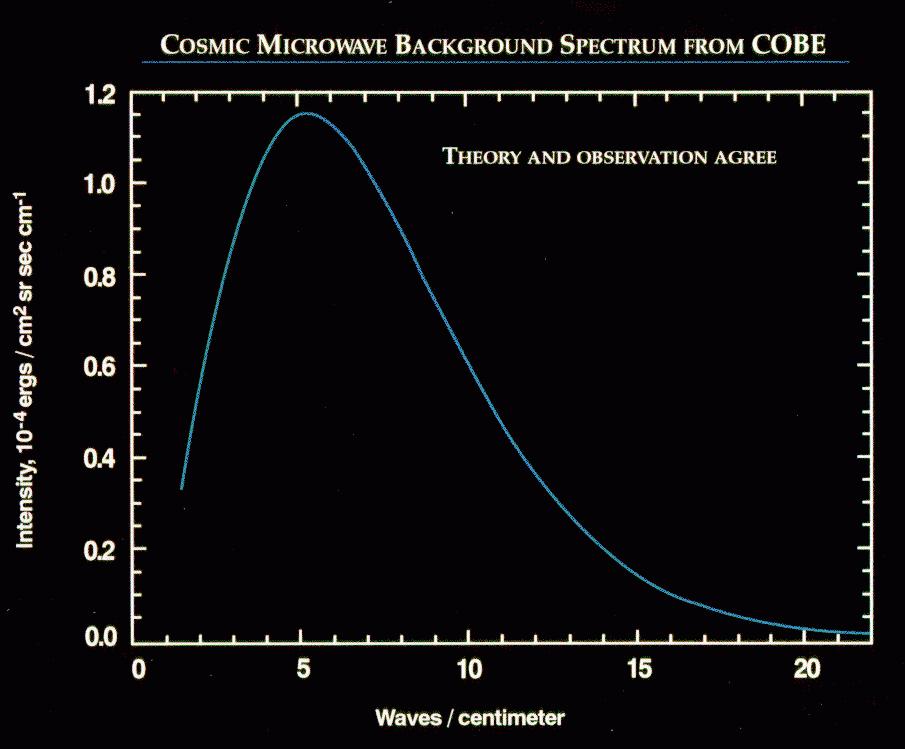
Cosmic Microwave Background (CMB) spectrum plotted in waves per centimeter vs. intensity. The solid curve shows the expected intensity from a single temperature blackbody spectrum, as predicted by the hot Big Bang theory. A blackbody is a hypothetical body that absorbs all electromagnetic radiation falling on it and reflects none whatsoever. The FIRAS data were taken at 43 positions equally spaced along this curve. The FIRAS data match the curve so exactly, with error uncertainties less than the width of the blackbody curve, that it is impossible to distinguish the data from the theoretical curve. These precise CMB measurements show that 99.97% of the radiant energy of the Universe was released within the first year after the Big Bang itself. All theories that attempt to explain the origin of large scale structure seen in the Universe today must now conform to the constraints imposed by these measurements. The results show that the radiation matches the predictions of the hot Big Bang theory to an extraordinary degree. See Mather et al. 1994, Astrophysical Journal, 420, 439, "Measurement of the Cosmic Microwave Background Spectrum by the COBE FIRAS Instrument,"Wright et al. 1994, Astrophysical Journal, 420, 450,"Interpretation of the COBE FIRAS CMBR Spectrum," and Fixsen et al. 1996, Astrophysical Journal, 473, 576,"The Cosmic Microwave Background Spectrum from the Full COBE FIRAS Data Sets" for details. In addition to its primary, cosmological objective, the FIRAS provided important new information about the interstellar medium. The far-infrared continuum is formed by thermal emission from interstellar dust, while spectral lines are emitted by interstellar gas. Nine emission lines were detected in the FIRAS spectra: the 158 µm ground state transition of C+; the N+ 122 µm and 205 µm transitions; the 370 µm and 609 µm lines of neutral carbon; and the CO J=2-1, 3-2, 4-3, and 5-4 lines. 
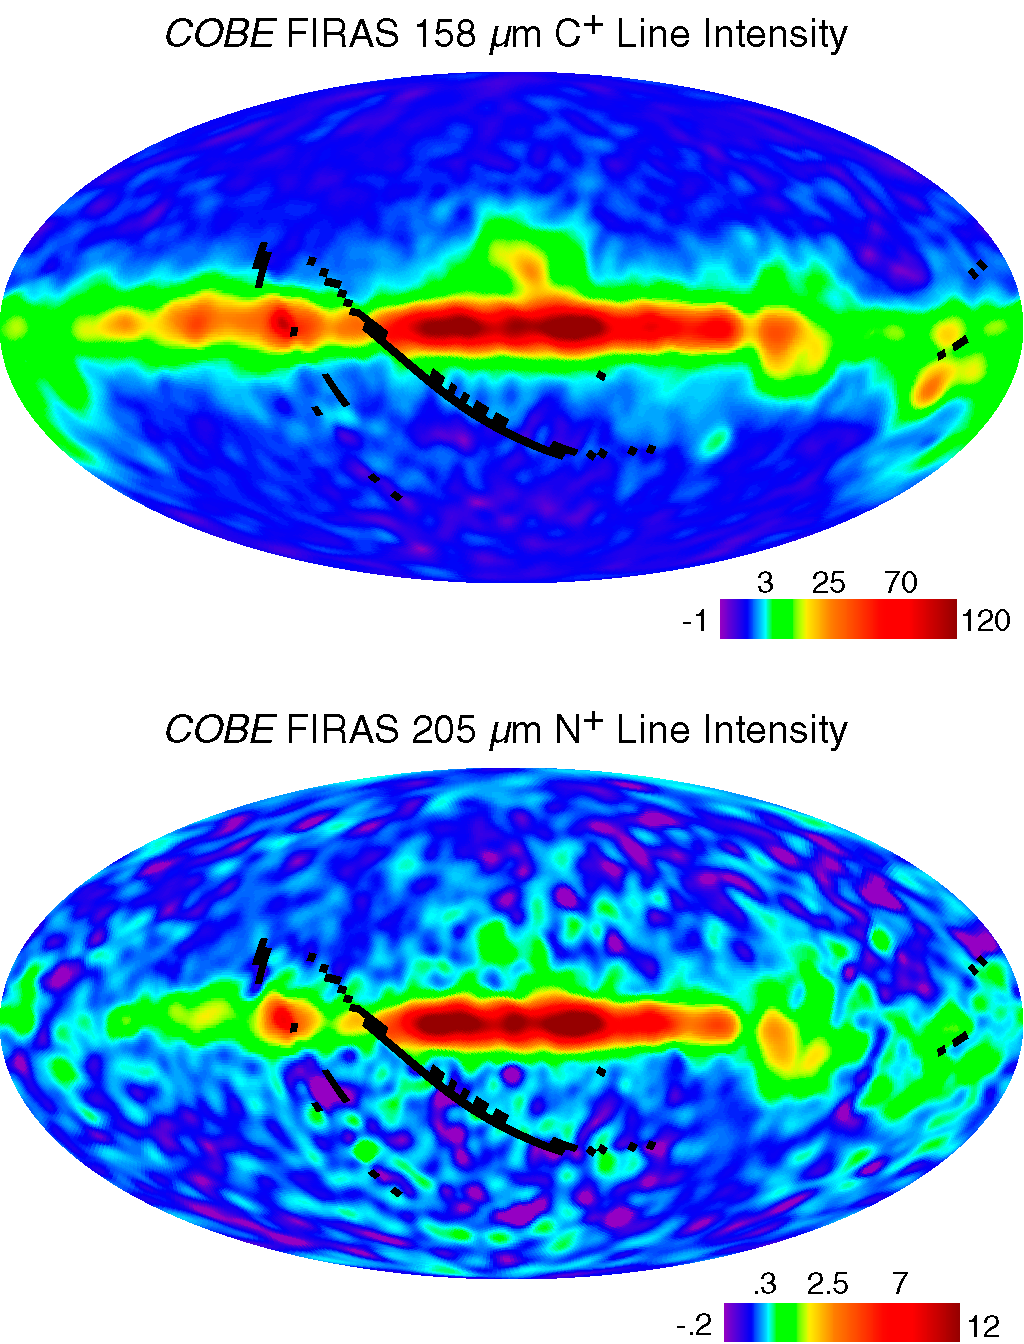
LEFT: An earlier processing of C+ 158 µm and N+ 205 µm line intensity maps from Bennett et al. 1994, Astrophysical Journal, 434, 587,"Morphology of the Interstellar Cooling Lines Detected by COBE" (available electronically as an appendix of the FIRAS Explanatory Supplement). The maps are projections of the full sky in Galactic coordinates. The plane of the Milky Way is horizontal in the middle of the map with the Galactic center at the center. The C+ line (top) is an important coolant of the interstellar gas, in particular the "Cold Neutral Medium" (e.g., surfaces of star-forming molecular clouds). In contrast, the N+ line emission (bottom) arises entirely from the "Warm Ionized Medium" which surrounds hot stars. RIGHT: Updated C+ 158 µm and N+ 205 µm line intensity maps from Fixsen et al. 1999, Astrophysical Journal, 526 207, "COBE/FIRAS Observations of Galactic Lines", Note: The images from 1999 are based on combined destriped data with higher frequency resolution from the FIRAS Pass4 data release. The 1999 images may also be found in the COBE slide set. Maps of H I 21 cm line intensity and I(C+ 158µm)/N(H I) from Bennett et al. 1994, Astrophysical Journal, 434, 587,"Morphology of the Interstellar Cooling Lines Detected by COBE" (available electronically as an appendix of the FIRAS Explanatory Supplement). The projections are the same as those used in the preceding figure. Top: The distribution of atomic hydrogen smoothed to 10-degree resolution for comparison with the FIRAS data. Bottom: C+ cooling rate per hydrogen atom. |