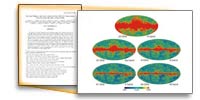
Bennett, et al. Figures from the paper "Nine-Year Wilkinson Microwave Anisotropy Probe (WMAP) Observations: Final Maps and Results" in a form suitable for use in talks. Please acknowledge the WMAP Science Team when using these images.
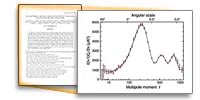
Hinshaw, et al. Figures from the paper "Nine-Year Wilkinson Microwave Anisotropy Probe (WMAP) Observations: Cosmology Results" in a form suitable for use in talks. Please acknowledge the WMAP Science Team when using these images.
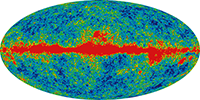
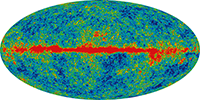
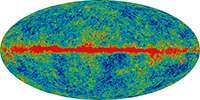
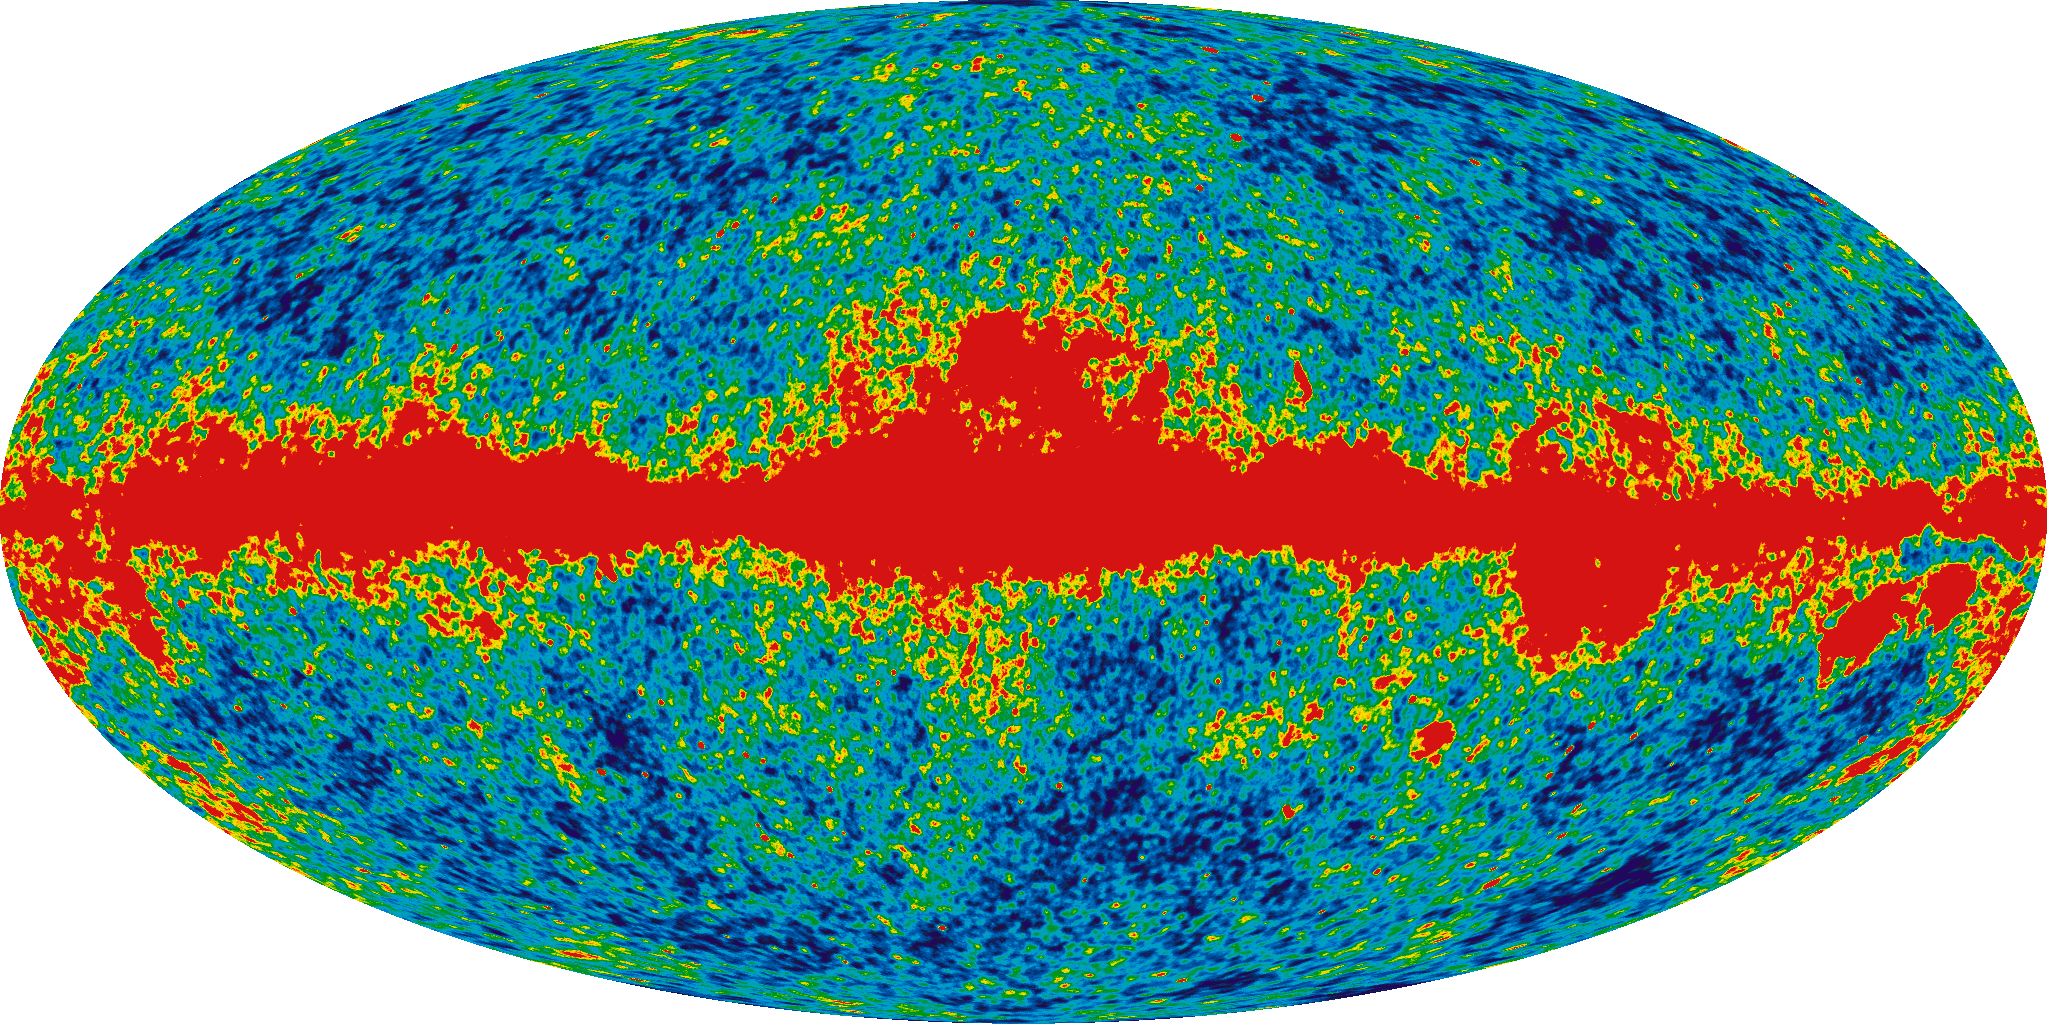
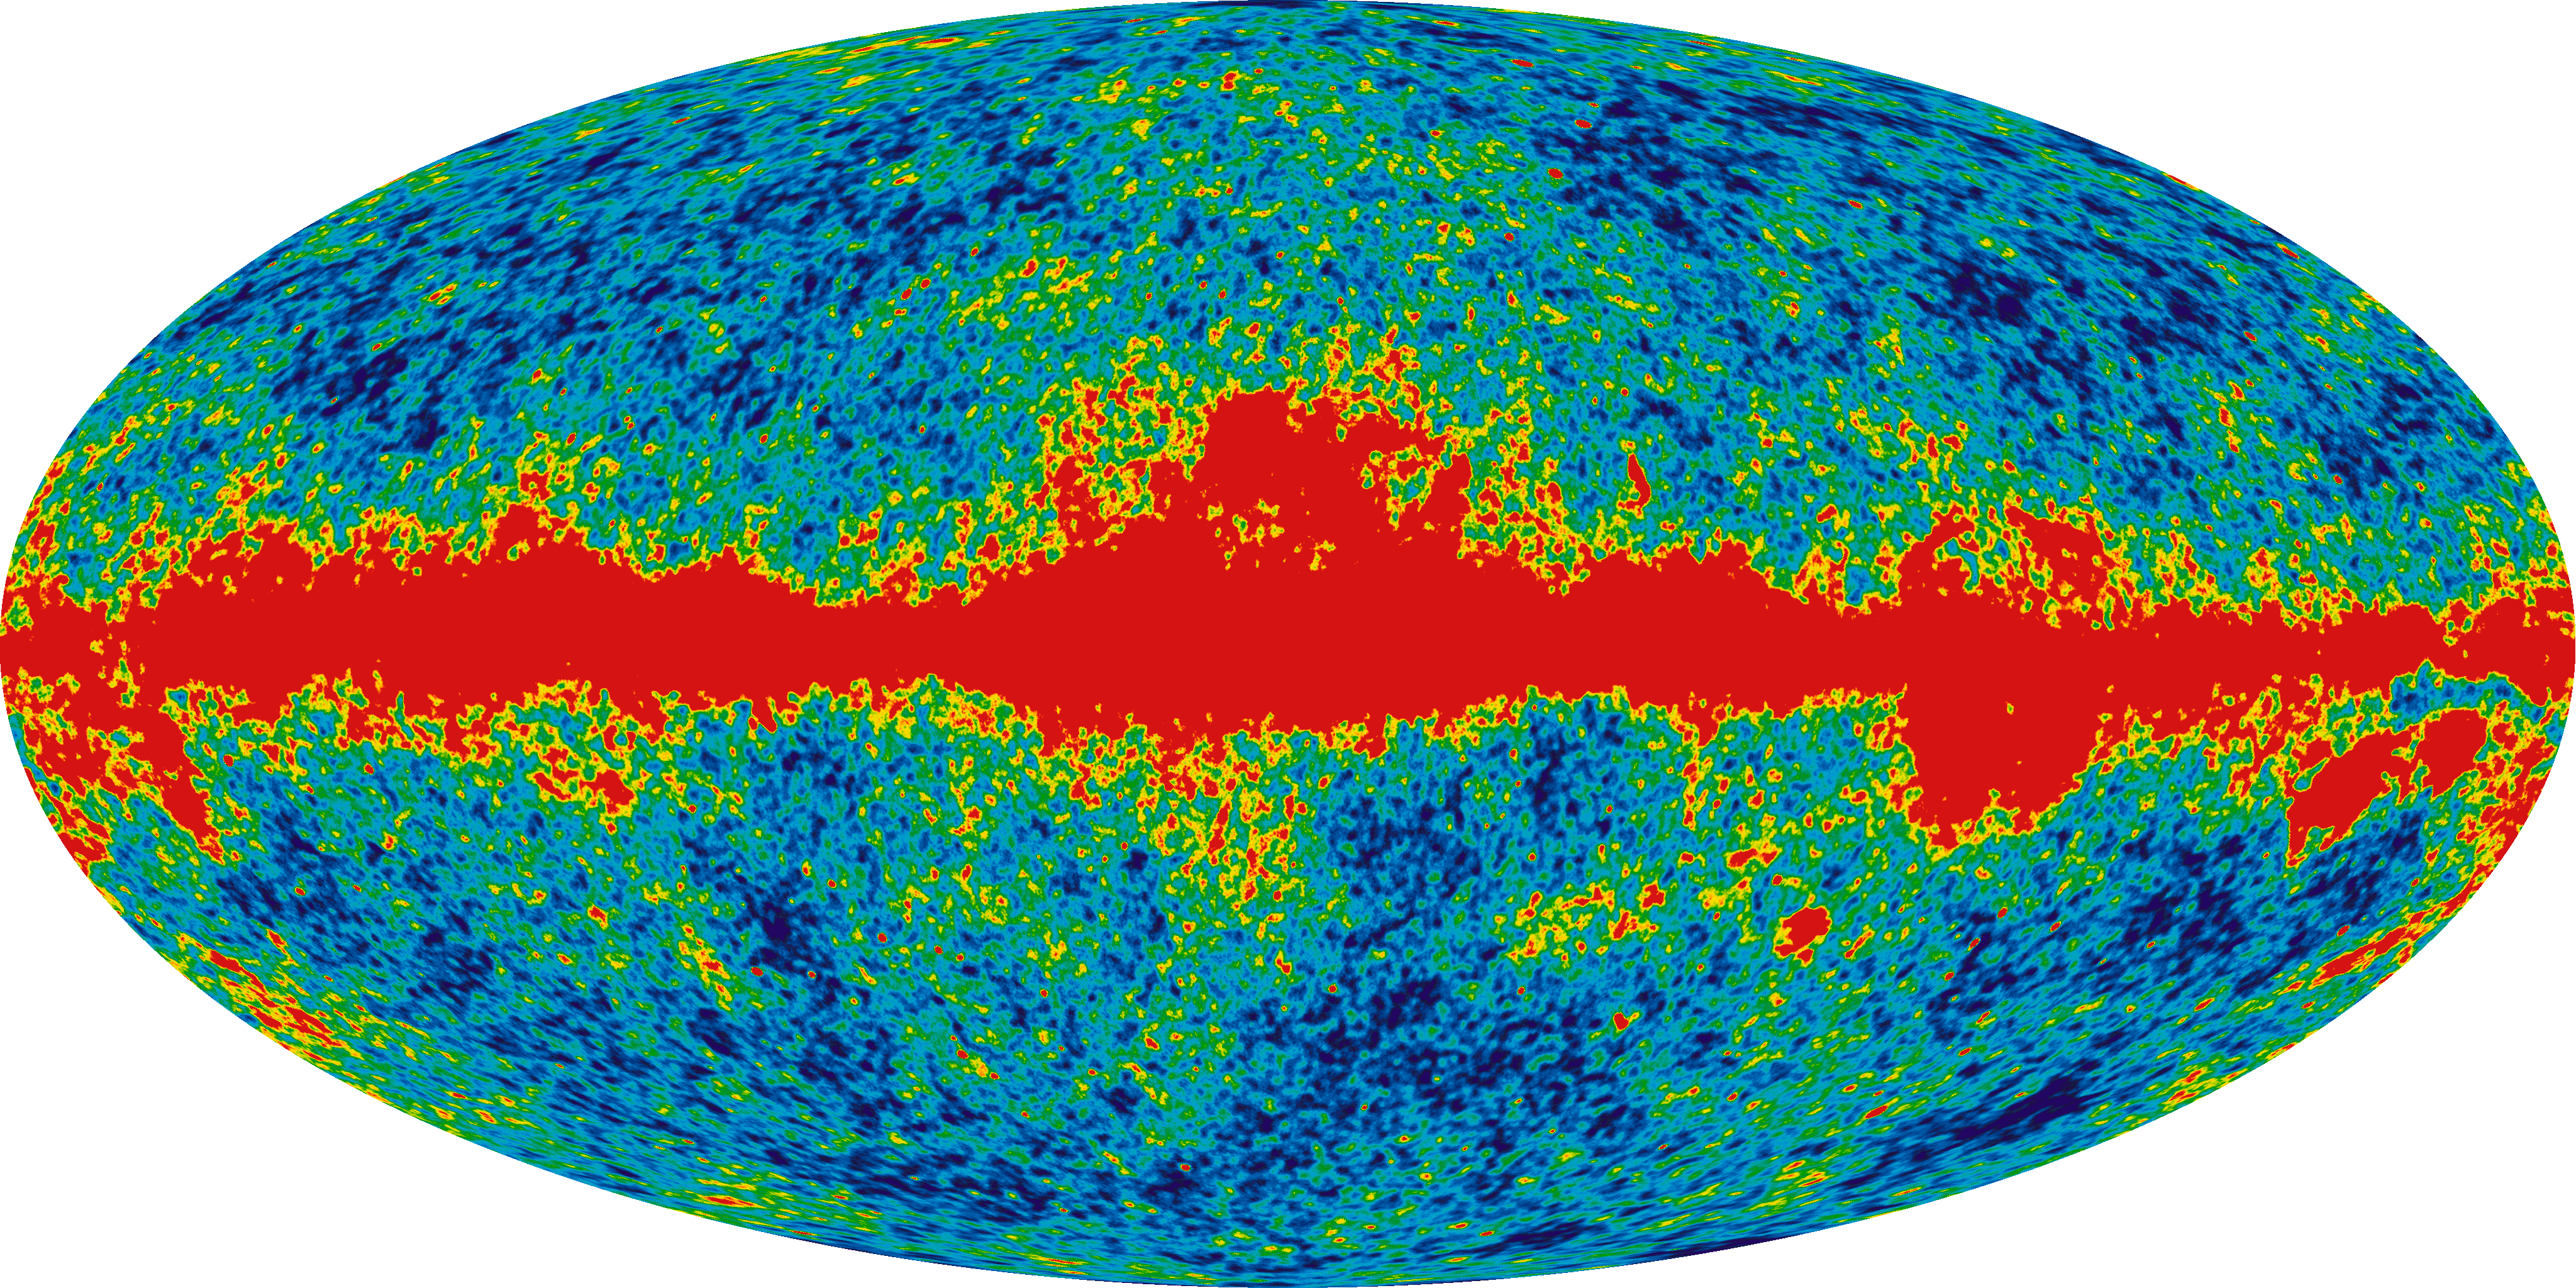
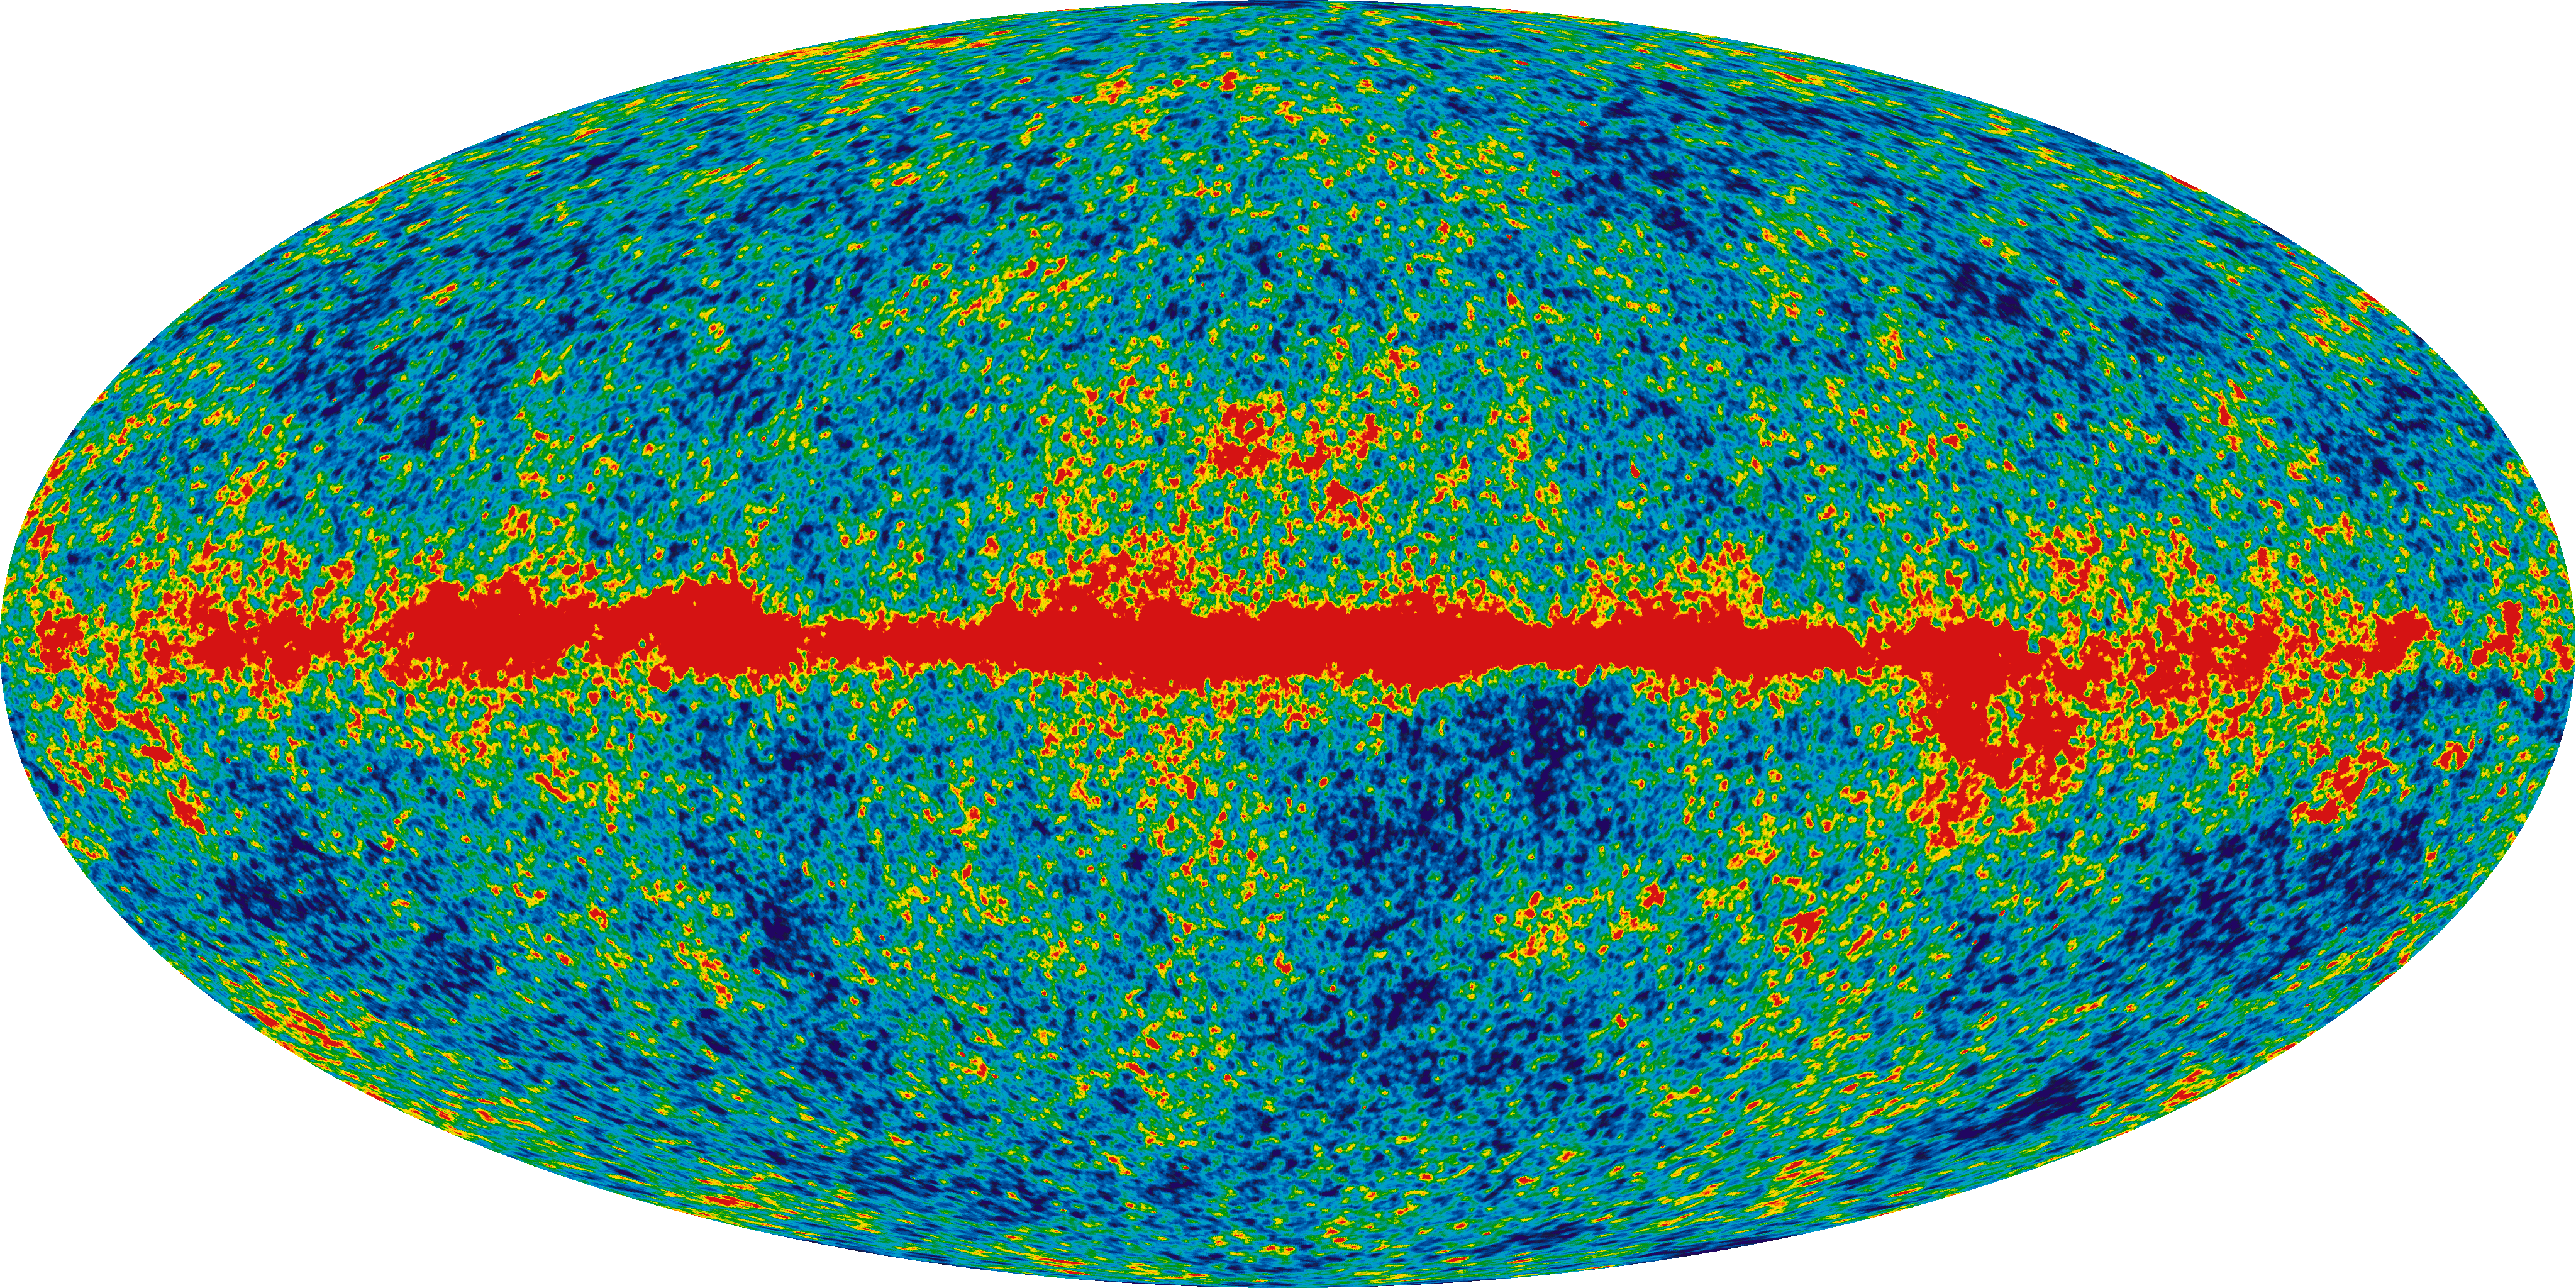
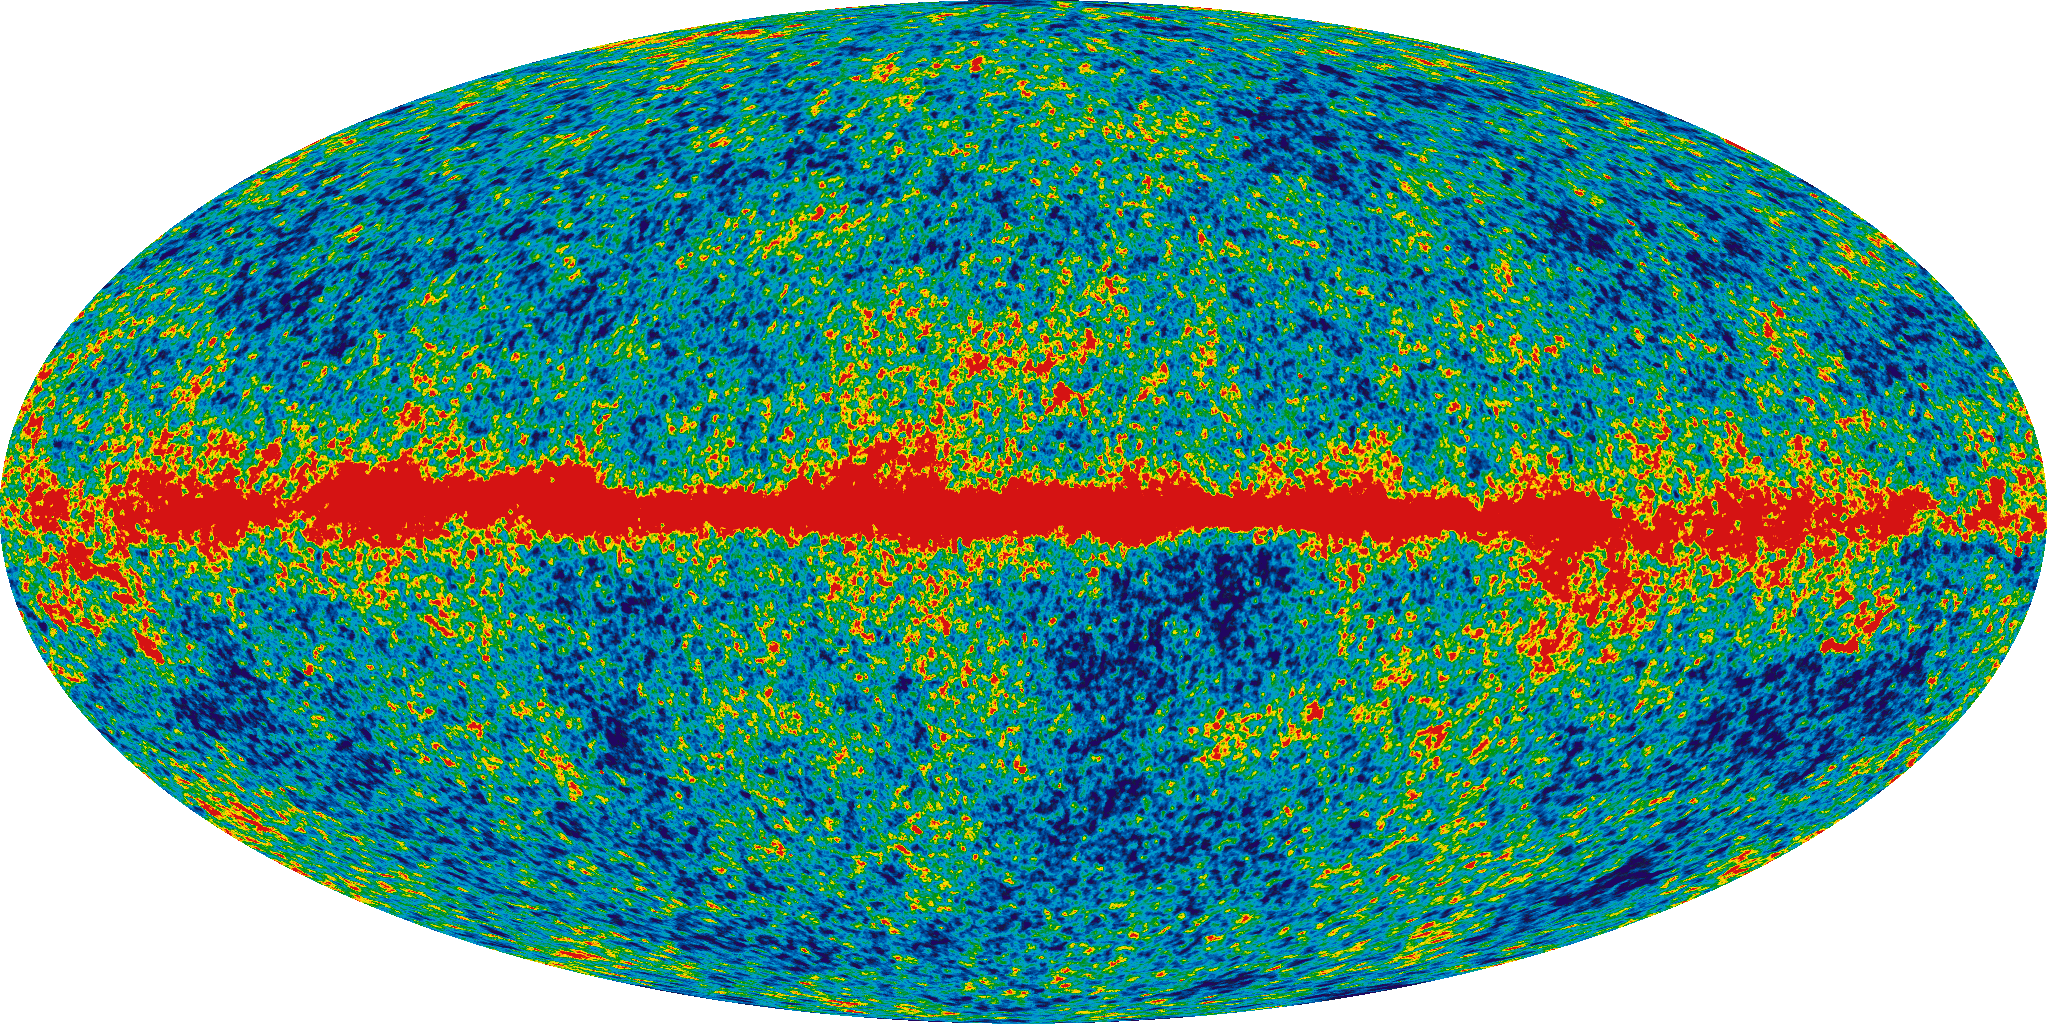
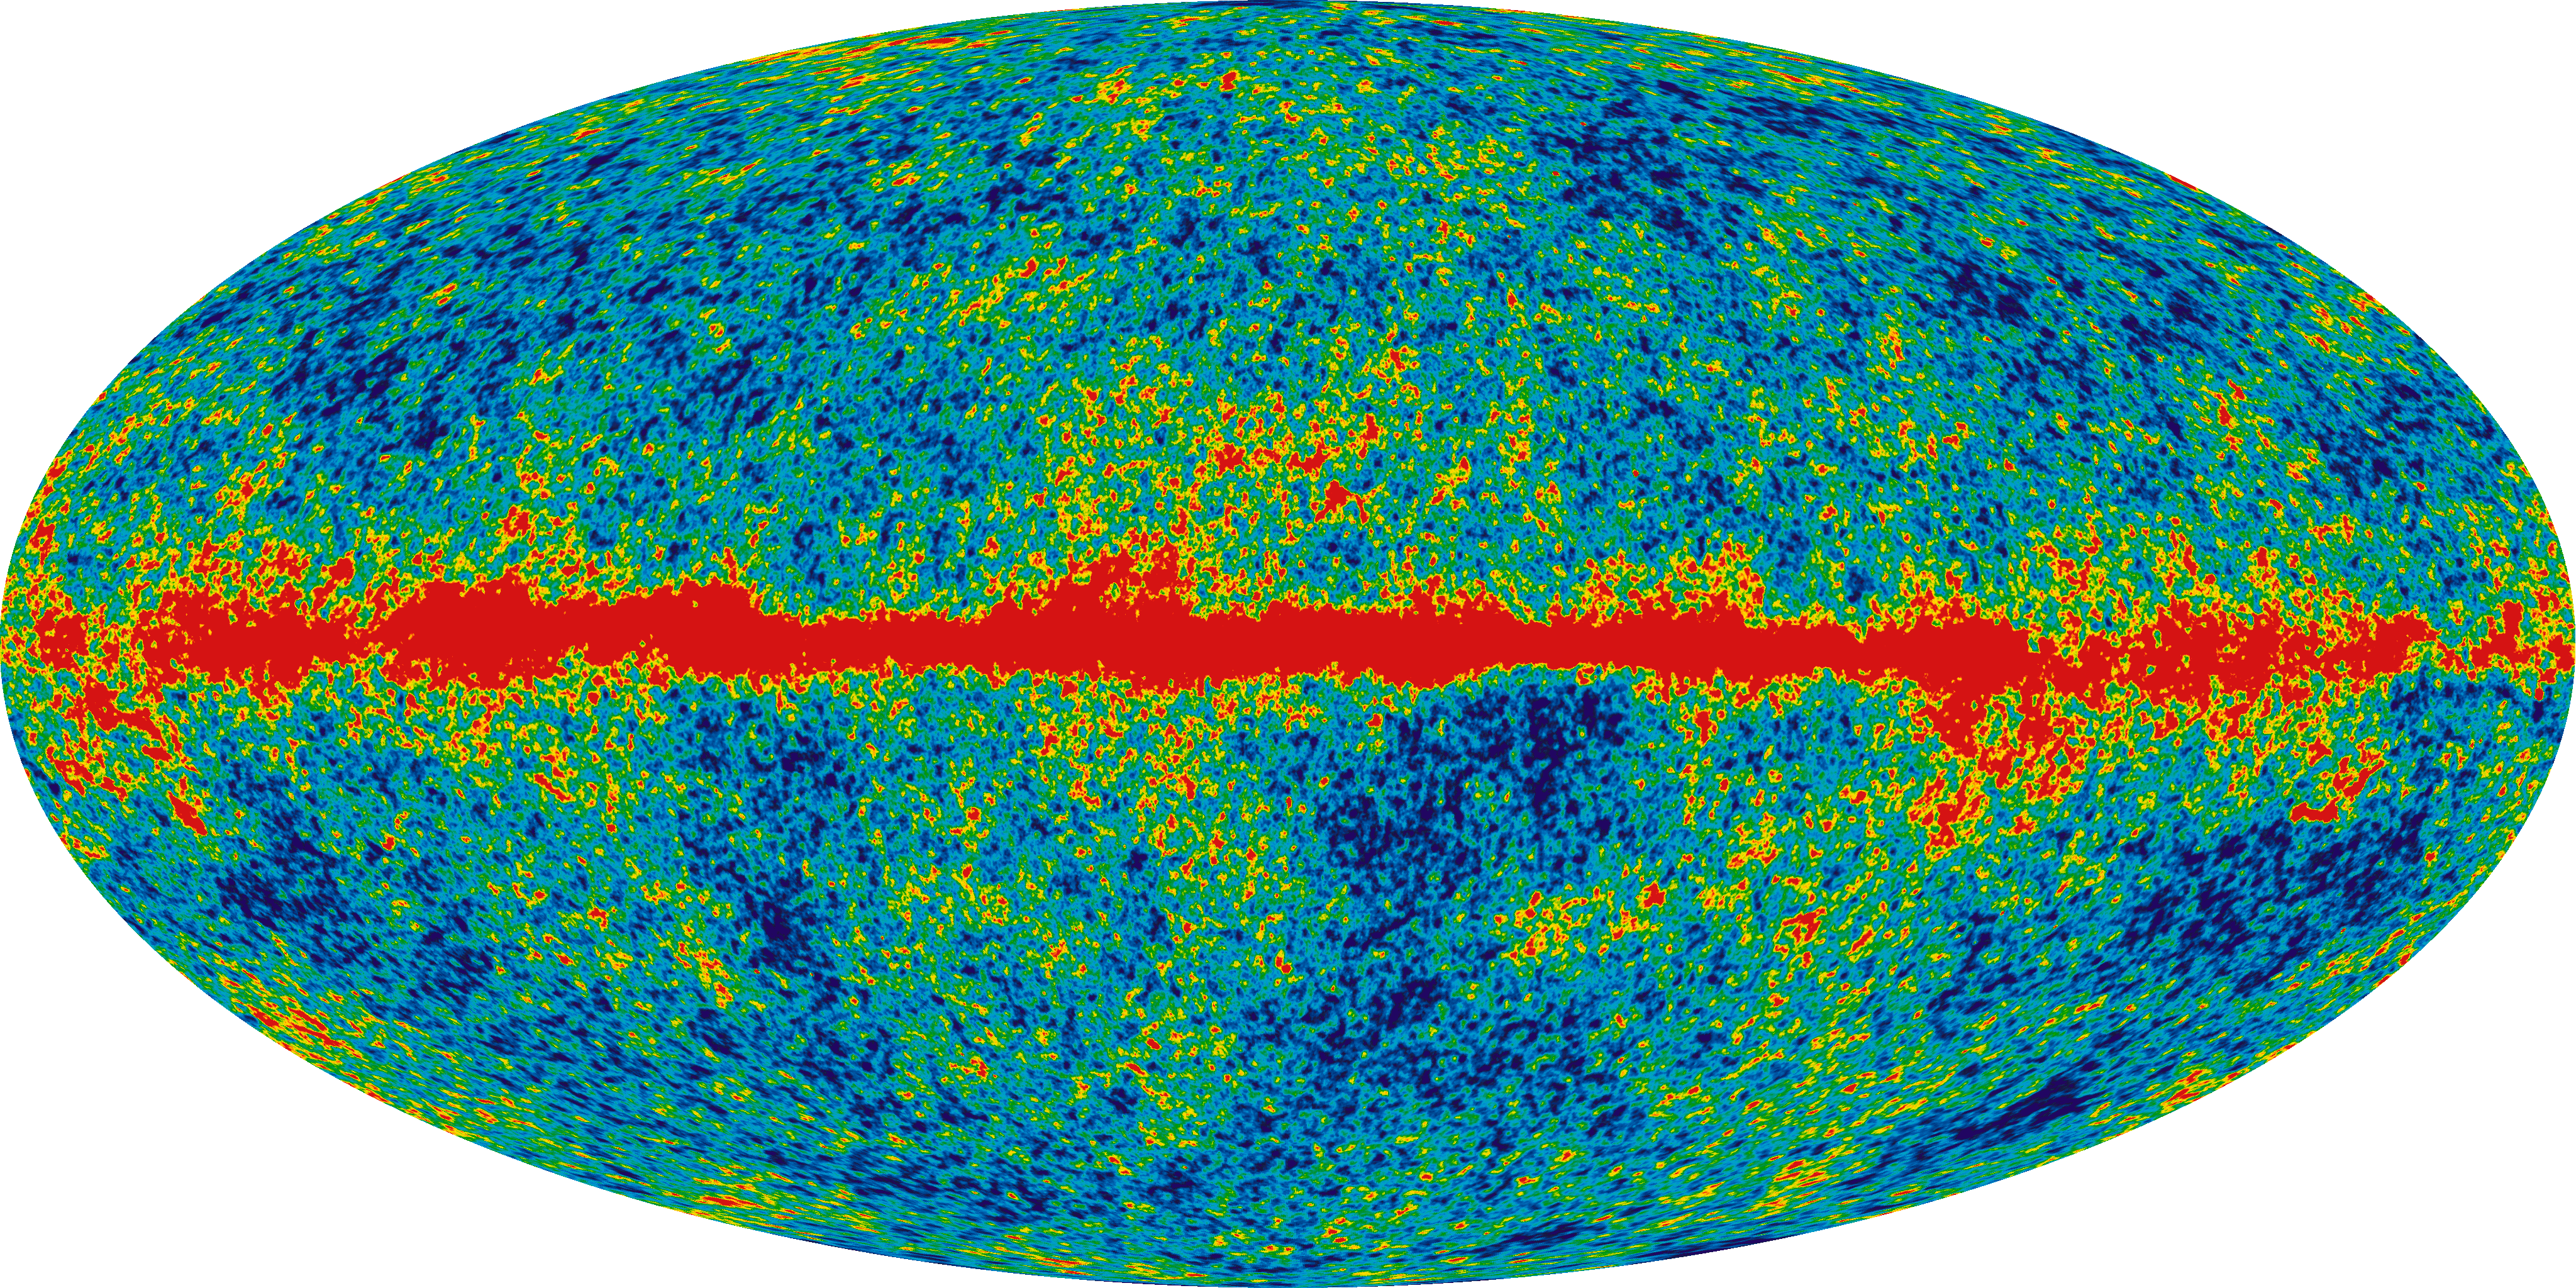
The images below represent full-sky maps of the cosmic microwave background anisotropy and foreground signal from our galaxy (in red). The 5 frequency maps are constructed from the differential time-ordered observations of the ten WMAP differencing assemblies. Galactic foreground is stongest in K band, weakest in V and W bands.
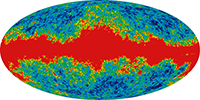
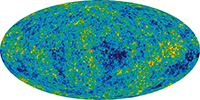
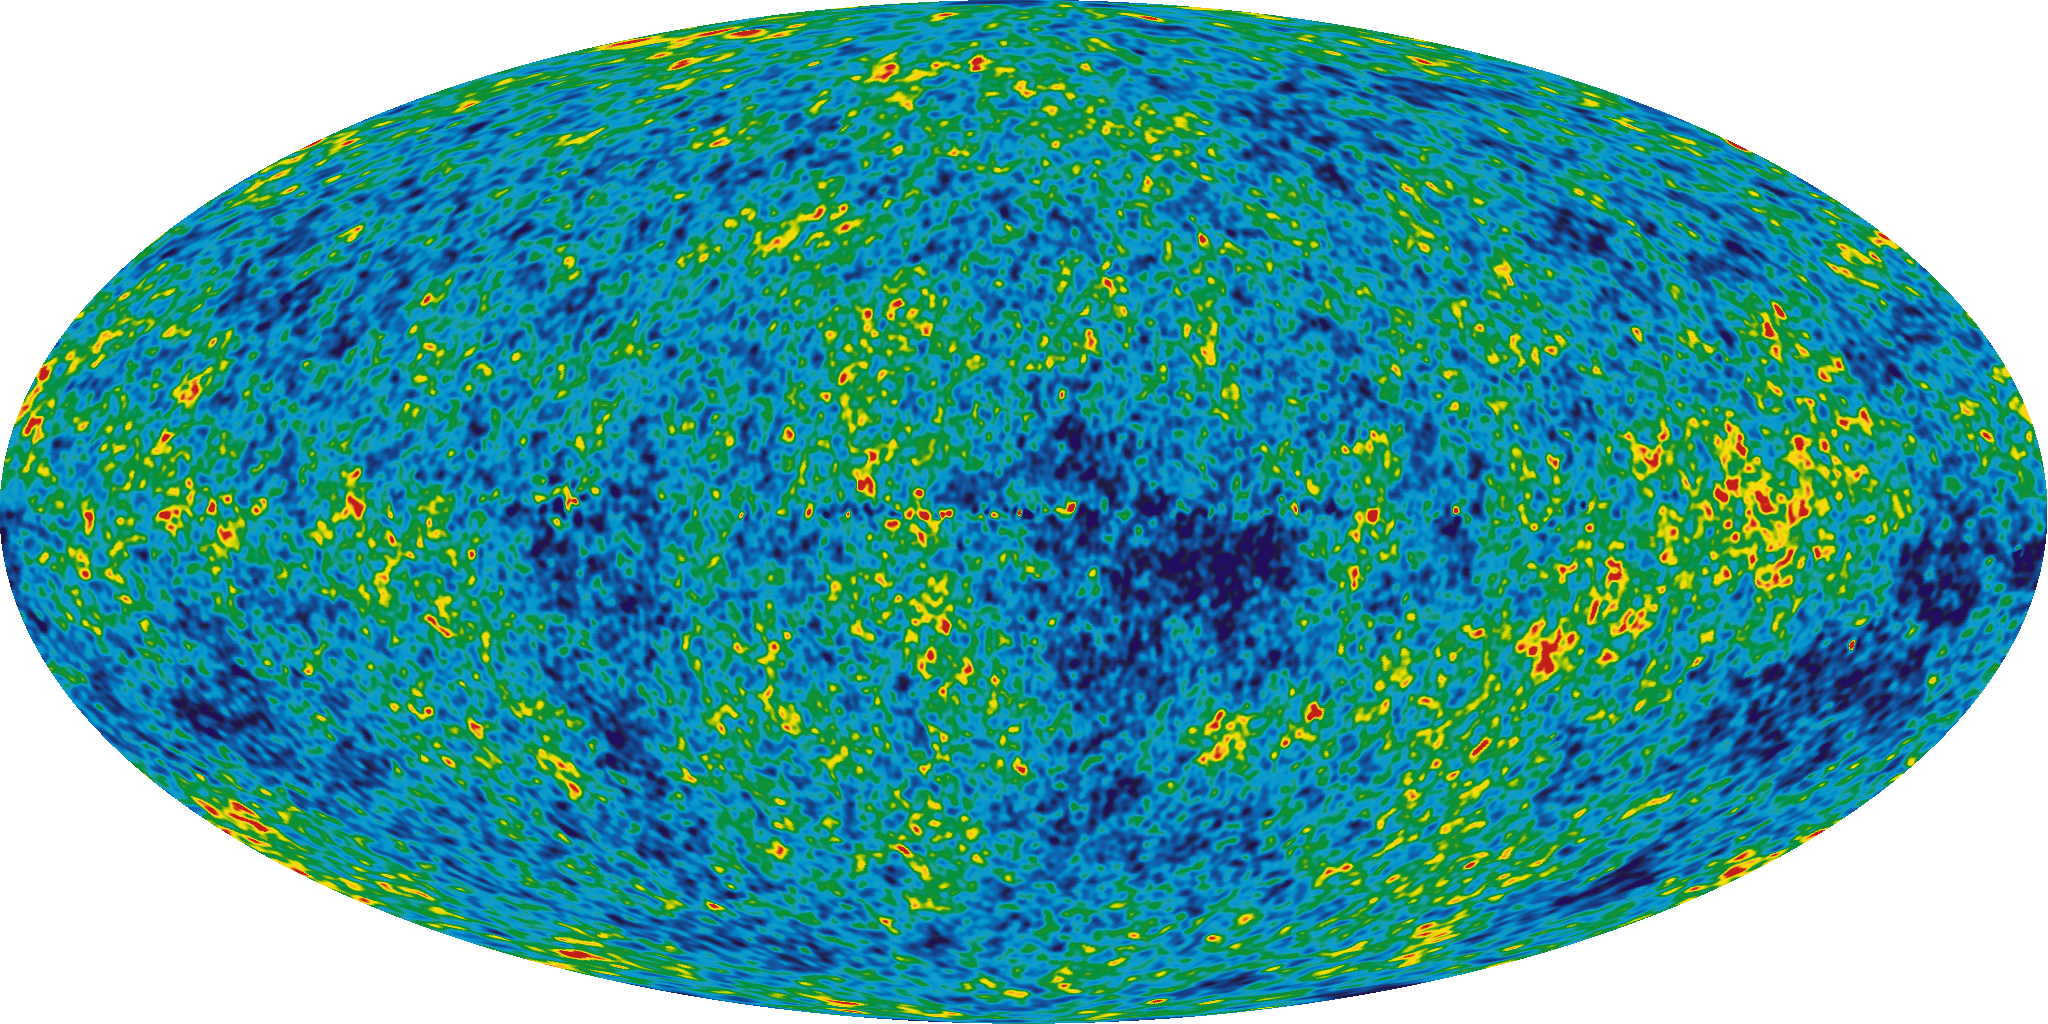
The Internal Linear Combination Map is a weighted linear combination of the five WMAP frequency maps. The weights are computed using criteria which minimize the Galactic foreground contribution to the sky signal. The resultant map provides a low-contamination image of the CMB anisotropy.
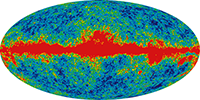
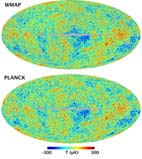
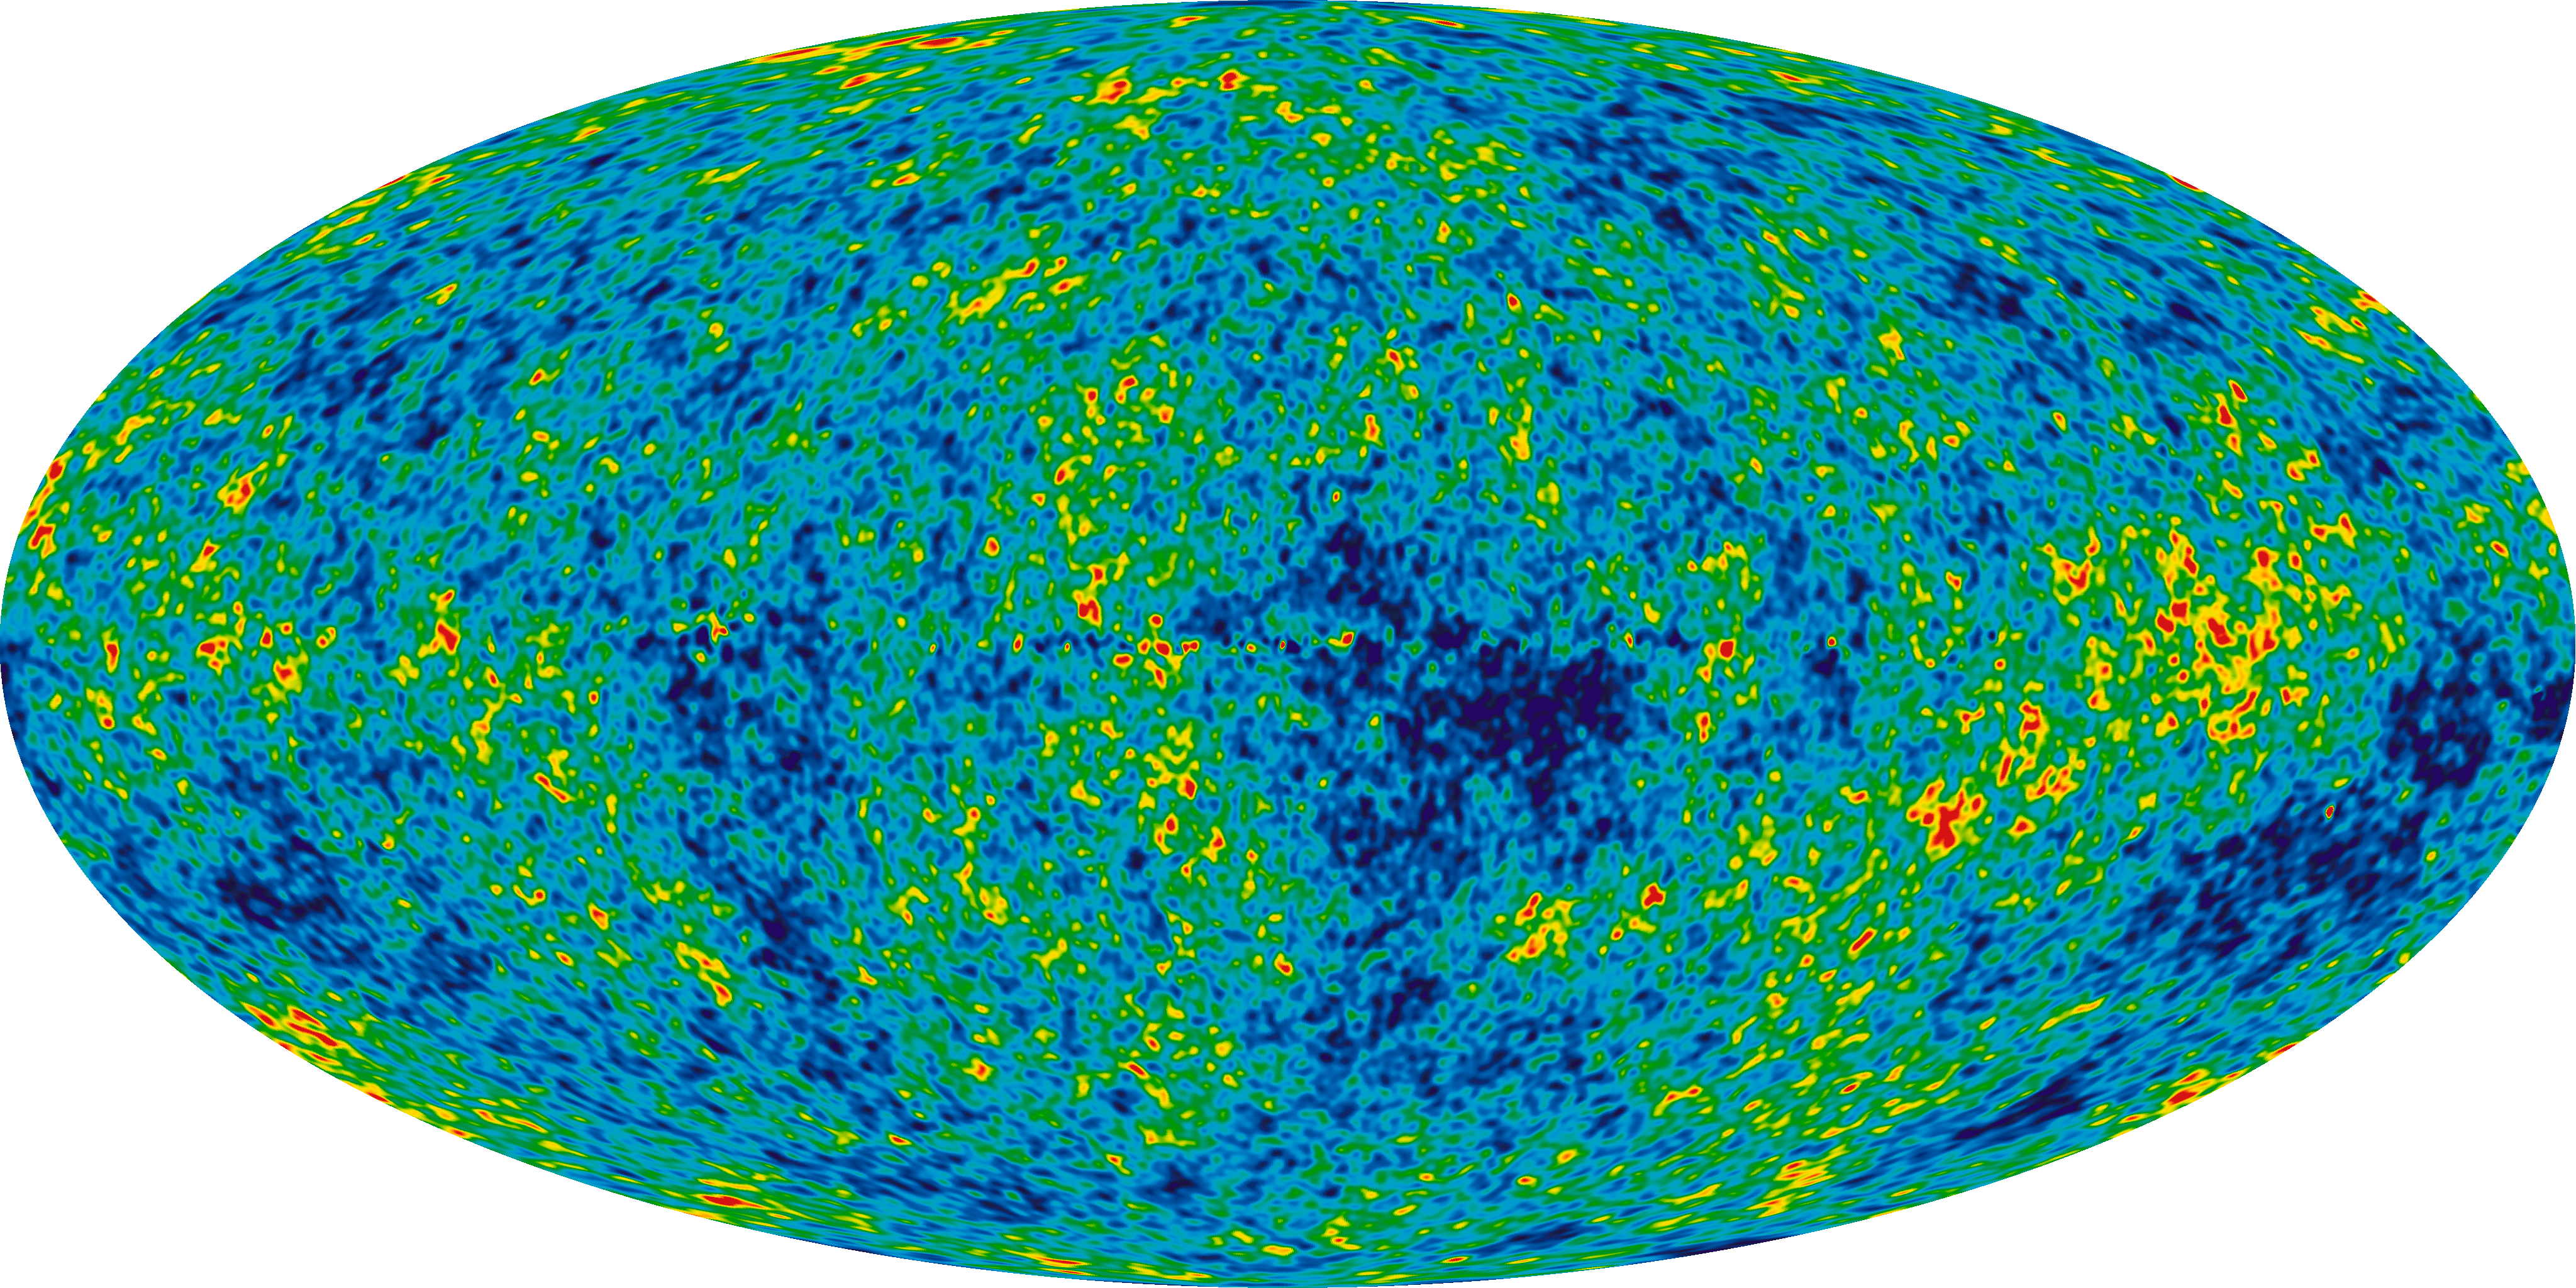
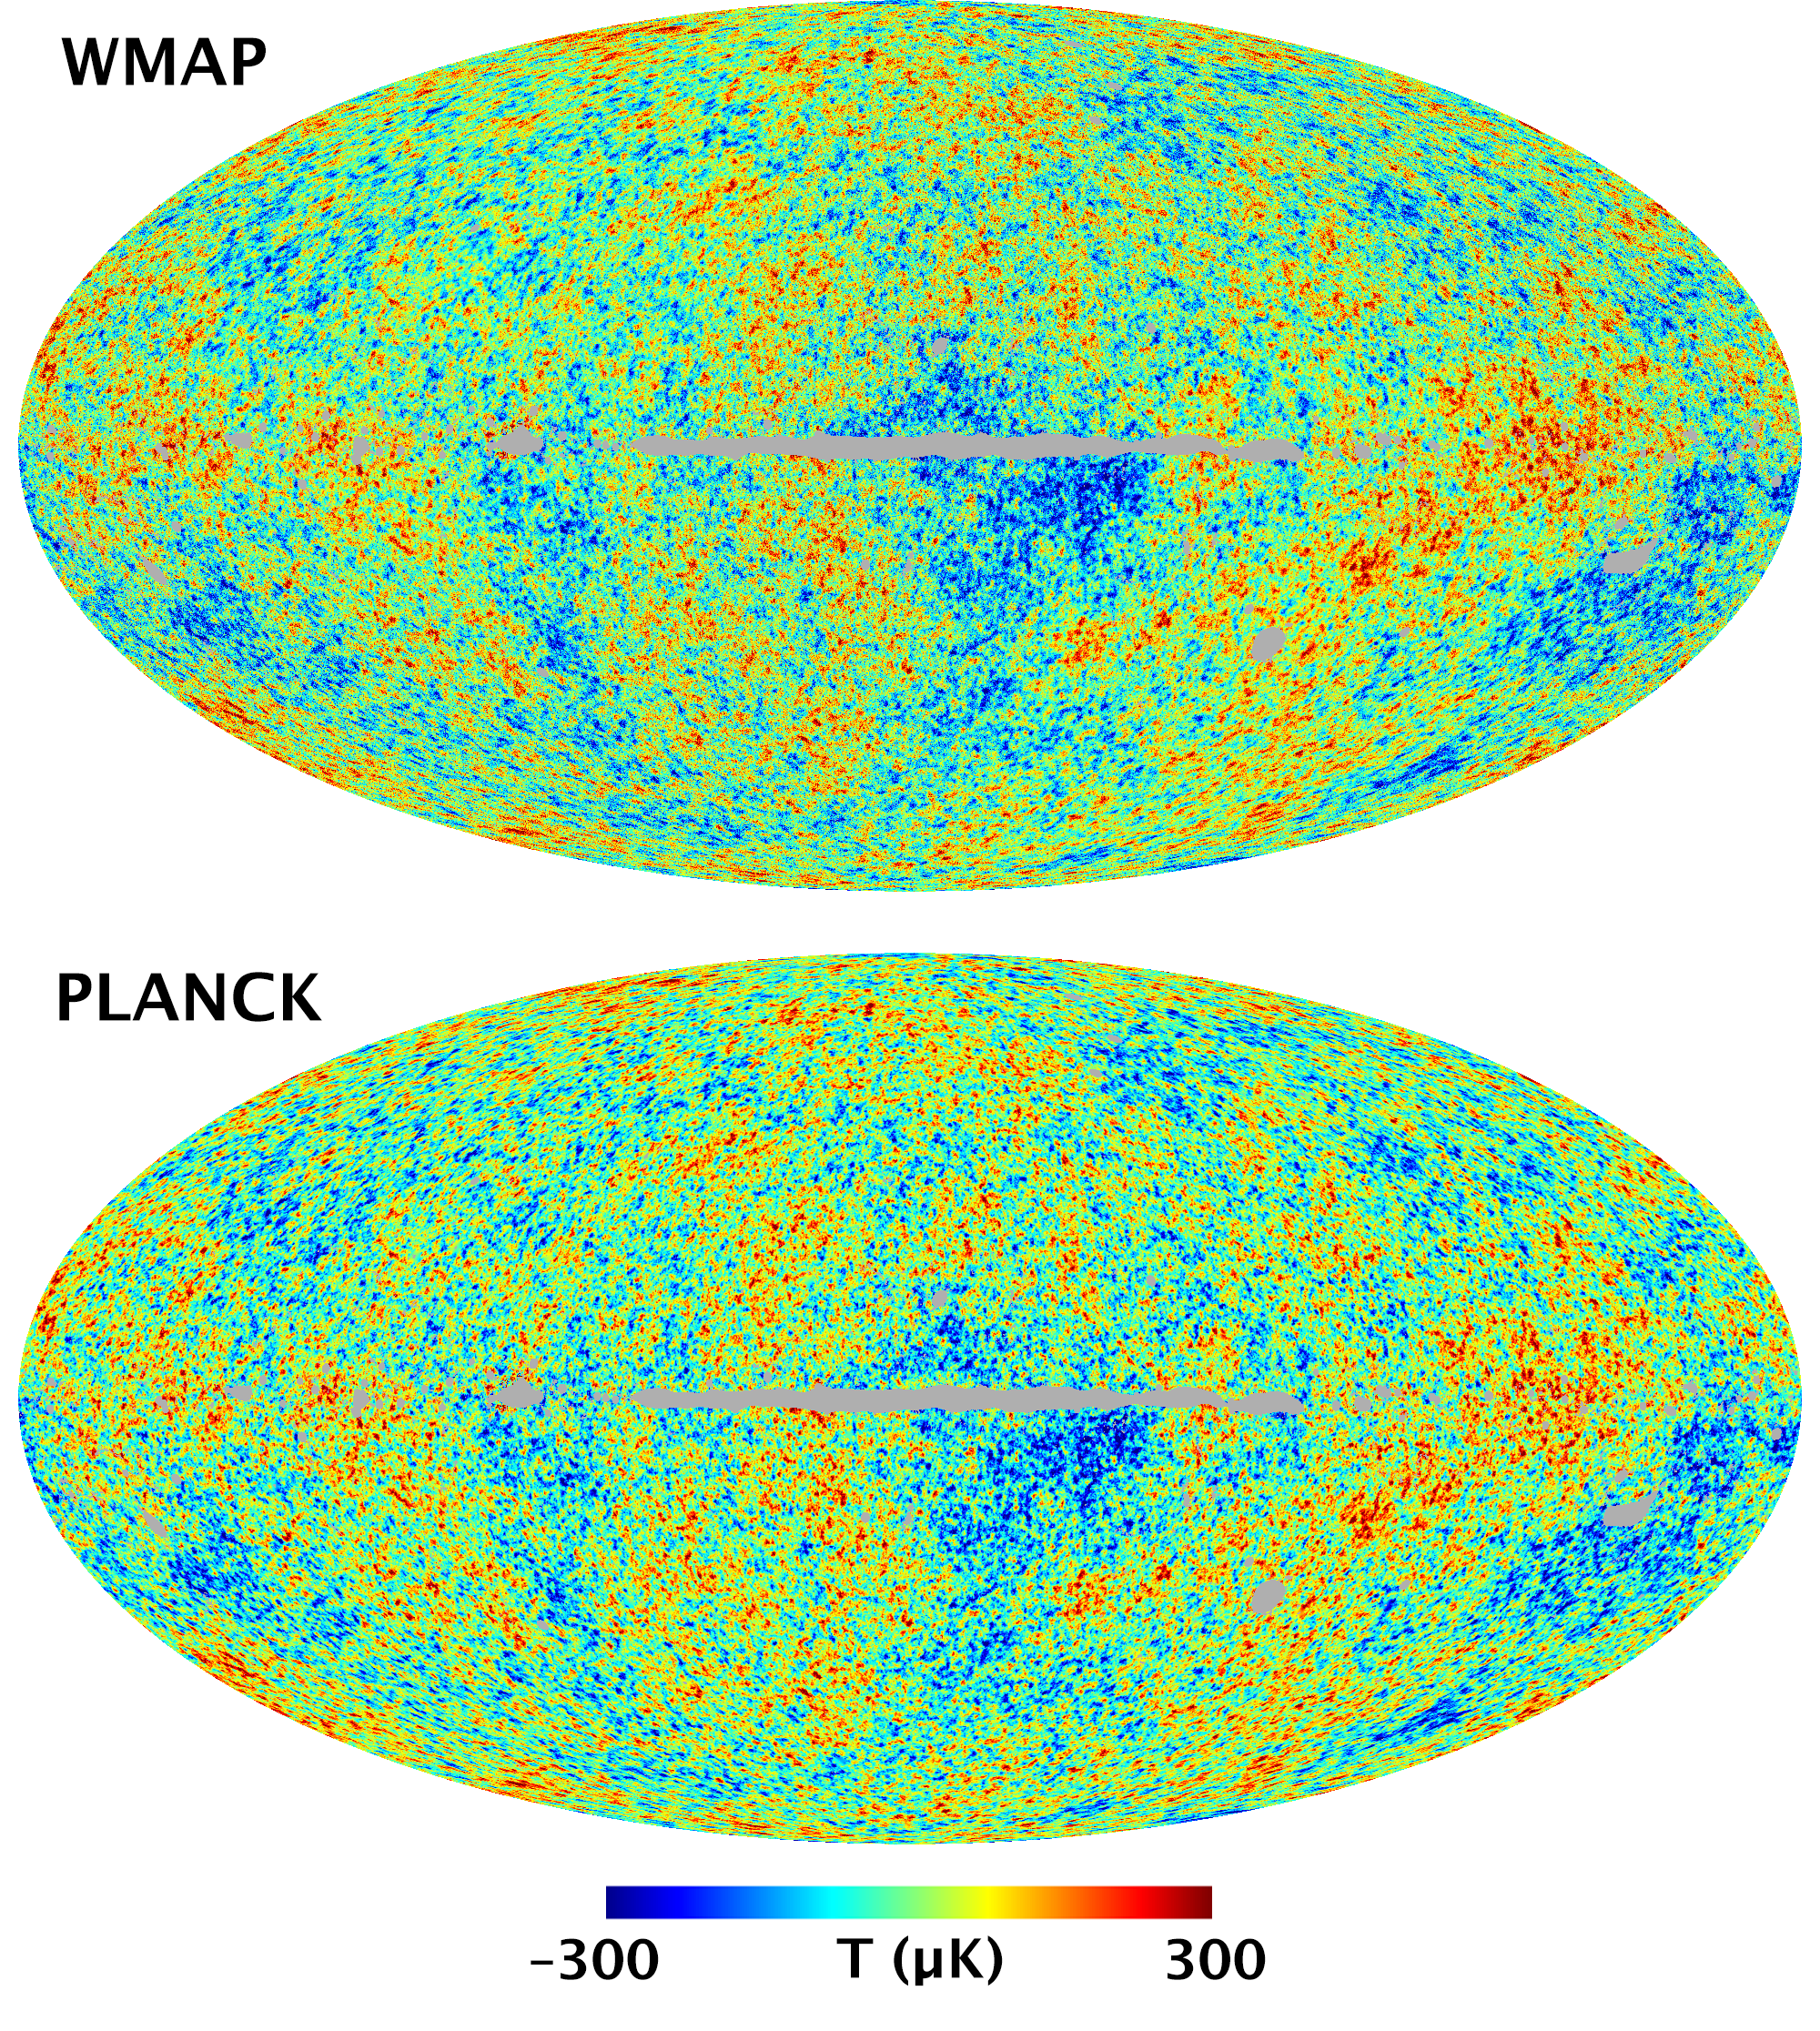
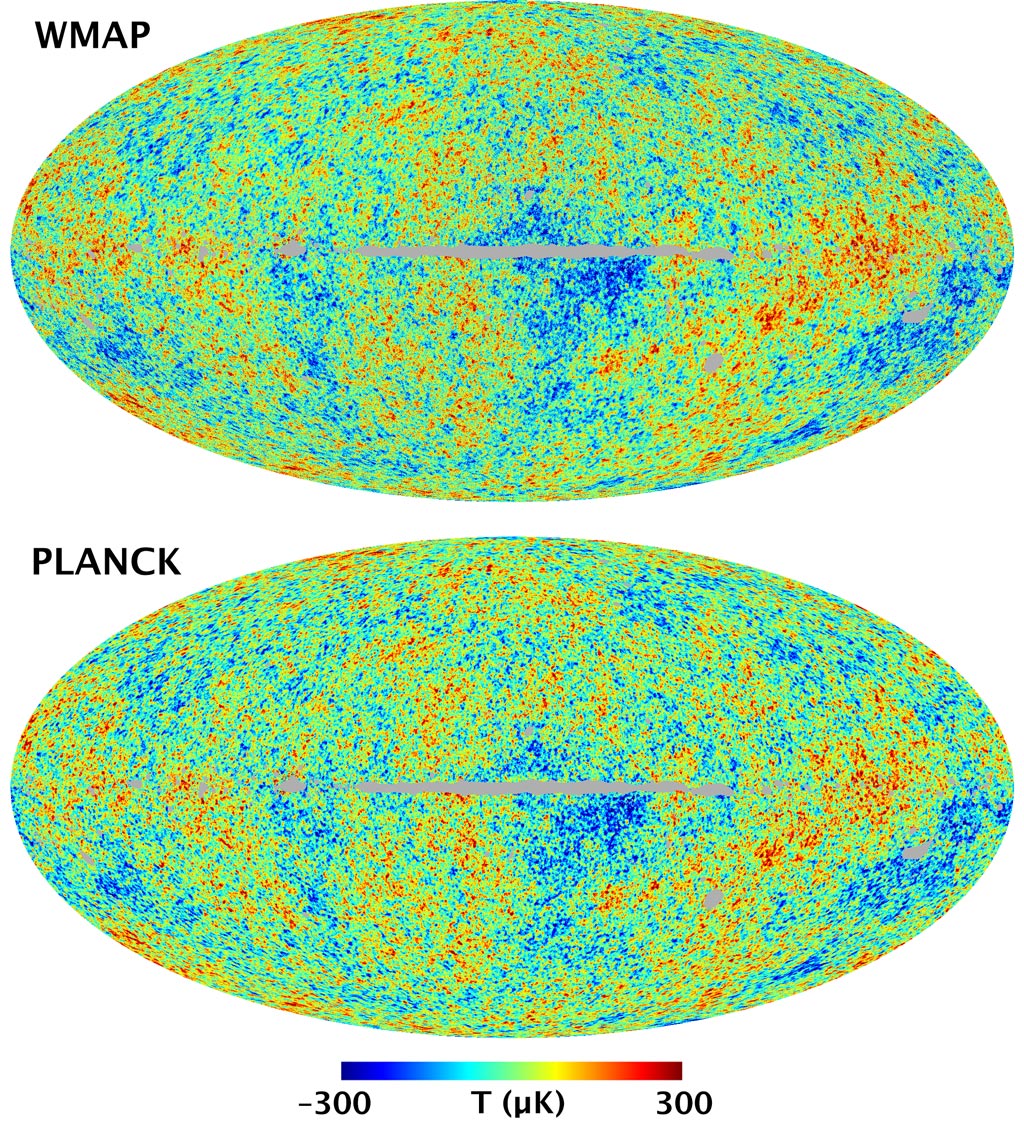
The top image is the WMAP 9 year W-band CMB map and the bottom image is the Planck SMICA CMB map. Both maps are foreground-cleaned, WMAP by subtracting a linear least squares fit to the Planck dust and low-frequency templates.


