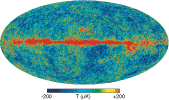
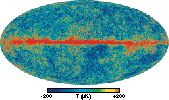
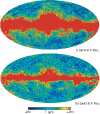
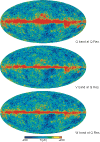
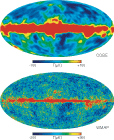
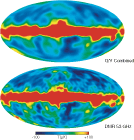
First Year Wilkinson Microwave Anisotropy Probe (WMAP) Observations: Preliminary Maps and Basic Results, C.L. Bennett, et al., 2003ApJS..148....1B, reprint / preprint (4.4 Mb) / individual figures / ADS / astro-ph
WMAP First-year Paper Figures, Bennett, et al.
Individual figures are provided for use in talks. Proper display of PNG transparency in PowerPoint requires saving files to your computer before Inserting them. Please acknowledge the WMAP Science Team when using these images.
Fig.1 An overview of the WMAP data flow. The references are: (1) Barnes et al. (2003) (2) Bennett et al. (2003b)(3) Bennett et al. (2003c) (4) Hinshaw et al. (2003b) (5) Hinshaw et al. (2003a) (6) Jarosik et al. (2003b) (7) Kogut et al. (2003) (8) Komatsu et al. (2003) (9) Page et al. (2003a) (10) Page et al. (2003b) (11) Peiris et al. (2003) (12) Verde et al. (2003).
Fig. 3 The number of independent observations per pixel in Galactic coordinates. The number of observations is greatest at the ecliptic poles and in rings around the ecliptic poles with diameters corresponding to the separation angle of the two optical boresight directions (approximately 141°). The observations are the most sparse in the ecliptic plane. Small area cuts are apparent where Mars, Saturn, Jupiter, Uranus, and Neptune data are masked so as not to contaminate CMB analyses. Jupiter data are used for beam mapping. The histogram of the sky sampling shows the departures from uniform sky coverage.
Fig. 4 A guide to the microwave sky for reference. This picture shows the large-scale emission from the Milky Way galaxy, including some of its notable components such as the Cygnus complex, the North Polar Spur, the Gum region, etc. The small circles show positions of the microwave point sources detected by WMAP (Bennett et al. 2003c). The brighter sources are labeled for reference.
Fig. 5 A comparison of the K-band map with the Ka-band map smoothed to K-band resolution, both in thermodynamic temperature, shows the dramatic reduction of Galactic contamination with increased frequency. The comparison also shows the similarity of the CMB fluctuation features at high Galactic latitude.
Fig. 6 A comparison of the Q-band, V-band, and W-band maps. All three maps are smoothed to Q-band resolution and are in thermodynamic temperature. The reduction of Galactic contamination relative to K-band and Ka-band (Figure 5) is apparent. The maps show that the constant features across bands are CMB anisotropy while the thermodynamic temperature of the foregrounds depends on the band (frequency).
Fig. 7 A comparison of the COBE 53 GHz map (Bennett et al. 1996) with the W-band WMAP map. The WMAP map has 30 times finer resolution than the COBE map.
Fig. 8 The COBE-DMR 53 GHz map (Bennett et al. 1996) is shown along with a map made with a linear combination of the Q-band and V-band WMAP maps to mimic a 53 GHz map. Note the strong similarity of the maps.
Fig. 9 The difference map is shown between the COBE-DMR 53 GHz map and the combination Q-band/V-band maps from Figure 8. This is compared with a map of the noise level. The maps are consistent with one another with the exception of a feature in the galatic plane. This discrepancy is likely to be due to a spectral index that is sufficiently different from the assumed CMB spectrum used to combine the WMAP Q-band and V-band maps to mimic a 53 GHz map.
Fig. 10 False color images represent the spectral information from mutliple WMAP bands. Q-band is red, V-band is green, and W-band is blue. A CMB thermodynamic spectrum is grey. (top) A three color combination image from the Q-, V-, and W-band maps. The dipole and high Galactic latitude anisotropy are seen. (bottom) A similar false color image but with the dipole subtracted.
Fig. 11 This internal linear combination map combines the five band maps in such as way as to maintain unity response to the CMB while minimizing foreground contamination. For a more detailed description see Bennett et al. (2003c). For the region that covers the full sky outside of the inner Galactic plane, the weights are 0.109, -0.684, -0.096, 1.921, -0.250 for K, Ka, Q, V, and Wbands, respectively. Note that there is a chance alignment of a particularly warm feature and a cool feature near the Galactic plane. As discussed in Bennett et al. (2003c), the noise properties of this map are complex, so it should not generally be used for cosmological analyses.
Fig. 12 The WMAP angular power spectrum. (top:) The WMAP temperature (TT) results are consistent with the ACBAR and CBI measurements, as shown. The TT angular power spectrum is now highly constrained. Our best fit running index ΛCDM model is shown. The grey band represents the cosmic variance expected for that model. The quadrupole has a surprisingly low amplitude. Also, there are excursions from a smooth spectrum (e.g., at l ≈ 40 and l ≈ 210) that are only slightly larger than expected statistically. While intriguing, they may result from a combination of cosmic variance, subdominant astrophysical processes, and small effects from approximations made for this first year data analysis (Hinshaw et al. 2003b). We do not attach cosmological significance to them at present. More integration time and more detailed analyses are needed. (bottom:) The temperature-polarization (TE) cross-power spectrum, (l + 1)Cl/2π. (Note that this is not multiplied by the additional factor of l.) The peak in the TE spectrum near l ~ 300 is out of phase with the TT power spectrum, as predicted for adiabatic initial conditions. The antipeak in the TE spectrum near l ~ 150 is evidence for superhorizon modes at decoupling, as predicted by inflationary models.
Fig. 13 (top): CMB temperature correlation function of the WMAP and COBE data. The WMAP correlation function is computed using a combination of the Q-band, V-band, and W-band maps with the Kp0 cut sky and the MEM Galactic model subtracted. The COBE correlation function is computed using the custom cut sky. The running index ΛCDM model that is fit to the power spectrum is shown with a Monte Carlo determined grey band indicating one standard deviation. The model is, overall, an excellent fit to the WMAP power spectrum. However, a correlation plot emphasizes the low l power. The discrepancy between the model and data illustrates that there is surprisingly little anisotropy power in the WMAP and COBE maps at large angles. (bottom): The lower two plots display the correlation function of the difference between the COBE-DMR and WMAP maps with a |b| = 10° Galactic plane cut. A synthesis of the WMAP Q and V band maps was made to approximate a 53 GHz-like map to compare with the COBE-DMR 53 GHz map. The COBE-DMR 90 GHz map is compared directly, without corrections, to the WMAP W-band map. These plots emphasize the consistency of the WMAP and COBE measurements. The slightly higher than expected deviations at 53 GHz are likely to be due to Galactic contamination, arising from outside the cut regions and from the construction of the synthesized WMAP 53 GHz map.