The Very Small Array | ASTROPHYSICS |
|
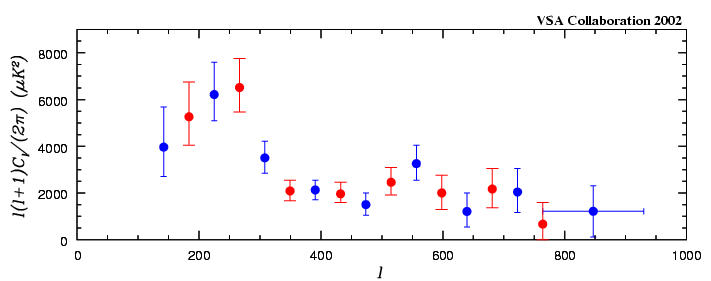
The power spectrum of the CMB as measured by the VSA. The two colours of points are two independent binnings of the data, both with delta l = 83. There is an additional correlated error of +/- 7% due to calibration.
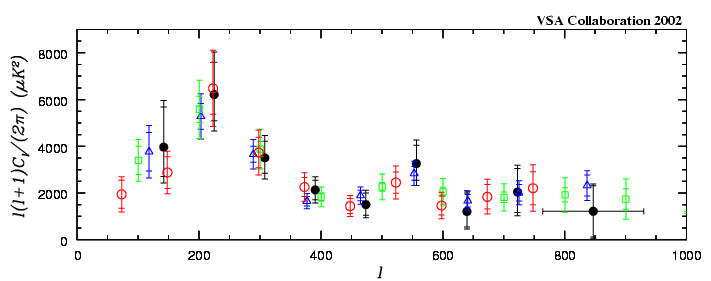 |
Comparison of VSA with other recent CMB power spectrum results: VSA (black filled circles); DASI (blue triangles); MAXIMA (green squares); BOOMERANG (red open circles). Only single-binned data are shown. In each case, the inner error bars show the random errors, while the outer error bars show the range of correlated errors due to calibration and beam uncertainty. ie the points with their inner error bars can move coherently within the outer error bars.
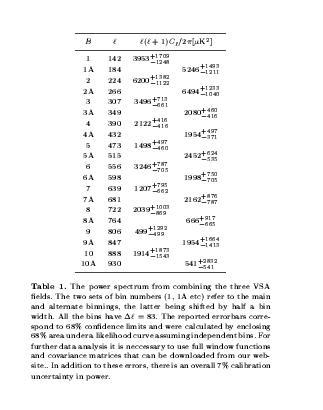 |
Table of band powers of the VSA power spectrum, in two independent binnings. In the plots above, bins 9 and 10 are averaged together and bin 10A is omitted. Numerical data are downloadable from here.
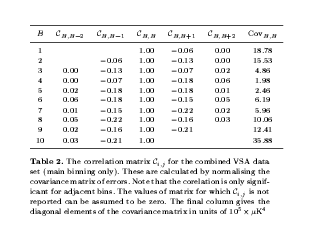 |
Correlation matrix for the main binning of the power spectrum (points 1 - 10 in Table 1), along with the diagonal elements of the covariance matrix. Numerical data are downloadable from here.
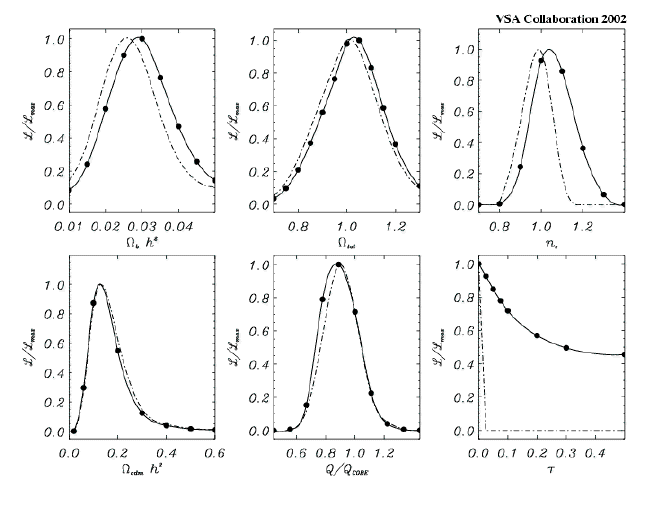 |
Marginalised distributions for the cosmological parameters as determined from the VSA experiment, together with a normalisation constraint at low-l from COBE-DMR. The solid lines include the effect of a weak top-hat prior on h (0.4 < h < 0.9), and the dot-dashed lines correspond to the additional prior tau=0. The lines are constructed using a cubic spline interpolation through the grid points, which are shown as solid circles.
[ VSA Home | Introduction to the VSA | Status of the project | Public data | Photos ]
![]() Last Modified 15 Jan 2003
Last Modified 15 Jan 2003
Webpage Administrator.