The Very Small Array |
ASTROPHYSICS |

|
The power spectrum of the CMB as measured by the VSA. The two colours
of points correspond to alternative interleaved binnings of the data. The
error bars represent 1 sigma errors.
 |
A comparison of VSA data (black filled circles) with results from the
BOOMERANG (pink open squares), MAXIMA (blue open circles), DASI (green
open triangles) and CBI (red stars) experiments.
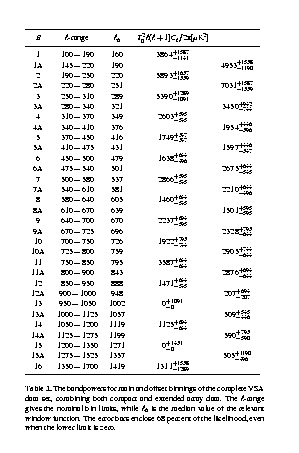 |
Table of band powers of the VSA power spectrum for both binnings. Numerical
data are downloadable from here.
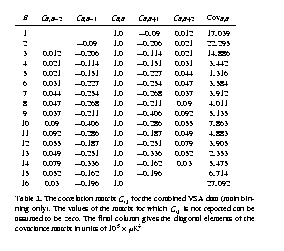 |
The correlation matrix for the main binning of the combined VSA data.
Numerical data are downloadable from here.
[ VSA Home | Introduction to the VSA | Status of the project | Public data | Photos ]
![]() Last Modified 22 May 2002
Last Modified 22 May 2002
Webpage Administrator.