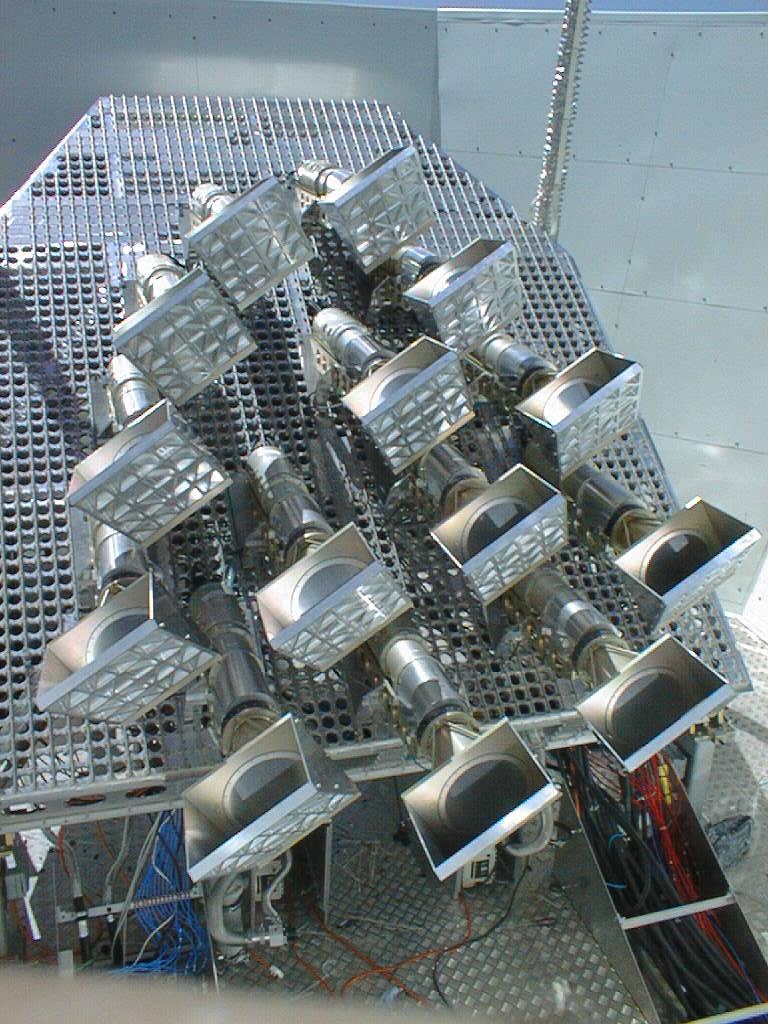
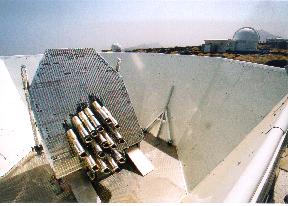
 The VSA in its current extended configuration
 The Very Small Array | ASTROPHYSICS |
The VSA in its current extended configuration
 |
 |
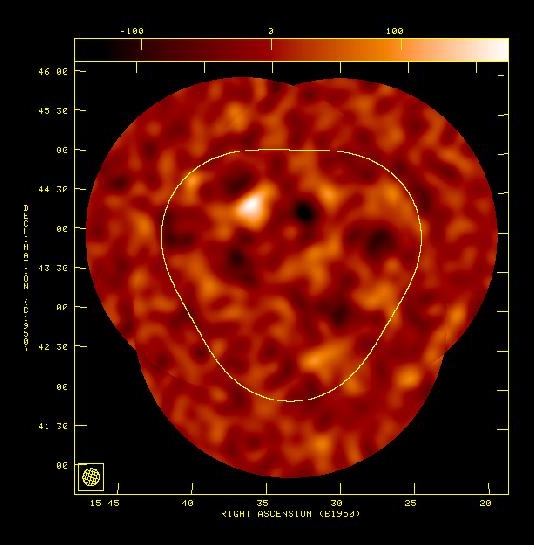 |
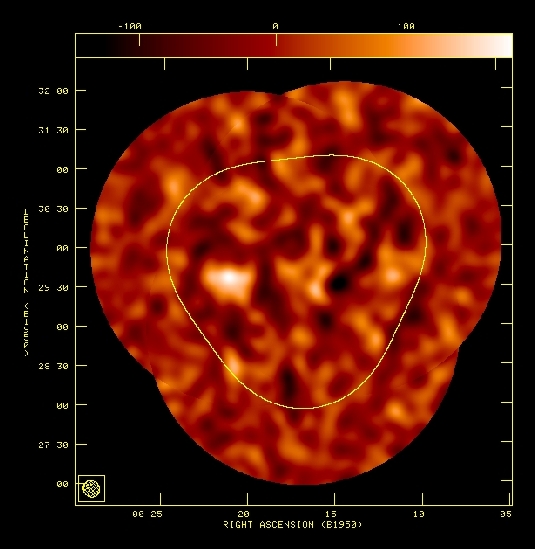
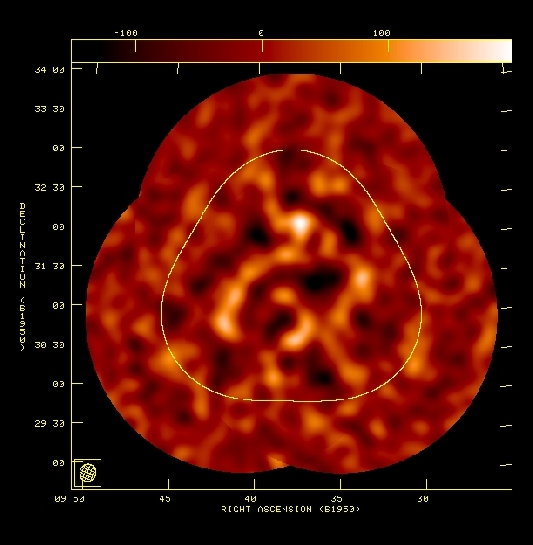
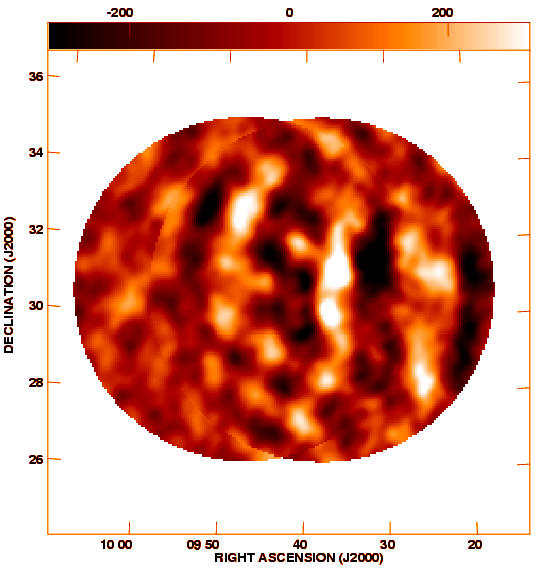
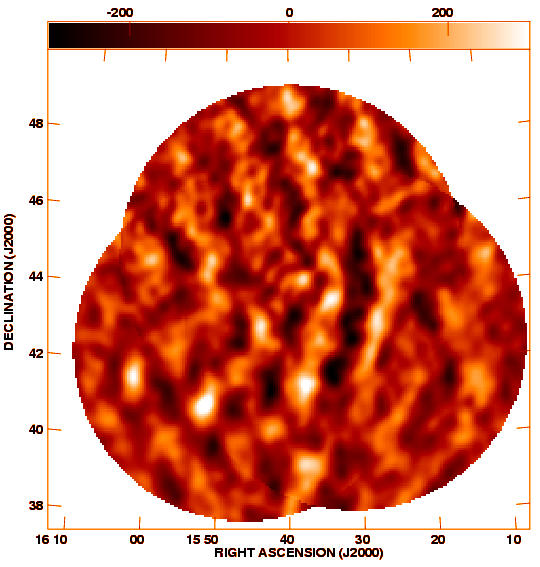
| Final maps from the VSA extended array observations. The shapes are due to the 3 overlapping circular fields of observation in each case. |
||
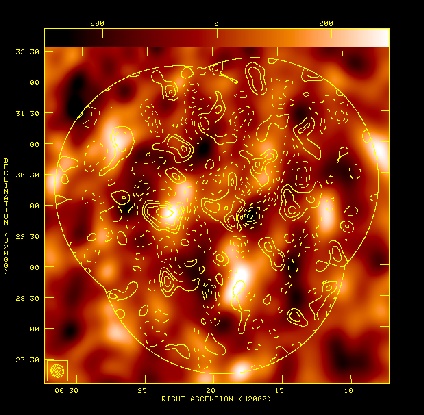
Comparison between compact array map (colourscale) and extended array map (contours) for VSA1.
|
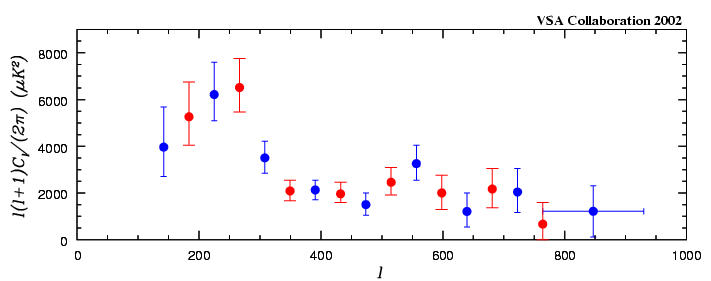
The power spectrum of the CMB as measured by the VSA. The two colours of points are two different ways of binning the data. The horizontal axis represents inverse angular scale: l=360 is one degree, l=720 is half a degree, and so on. The vertical axis represents the power in CMB fluctuations on that scale. Notice the extensed l range with the inclusion of the new data from the extended array (compare with the compact array power spectrum below)
 The VSA in its previous compact configuration (until September 2001)
 |
 |
 |
| Final maps from the VSA compact array observations. The shapes are due to the number of overlapping circular fields of observation (either 2 or 3) in each case. |
||
|
The power spectrum of the CMB as measured by the VSA compact array.
 Last Modified 20 December 2002
Webpage Administrator.