In this chapter I will analyse observational data taken through two
different filters, the I-band filter from the HiRac instrument at the
NOT, and a 
 long pass filter (called HiRac I and
edge respectively). The bandpass of the HiRac I
filter is approximately top-hat shaped with a centre wavelength of
long pass filter (called HiRac I and
edge respectively). The bandpass of the HiRac I
filter is approximately top-hat shaped with a centre wavelength of
 and a width of
  . The long wavelength limit was
set by the sensitivity curve of the front-illuminated CCD for
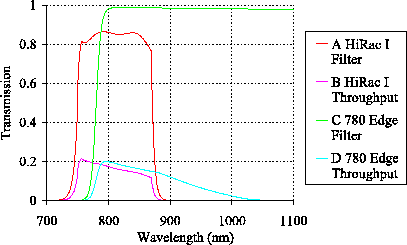
observations using the edge filter. Figure 5.5
shows simple models for the responses of the filters (based on the
data available from the manufacturers). Also shown are estimates of
the combined photon-detection efficiency of the telescope, filter and
instrument based on estimates of the quantum efficiency of the
front-illuminated CCD, the reflection coefficients for the dewar
window and lens, and the reflectivity of the telescope and instrument
mirrors.
. The long wavelength limit was
set by the sensitivity curve of the front-illuminated CCD for
observations using the edge filter. Figure 5.5
shows simple models for the responses of the filters (based on the
data available from the manufacturers). Also shown are estimates of
the combined photon-detection efficiency of the telescope, filter and
instrument based on estimates of the quantum efficiency of the
front-illuminated CCD, the reflection coefficients for the dewar
window and lens, and the reflectivity of the telescope and instrument
mirrors.
Figure 5.5:
Bandpasses for two filters used at the NOT. All the
observational results presented in this chapter were taken through one
of these two filters. Curve A shows the approximate response
for the HiRac I filter, and curve C shows the estimated
bandpass for the edge filter. These curves are based on
data provided by the manufacturers. Also shown are the combined
responses of these filters with the estimated quantum efficiency of
the front-illuminated CCD, the estimated mirror reflectivities and
estimates for reflection coefficients of the dewar window and
lens. These are labelled B and D for the HiRac I and
edge filters respectively.
 |
Bob Tubbs
2003-11-14