| Toco CMB Anisotropy Experiment | PrincetonCMB |
· Instrument
» Site
· Analysis
· Results
· Internal
Chilean Atmospheric Spectrum
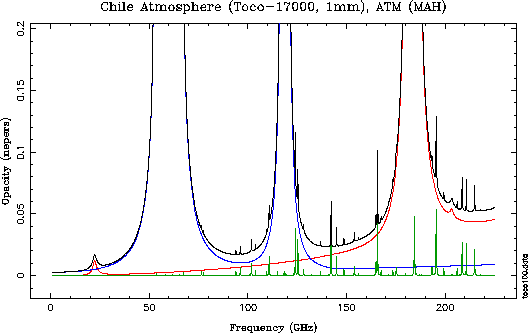
Mark Holdaway of NRAO has run the 1996 Pardo version of the ATM code (Liebe et al. 1993) for the Toco site at 17000 ft. The spectrum is plotted below with a precipitable water vapor column of 1mm. Note that this amount of water vapor is double the amount during the best 25% of the winter months.
According to this model,
tau225 = 0.00938 + pwv*0.04582for the Toco site at an altitude of 17,000 ft.

This plot shows the opacity spectrum at the Toco site, with the
various contributors shown separately. The curves are
- water vapor
- molecular Oxygen
- minor species (esp. Ozone)
- total of all the above

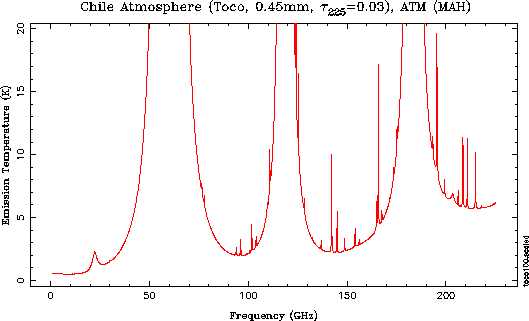
This plot shows the atmospheric emission for a water vapor
column of 0.45 mm, which corresponds to an opacity at 225 GHz of
0.03. This is the atmospheric emission expected for
the best times in the winter
(see the opacity plots)