| MAT CMB Anisotropy Experiment | PrincetonCMB |
· Team
· Site
· Instrument
· Observations
· Analysis
» Results
· Internal
The Results

|
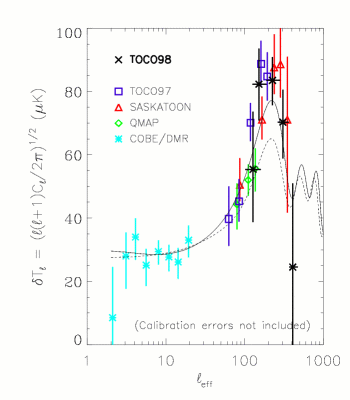
The group has released two major analyses: TOCO97, a study of the data collected during the 1997 campaign, and TOCO98, a similar study of the 1998 D-band data. The results are summarized in the plot at left and the following table. They indicate that the angular spectrum of the CMB peaks at approximately 85 uK near an l of 200. The version of the plot on the left that appeared in Science magazine containing only the TOCO97 and TOCO98 data points is also available: toco_only In addition, maps of Eta Carina in various bands are available. |
| leffective | Delta_T [uK] | Data Files* |
| TOCO97 | ||
| 63±(17,18) | 40±(10,9) | (likelihood) (knox filter) (window function) |
| 85±(16,21) | 45±(7,6) | (likelihood) (knox filter) (window function) |
| 119±(24,26) | 70±(6,6) | (likelihood) (knox filter) (window function) |
| 155±(25,25) | 89±(7,7) | (likelihood) (knox filter) (window function) |
| 194±(41,26) | 85±(8,8) | (likelihood) (knox filter) (window function) |
| TOCO98 | ||
| 128±(26,33) | 55±(18,17) | (likelihood) (knox filter) (window function) |
| 152±(26,38) | 82±(11,11) | (likelihood) (knox filter) (window function) |
| 226±(37,56) | 83±(7,8) | (likelihood) (knox filter) (window function) |
| 306±(44,59) | 70±(10,11) | (likelihood) (knox filter) (window function) |
| 409±(42,65) | 24±(28,28) | (likelihood) (knox filter) (window function) |
| * described in Analysis. The window functions are obsolete and remain only for comparison with the Knox filters. | ||
TOCO98
An analysis of the D-band data collected in 1998.
Paper:
- preprint (astro-ph/9906421): postscript, source. Submitted to ApJL 23 June 1999.
Plots:
- combined Knox filters: The window functions (black) are plotted for comparison.
- combined likelihood: The solid line is the likelihood of the data. The dashed and dotted lines are the likelihoods of the null tests.
- radiometer offsets (D1, D2): the averaged raw output of the radiometer after multiplying by a synthesis vector.
- chi^2: the reduced chi^2 of the signal and null tests, assuming Delta_T = 0.
Details of the analysis can be found here.
TOCO97
An analysis of the data from the 1997 campaign, consisting of nearly 1200 hours of data.
Paper:
- Torbet, E., Devlin, M. J., Dorwart, W. B., Herbig, T., Miller, A. D., Nolta, M. R., Page, L., Puchalla, J., Tran, H. T. 1999, ApJ, 521, L79 (pdf, postscript, preprint)
Plots:
- combined Knox filters: The window functions (black) are plotted for comparison.
- combined likelihood: The solid line is the likelihood of the data. The dashed and dotted lines are the likelihoods of the null tests.
- frequency spectral index: likelihood contours for beta. The results are consistent with that of the CMB.
- radiometer offsets (Ka1, Ka2, Q1, Q3, Q4): the averaged raw output of the radiometer after multiplying by a sythesis vector. Segments deleted due to excessive variation are shaded.
- chi^2: the reduced chi^2 of the signal and null tests, assuming Delta_T = 0.
Details of the analysis can be found here.
Maps
Jason Puchalla has made maps of Eta Carina for various bands: Ka2, Q1, Q4, D1.
These are preliminary and include only a fraction of the data. Eta Carina is up during the day when the atmospheric contamination is maximum.