|
The Sunyaev-Zeldovich Array (SZA) will make use of the Sunyaev-Zeldovich effect (SZE) to search for clusters of galaxies. The SZE is intimately tied to the cosmic microwave background, the relic radiation that pervades the universe. All the objects in the universe radiate far more energy compared to this background, which is why it is easy to observe them. These objects also interact with the photons (packets of light energy) of the background radiation. This interaction is most evident in the case of clusters of galaxies because they are so massive.
The gas between galaxies in a cluster contains extremely energetic electrons. When photons from the cosmic microwave background radiation encounter these electrons, they can gain energy from the electrons. The process of increasing the energy of radiation is called the inverse-Compton effect and is illustrated schematically in figure 1 to the right. The blue-shifted photon has gained energy by interacting with an electron and hence has increased in frequency. In practice, only about 1 in everyone 100 background photons undergoes inverse-Compton scattering as it passes through cluster gas.

Figure 1: Schematic of the Sunyaev-Zeldovich effect that results in an increase in higher energy (or blue shifted) photons of the cosmic background when seen through the hot gas present in cluster of galaxies. (Adapted from L. Van Speybroeck)
When one measures the cosmic background radiation in the direction of a cluster of galaxies, the inverse-Compton effect alters the intensity of the radiation: there are fewer low energy photons and more higher energy photons than one would expect in the cosmic background radiation when one observes around 218 GHz. Astronomers call this distortion of the cosmic background the SZE. It is illustrated in figure 2 below, albeit exaggerated compared to what is actually observed. In essence, the Sunyaev-Zel'dovich Effect (SZE) is a signature left in the cosmic microwave background (CMB) by collapsed structures containing baryons. By using this technique to search for clusters of galaxies, the SZA can be certain to find all massive collapsed structures in the region of the sky that it observes.
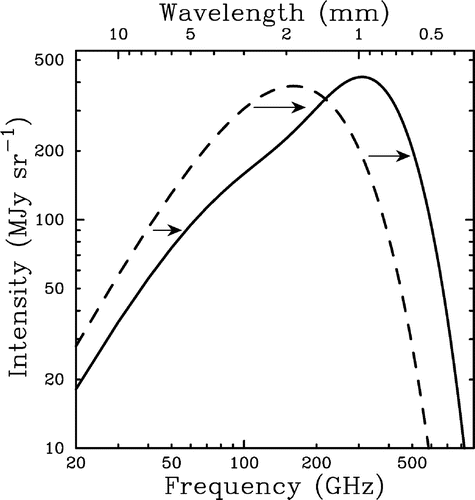
The red curve in the plot in figure 3 below shows the difference between the intensity of the expected background and that seen in the direction of a cluster. The dip in the red curve on the left side is due to a deficit of lower energy photons, while the bump is an increase of higher energy photons. Note that the SZ effect is small enough to be a challenge to observe.
|

|
| Figure 2: The dashed line represents the intensity of the cosmic microwave background with radio frequency. The solid line is the distortiong in the cosmic background intensity due to inverse-Compton scattering of photons through the gas presents in a cluster of galaxies. This is a schematic representation: the actual distortion is much smaller. (Credit: Carlstrom et al., Annual Reviews of Astronomy & Astrophysics vol 40, pg 643, 2002) | Figure 3: The red curve is the difference between the intensity of the cosmic microwave background and the signal through the cluster of galaxies Abell 2163. One can note that there is a decrease in the number of photons to the left of around 220 GHz, while there is an increase on the right hand side. The inset is a blow up of the left most point. (Credit: Carlstrom et al., Annual Reviews of Astronomy & Astrophysics vol 40, pg 643, 2002) |
| |
|
|
Summary of Important Features of the SZ effect
- The Sunyaev-Zeldovich effect has a unique spectral signature such
that it shows a decrease in the cosmic microwave background intensity
at frequencies lower than around 218 GHz, and an increase in the
intensity at higher frequencies. This is illustrated in Figure 3
above.
- It is a small spectral distortion of the cosmic microwave
background of the order of one-thousandth of a Kelvin in temperature.
At a given frequency, this signal varies in strength over the
face of a given cluster because it depends on the depth of the cluster
gas at each point in the cluster. The distortion is strongest in the
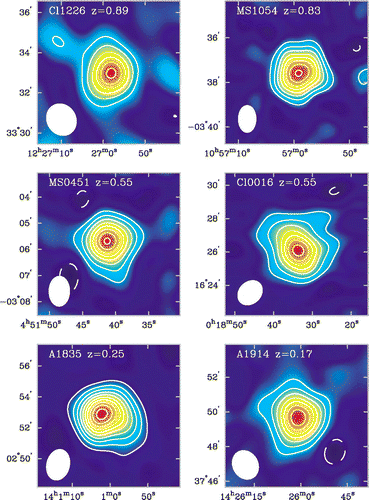
center and decreases towards the edges. This is seen in figure 4 below
for 6 clusters which contains radio images obtained at 30 GHz from the
Owens Valley Radio Observatory and the Berkeley-Illinois-Maryland
Association Array. Red represents the strongest distortion and light
blue the weakest.
- It is independent of redshift. This is seen in the figure 4 to
the right where the 6 clusters differ in redshift, given by the
parameter "z", but the SZ effect is of equal intensity. It is this
property that will enable the SZA to build a catalog of all the
clusters that are present in the region of sky that it looks at.
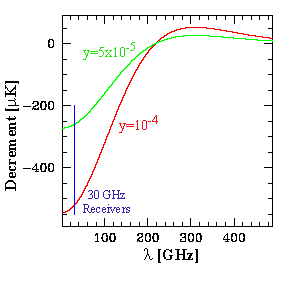
- The intensity of the SZ effect summed over an entire cluster
depends on the total mass of the cluster as is shown in figure 5. The
green line represents a lower mass cluster than the red line. (The
parameter "y" is the Compton y parameter.) The difference in the
temperature of the cosmic microwave background and antenna temperature
is plotted on the vertical axis. One can clearly see that the lower
mass cluster produces a weaker signal than the higher mass
cluster. This is the reason why the SZ effect is associated with
massive objects such as clusters of galaxies. A single galaxy has
insufficient mass to cause distortions in the cosmic background
radiation.
|
Figure 4: Sunyaev-Zeldovich effect images for a sample of galaxy clusters over a large redshift range (indicated by "z" values). These interferometric images are at 30 GHz frequency and were taken with the Owens Valley Radio Observatory and the Berkeley-Illinois-Maryland Association Array. (Credit: Carlstrom et al., Annual Reviews of Astronomy & Astrophysics vol 40, pg 643, 2002) |
|
Figure 5: Illustration of the strength of the SZ effect on the total mass of a cluster. The vertical axis shows the SZ decrement, which is the difference between the cosmic microwave background signal and the SZ signal. The green line is the SZ decrement for a cluster of lower mass compared to that of the red line, clearly showing that the SZ effect depends directly on total cluster mass. The 30 GHz frequency is marked as it is the one at which most of the SZ observations have been carried out so far. The SZA will observe at this frequency as well as 90 GHz. |