A number of high resolution imaging techniques exist which involve
Fourier analysis of individual short exposure images taken at a large
telescope (see e.g. Roddier (1988)). Only those methods which
preserve some Fourier phase information from the source can be used to
produce true astronomical images, and the techniques which preserve
Fourier phase information require higher light levels than the Lucky Exposures and
shift-and-add methods (see e.g. Roddier (1988); Chelli (1987)). These
methods are thus limited to a smaller range of astronomical
targets. The bispectral analysis (speckle masking) method has often
been applied to data taken through masked apertures, where most of the
aperture is blocked off and light can only pass through a series of
small holes (subapertures). For simplicity these aperture masks are
usually either placed in front of the secondary
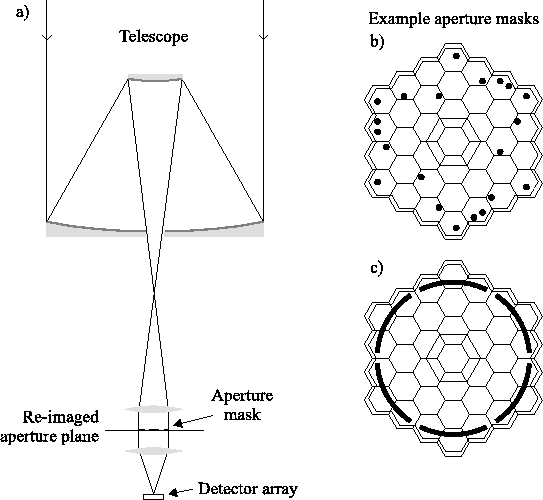
(e.g. Tuthill et al. (2000)) or placed in a re-imaged aperture plane as
shown in Figure 1.6a
(e.g. Haniff et al. (1987); Young et al. (2000); Baldwin et al. (1986)). The masks are usually
categorised either as non-redundant or partially
redundant. Non-redundant masks consist of arrays of small holes where
no two pairs of holes have the same separation vector. Each pair of
holes provides a set of fringes at a unique spatial frequency in the
image plane. Partially redundant masks are usually designed to provide
a compromise between minimising the redundancy of spacings and
maximising both the throughput and the range of spatial frequencies
investigated (Haniff & Buscher, 1992; Haniff et al. , 1989). Figures 1.6b and
1.6c show examples of aperture masks used in front of the
secondary at the Keck telescope by Peter Tuthill and collaborators;
Figure 1.6b is a non-redundant mask while
Figure 1.6c is partially redundant. Although the
signal-to-noise at high light level can be improved with aperture
masks, the limiting magnitude cannot be significantly improved for
photon-noise limited detectors (see Buscher & Haniff (1993)).
Figure 1.6:
a) shows a simple experiment using an aperture mask in a re-imaged
aperture plane. b) and c) show diagrams of aperture masks which were
placed in front of the secondary mirror of the Keck telescope by Peter
Tuthill and collaborators. The solid black shapes represent the
subapertures (holes in the mask). A projection of the layout of the
Keck primary mirror segments is overlaid.
 |
Bob Tubbs
2003-11-14