Next: Isoplanatic angle Up: Results Previous: Results Contents
An example image generated by applying the Lucky Exposures method to ![]()
![]() of
data taken on M15 (field 1) on 2001 July 26 is shown in
Figure 5.12. The
of
data taken on M15 (field 1) on 2001 July 26 is shown in
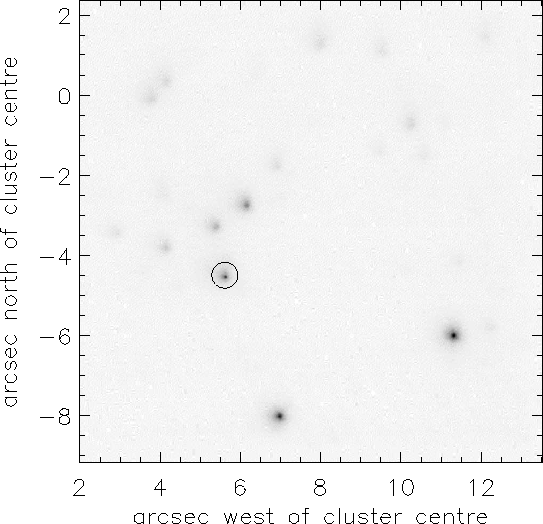
Figure 5.12. The ![]() star which was used as the
reference for selection of the best
star which was used as the
reference for selection of the best ![]() of exposures and for
exposure re-centring has been circled in the figure. The full frame of
the CCD was read out in these observations. With the
of exposures and for
exposure re-centring has been circled in the figure. The full frame of
the CCD was read out in these observations. With the ![]()
![]() pixel
rate of the CCD controller the frame rate for these observations was
limited to
pixel
rate of the CCD controller the frame rate for these observations was
limited to ![]()
![]() , allowing image motion to slightly blur the
exposures. Despite this, other stars in the field have FWHM as small
as
, allowing image motion to slightly blur the
exposures. Despite this, other stars in the field have FWHM as small
as ![]()
![]() , a substantial improvement over
, a substantial improvement over ![]()
![]() for the
seeing limited image shown in Figure 5.13. There was no
evidence for gradual drift in the stellar positions during this run,
indicative of telescope tracking errors which would blur the
seeing-limited image.
for the
seeing limited image shown in Figure 5.13. There was no
evidence for gradual drift in the stellar positions during this run,
indicative of telescope tracking errors which would blur the
seeing-limited image.
 |
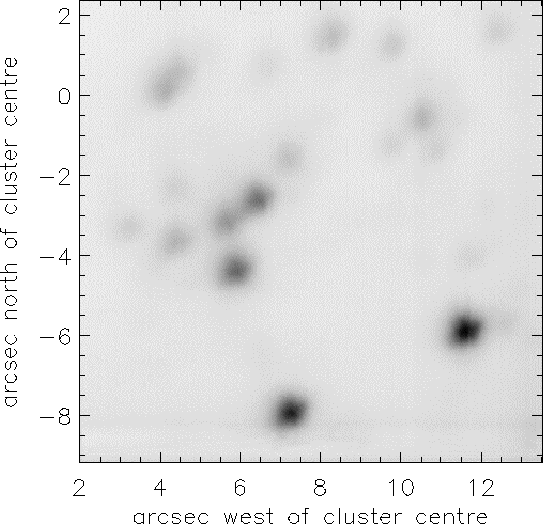 |
As only ![]() of the observing time was used for the image shown in
Figure 5.12, the signal-to-noise ratio for detection of a
star is expected to be lower than for the average image in
Figure 5.13. If we assume that the images are
sky-background limited, we can estimate the fractional decrease in
signal-to-noise ratio relatively straightforwardly. We need to take
into account the change in the size and shape of the PSF , but the
image FWHM provides a good estimate for this effect. A good estimate
for the fractional change
of the observing time was used for the image shown in
Figure 5.12, the signal-to-noise ratio for detection of a
star is expected to be lower than for the average image in
Figure 5.13. If we assume that the images are
sky-background limited, we can estimate the fractional decrease in
signal-to-noise ratio relatively straightforwardly. We need to take
into account the change in the size and shape of the PSF , but the
image FWHM provides a good estimate for this effect. A good estimate
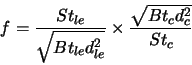
for the fractional change ![]() in signal-to-noise ratio for detection
of a star of flux
in signal-to-noise ratio for detection
of a star of flux ![]() will be:
will be:
 |
(5.2) |
| (5.3) |
Bob Tubbs 2003-11-14