cjo25
Summary and figures of the currently available experimental data on CMB temperature anisotropies. A couple of packages for download, including a C version of the WMAP likelihood code.
NEWS
previous news
- 10.07.03: I am now in Switzerland. News and features on this page.
- 01.07.03: New 'Talks and posters' page here with abstracts and downloads of slides and posters in PDF format.
- 01.07.03: I have come back from Wales and I have put the slides of my seminar here. I am on my way to Switzeland to write up and any other plans can be found here.
- 28.05.03: Less cluttered navigation. Publications now available here. Also, I have added an online research proposal here.
- 16.05.03: Another update, another design :). I have now written my WMAP page with a C version of the likelihood code for download and some recent results.
List of publications with abstracts and links.
List of talks an posters with abstracts and downloads.
|
|
Welcome to my modest WMAP page!
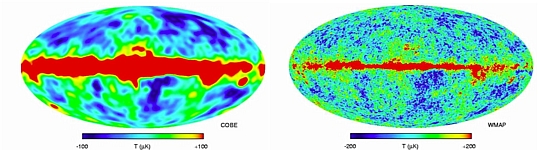
To the left, the CMB temperature anisotropies taken by the COBE satellite and released in 1992. The colour scale is ± 100 μK. To the right, the WMAP result released in 2003. The colour scale is ± 200 μK. These images are copyrighted at NASA.
The original WMAP data release can be found on the LAMBDA web site. This includes COBE and other past/ongoing experiments. The WMAP web site cann be found here.
Links to the WMAP team members' pages (those available):
WMAP Likelihood code
The WMAP data products are available here. That includes maps (CMB, foregrounds, masks, etc), time-ordered data, power spectra, parameter estimation results, etc. For the parameter estimation, they provide a likelihood code in fortran 90.
This code is now available here in C.
Download C version of the WMAP likelihood code
The archive contains the following files:
- wmap.c: contains functions to read and store the WMAP data, calculate the correlation matrix of the data given a theoretical model and calculate the likelihood of the model. For more details about the likelihood calculation, please refer to Verde & al.
- wmap.h: header file defining the WMAP variables
- wmap_tester.c: brief interface program to read in a test spectrum and print out its likelihood. This is identical to the original WMAP interface program and should produce exactly the same result.
- data files: In a 'DATA' directory, the WMAP temperature and polarization data, and the data to compute the off_diagonal terms of the correlation matrices.
- testmodel.dat: This is a test theoretical power spectrum. It is the same as provided with the original WMAP likelihood code.
- readme.txt : contains information about licencing and instructions to compile the code.
More detailed information can be found in the readme file.
Please note that although the data included in this archive is identical to the data included in the original WMAP likelihood code, its format might be slightly different. Therefore, the C version should be used with the data files in the same format as the included files. Likewise, the fortran version of the code should be used with the data files provided in their original archive. This is mainly due to slight input-output differences between fortran90 and C.
This version is my own translation of the WMAP likelihood code. It contains the WMAP original licence and a couple of notes. It should be straightforward to use, but if you encounter eny difficulties, let me know!
Below is a copy of the WMAP licence:
WMAP Software for First Year Data Release: Likelihood Code
*****************************************************************************
If you use this code in any publication, please reference Verde & al. (2003),
if you use the accompanying data files, please also reference
Hinshaw & al. (2003) and Kogut et al. (2003).
*****************************************************************************
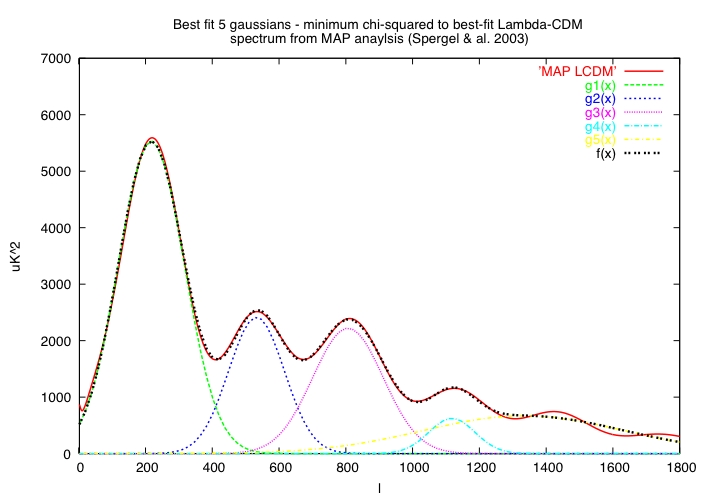
Not mentioned in the above list is the parameter estimation paper: Spergel & al. (2003)
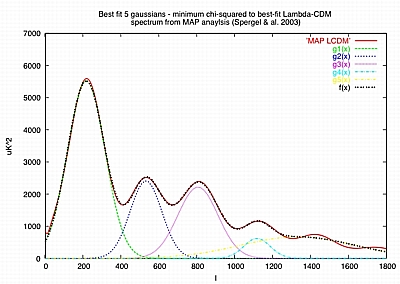
Shape of the CMB power spectrum
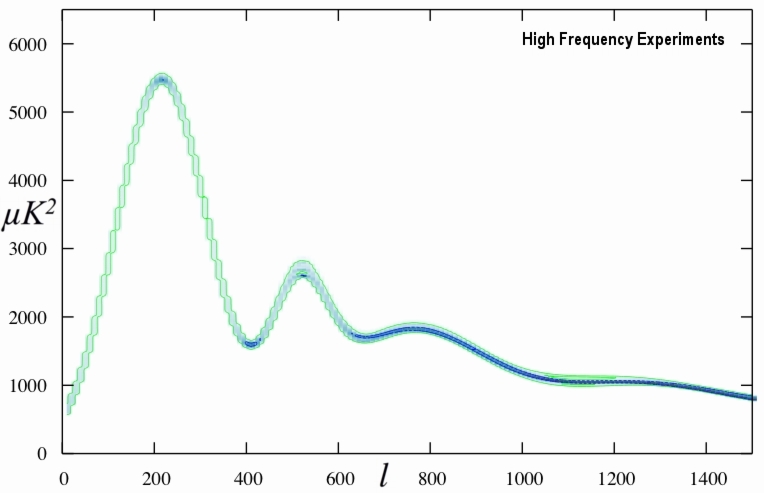
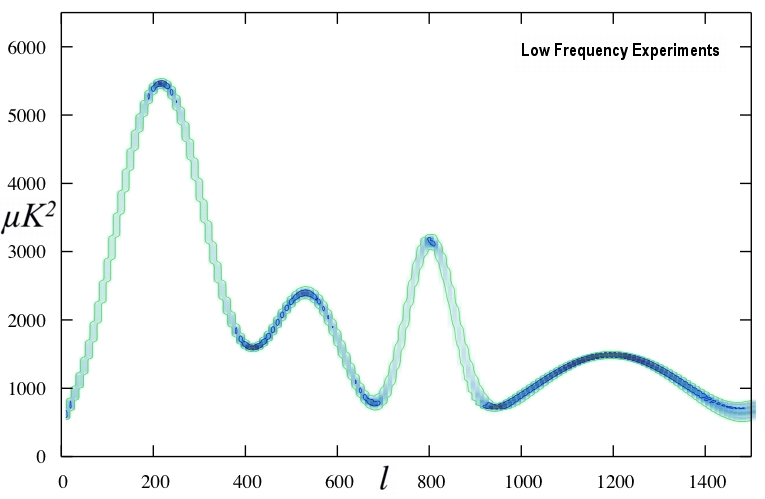
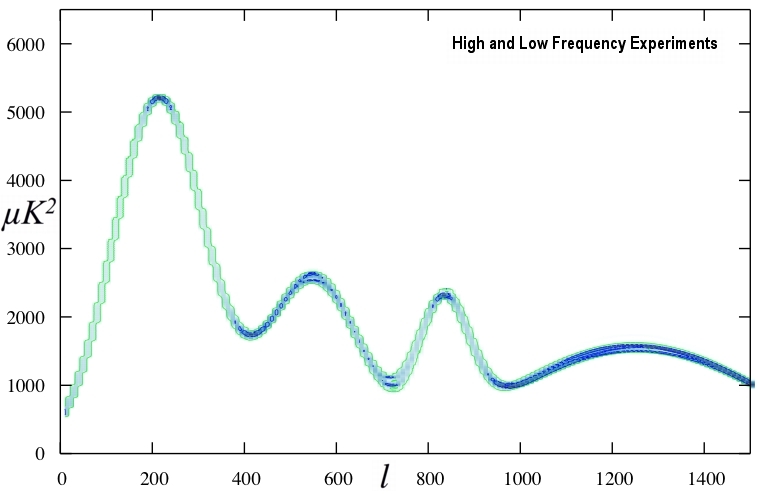
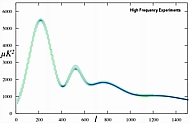
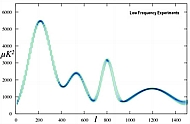
Using previously obtained results as a basis, I have used the WMAP data in a phenomenological analysis of the shape of the CMB anisotropy spectrum (see figure below). In order to investigate the secondary features of the PS at high multipoles and experimental systematics, I have analysed high and low frequency experiments separately.
The high-multipole data I used is summarised in table below and the results on the shape of the power spectrum are in the figure below.
| Experiment |
l-range |
reference |
| Low Frequency experiments |
|
|
| DASI |
117 - 836 |
Halverson & al, Ap. J, 568, 38, 2002 |
| CBI |
400 - 1450 |
Pearson & al, 2002 |
| VSAE |
160 - 1400 |
Grainge & al, 2002 |
| High Frequency experiments |
|
|
| Acbar |
150 - 3000 |
Kuo & al, 2002 |
| Archeops |
15 - 350 |
Benoit & al, 2002 |
| Boomerang |
50 - 1000 |
Ruhl & al, 2002 |
| Maxima |
73 - 1161 |
Lee & al, 2001, Ap. J. 561, 2001 |
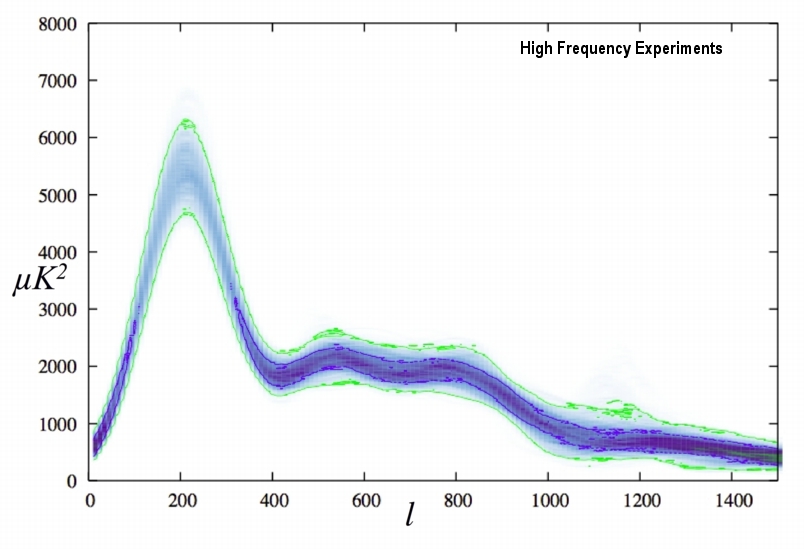
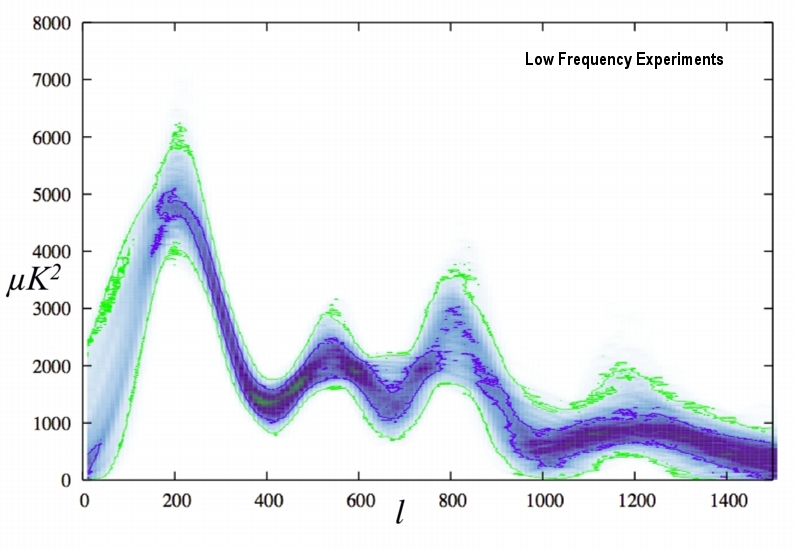
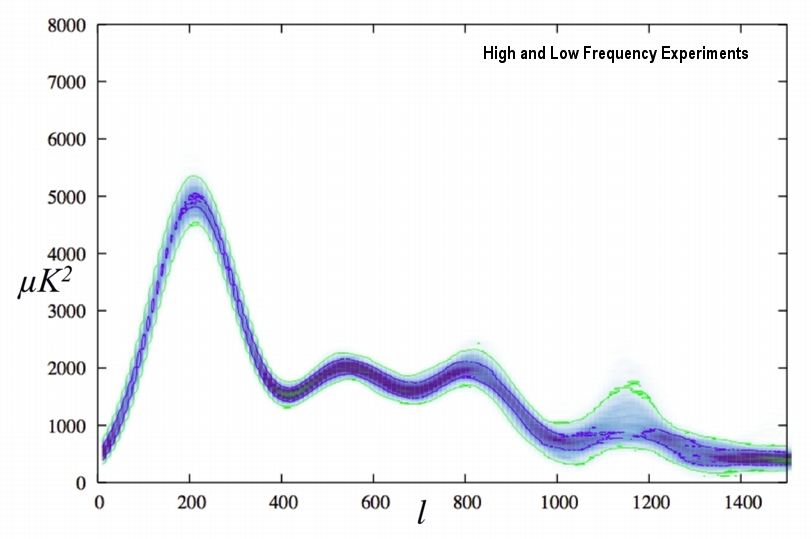
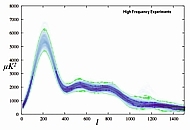
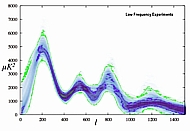
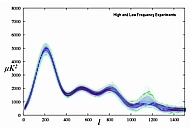
These are the results before and after inclusion of the WMAP data for high frequency (bolometers), low frequency (interferometers), and all experiments:
(click thumbnail for a bigger image)
Analysis:
- The high frequency data, bolometers, suffer from beam and pointing uncertainies which tend to smear features in the poower spectrum. We have marginalised over these uncertainties, however, they seem to still have an effect.
- The low frequency data, interferometers, measure the CMB in Fourier space directly. The band powers can have a tendency of being anti-correlated. Although this is well encoded in the correlation matrices of the data, it seems to still appear.
- When combining both types of experiments, the main observation is that the inclusion of the WMAP data enhances the secondary features. The last bump in the power spectrum is a compromise because there is not enough data yet to constrain any propoer peaks out there.
What this means, physically:
The low frequency data prefers a third peaks higher than the second. The high-frequency data prefers a much lower third peak. Both data sets together favour a third peak slightly lower than the second peak. This ratio depends strongly on the physical density of cold dark matter. It translates into bolometer experiments having a tendency to prefer less CDM and more baryons (under the assumption of a flat universe), whereas interferometer experiments favour less baryons and more CDM.
More details about this analysis can be found in astro-ph/0305254.
|
|