| Toco CMB Anisotropy Experiment | PrincetonCMB |
· Instrument
» Site
· Analysis
· Results
· Internal
Chilean Atmospheric Structure Functions
Using data from the site testing interferometer operated by NRAO at the propsed MMA site, I have calculated predictions for the atmosperic angular temperature structure function to which our CMB telescope is sensitive. Details of the calculation are available here (well, soon).
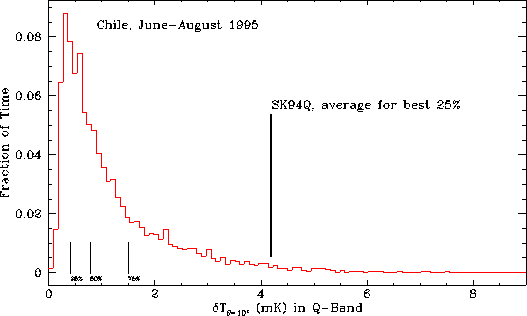
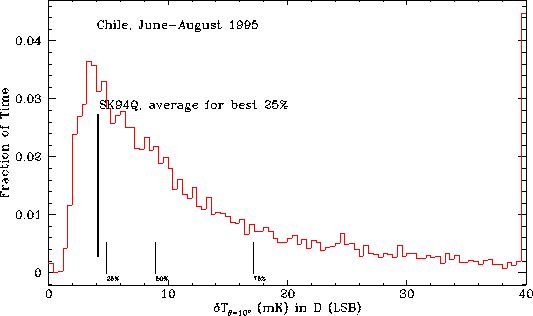
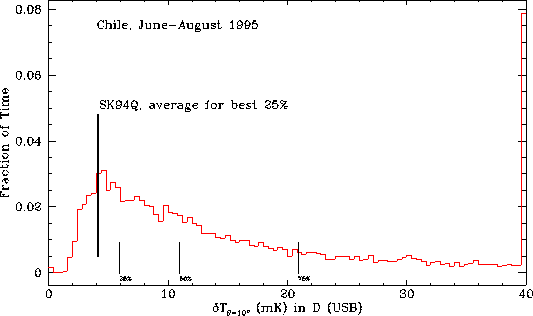
The following plots show this angular temperature structure function, evaluated at an angle of 10 degrees, the effective chop angle of the MAT experiment. In effect, this is the expected temperature difference between two simultaneous beams separated by 10 degrees.
The data, kindly provided by M. Holdaway of NRAO, cover the period from June through August 1995. This was the most complete winter period available; no other selection criteria were applied. All data taked by the interferometer are included here.
The four bands shown here are the bands used by the experiment; in these calculations they only differ by their dependence on precipitable water vapor (PWV). Thus, the plots for the different bands are merely scaled versions of each other. For this reason, the full suite of plots is given for Ka-band only; the others are illustrated by their histograms only. The comparison line is for the Q-band data from Saskatoon in every case, so the Q-band histogram gives the most faithful comparison.
Note this slight cheat: the site interferometer measurements come from the NRAO site at an altitude of 16,400 ft. The atmospheric model, used to translate PWV to opacity, was run for 17,000 ft, closer to our actual observing altitude at ~17,200 ft. The model was Liebe (1993), packaged by Pardo (1996), and run by M. Holdaway at NRAO.
Overview
- Ka-Band
- Histograms
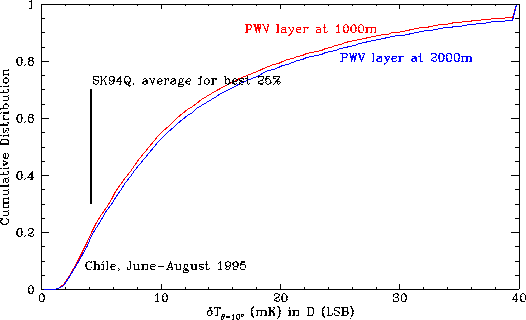
- Comparison of different heights of the PWV layer
Ka-Band Plots
Timeline
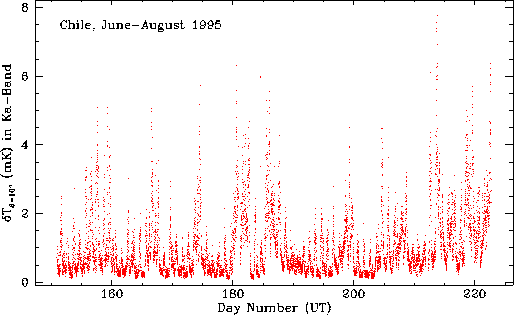
Timeline of the temperature differences in Ka-band for the entire period analyzed. Clearly, there are diurnal variations as well as periods of better and worse weather.
Time of Day
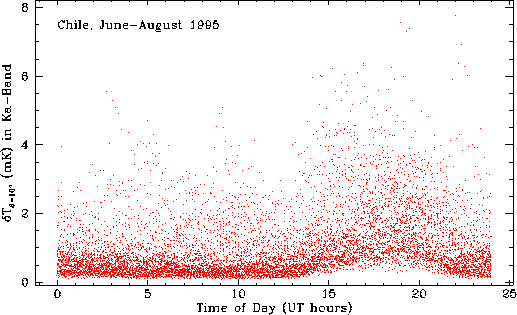
Temperature differences in Ka-band as a function of time of day, showing the diurnal effect. Periods of bad weather merely "puff up" the upper part of the distribution. Predictably, night time is better.
Cumulative Distribution
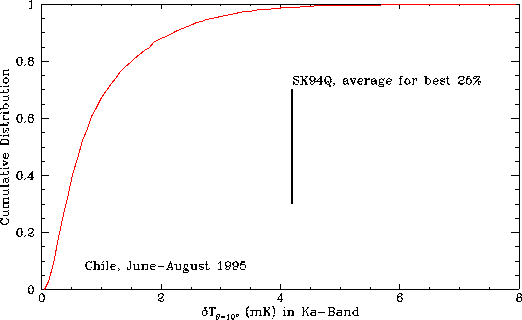
Cumulative distribution of the temperature differences in Ka-band for the entire period analyzed. As in all the other plots in this series, the layer of PWV was assumed at a height of 1000m above the site. A higher layer worsens our estimates somewhat; the comparison is shown below.
Histogram
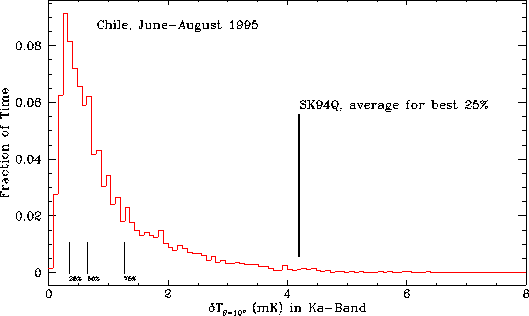
Histogram of the temperature differences in Ka-band for the entire period analyzed. The comparison with the average of the accepted data in Saskatoon at Q-band is shown. The fraction of accepted data in Saskatoon was about 25%. The comparison is best made at Q-band, of course.
Histograms
Note that the X-axis scale changes from plot to plot. Ka-band is above.
Q-Band Histogram
D-Band (LSB) Histogram
D-Band (USB) Histogram
PWV Layer Comparison
