

Galaxies/QuasarsThis is the deepest, sharpest infrared image of the cosmos so far. The view of the early Universe toward the southern constellation Volans was achieved in 12.5 hours of exposure with the NIRCam instrument on the James Webb Space Telescope (JWST). The stars with six visible spikes are well within our own Milky Way.
Webb's First Deep Field
Image Credit: NASA, ESA, CSA, STScI, NIRCam The six-spike diffraction pattern is characteristic of Webb's 18 hexagonal mirror segments operating together as a single 6.5 meter diameter primary mirror. The thousands of galaxies flooding the field of view are members of the distant galaxy cluster SMACS0723-73, some 4.6 billion light-years away. Luminous arcs that seem to infest the deep field are even more distant galaxies though. Their images are distorted and magnified by the dark matter dominated mass of the galaxy cluster, an effect known as gravitational lensing. Analyzing light from two separate arcs below the bright spiky star, Webb's NIRISS instrument indicates the arcs are both images of the same background galaxy. And that galaxy's light took about 9.5 billion years to reach the James Webb Space Telescope. Large Scale Structure (LSS) surveys are designed to map the three-dimensional distribution of matter throughout the universe on cosmic scales. These low-redshift observations of galaxies, quasars (QSO's) and intergalactic gas (e.g. through the use of Lyα forest observations; Weinberg et al. 2003) assist with constraints on growth of structure, total matter content, and, if the survey volume is large enough, the expansion history of the universe. Legacy LSS surveys include 2dFGRS (2 degree Field Galaxy Redshift Survey; Colless et al. 2001), 6dFGS (6 degree Field Galaxy Survey; Jones et al. 2004) and WiggleZ (Blake et al. 2010). Contributed by the NASA / LAMBDA Archive Team. A major survey is the Sloan Digital Sky Survey (SDSS) which began in 2000, but has continued over time as a phased series of subsequent surveys with additional instruments, such as the SDSS/BOSS (Baryon Oscillation Spectroscopic Survey) and SDSS/eBOSS (extended BOSS). Analyses of LSS data extract matter power spectra, correlation functions, mass estimates from weak lensing (WL) and redshift space distortions (RSD) resulting from peculiar velocities of galaxies.  Image Credit:
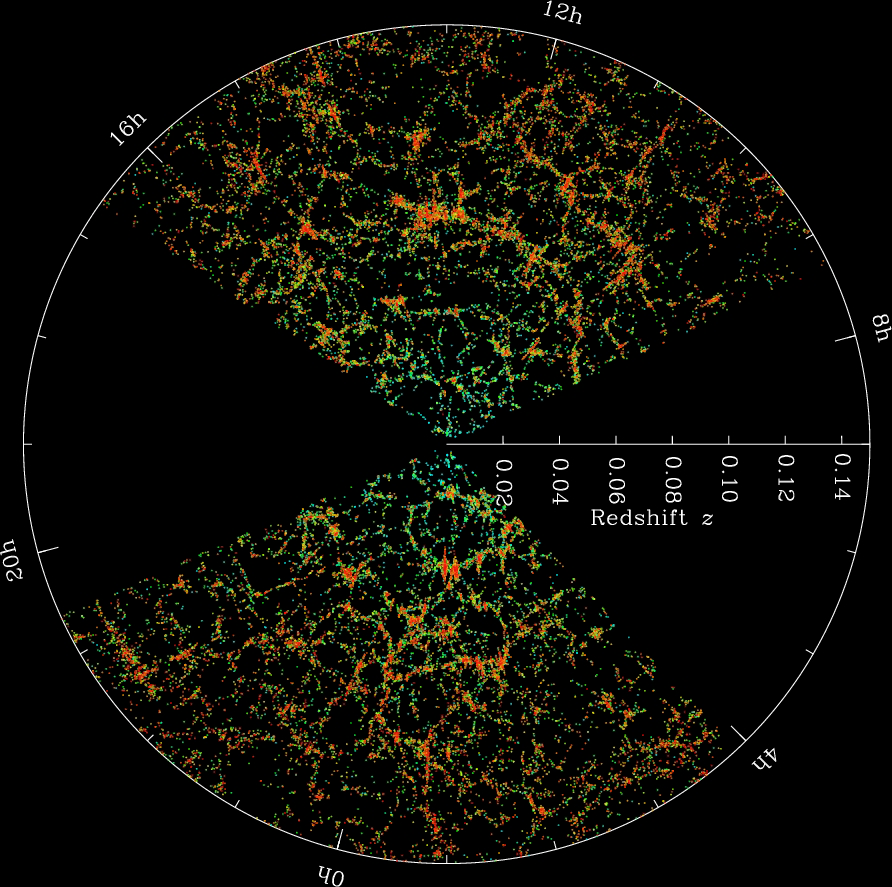
M. Blanton and the Sloan Digital Sky Survey A slice through the SDSS 3-dimensional map of the distribution
of galaxies. Earth is at the center, and each point represents a galaxy, typically containing about 100 billion stars.
Galaxies are colored according to the ages of their stars, with the redder, more strongly clustered points showing galaxies
that are made of older stars. The outer circle is at a distance of two billion light years. The region between the wedges
was not mapped by the SDSS because dust in our own Galaxy obscures the view of the distant universe in these directions.
Most recently, the Dark Energy Spectroscopic Instrument (DESI) has released its first year of observations, producing the most extensive galaxy survey yet. The image below is in the same format as that shown above for the SDSS data. Further observations will be made over the next four years.
Image Credit: Claire Lamman/DESI collaboration; custom colormap package by cmastro DESI has made the largest 3D map of our universe to date.
Earth is at the center of this thin slice of the full map. In the magnified section, it is easy to see the underlying
structure of matter in our universe.
|


