In order to assess the short exposure PSF experimentally,
observations of individual unresolved stars were undertaken at the
NOT. These observations were made at the Cassegrain focus of the
telescope during technical time at the very end of the night of 2000
May 12 and on the night of 2000 May 13 by Craig Mackay, John Baldwin
and Graham Cox. The JOSE camera used for the observations comprised a
 front-illuminated frame-transfer CCD with
 square pixels run by an AstroCam 4100 controller. The controller
allowed windowing of the area of readout and variable pixel readout
rates up to
square pixels run by an AstroCam 4100 controller. The controller
allowed windowing of the area of readout and variable pixel readout
rates up to 
 . The detector read noise was typically
 --
-- electrons for these observations. The
  beam at the
focus was converted to
beam at the
focus was converted to  using a single achromat to give an image
scale of
using a single achromat to give an image
scale of 

 (
(

 ).
).
The observations were taken through the I-band filter from the HiRac
instrument at the NOT. The bandpass of this filter is similar to a
top-hat in shape, with a centre wavelength of 
 and a
bandwidth of
and a
bandwidth of  . All of the short exposures were taken at
frame rates higher than
. All of the short exposures were taken at
frame rates higher than 
 and without autoguiding to ensure
that the temporal behaviour of the periods of good seeing was
adequately characterised.
and without autoguiding to ensure
that the temporal behaviour of the periods of good seeing was
adequately characterised.
The diffraction-limited PSF of the 
 telescope with
  secondary obstruction has a FWHM of
  at the observing
wavelength of . The pixel scale of
was a compromise between the area of sky which could be observed at
high frame rate and the degradation of the image FWHM due to the
finite pixel size.
at the observing
wavelength of . The pixel scale of
was a compromise between the area of sky which could be observed at
high frame rate and the degradation of the image FWHM due to the
finite pixel size.
Four stars were observed at the end of the first night of technical
time at the NOT in May 2000. Two of these stars ( Aquilae and
 Aquilae) were sufficiently bright that the CCD camera reached
saturation in the best exposures, and these runs have been excluded
from further analyses. A small number of frames (less than 1%) in all
the runs were mis-recorded by the camera, and these frames have also
been excluded from further analysis. Table 3.2
describes the two usable observing runs from the first night.
Aquilae) were sufficiently bright that the CCD camera reached
saturation in the best exposures, and these runs have been excluded
from further analyses. A small number of frames (less than 1%) in all
the runs were mis-recorded by the camera, and these frames have also
been excluded from further analysis. Table 3.2
describes the two usable observing runs from the first night.
Table 3.2:
High frame-rate observations performed at the end of
the first night of NOT technical time in May 2000.
| Target | Frame rate / Hz | Number of
exposures | Seeing FWHM / as | Strehl ratio for best
1% of exposures |
|---|
| epsilon Aquilae | 185 | 6000 | 0.38 | 0.26
| | V656 Herculis | 185 | 6000 | 0.49 | 0.21 |
|
The seeing was good and the short exposure images clearly showed a
single bright speckle at some instants. In order to assess the
atmospheric conditions, the individual short exposures were summed
without re-centring to produce an average image, equivalent to a
conventional long exposure with duration equal to the total time for
the run. The FWHM of the star in this image represents a measure of
the atmospheric seeing conditions, and is listed in column  of
Table 3.2. The FWHM measurements are consistent with an
of
Table 3.2. The FWHM measurements are consistent with an
 of
of  --
-- at the observing wavelength
for Kolmogorov turbulence with an infinite outer scale. The telescope
diameter would then equal
at the observing wavelength
for Kolmogorov turbulence with an infinite outer scale. The telescope
diameter would then equal  or
or  times . Previous
atmospheric measurements at La Palma have typically favoured an outer
scale of a few metres (see e.g. Nightingale & Buscher (1991); Wilson et al. (1999)), and
under these conditions a slightly smaller value of would be
consistent with the long exposure FWHM.
times . Previous
atmospheric measurements at La Palma have typically favoured an outer
scale of a few metres (see e.g. Nightingale & Buscher (1991); Wilson et al. (1999)), and
under these conditions a slightly smaller value of would be
consistent with the long exposure FWHM.
A list of the observations on the second night is given in
Table 3.3. Each run typically comprised between  and
and  frames over a period of
  --
--
 . Target stars, both
single stars and binaries, were chosen principally lying in the
declination range
. Target stars, both
single stars and binaries, were chosen principally lying in the
declination range  --
-- and close to the meridian,
so that most of the data was taken at zenith angles
and close to the meridian,
so that most of the data was taken at zenith angles
 . Zenith angles up to
  were explored later in
the night, and the effects of atmospheric dispersion became
significant, since no corrective optics were employed. As on the first
night, a small number of short exposures in each run were mis-recorded,
and these exposures were excluded from further analysis.
were explored later in
the night, and the effects of atmospheric dispersion became
significant, since no corrective optics were employed. As on the first
night, a small number of short exposures in each run were mis-recorded,
and these exposures were excluded from further analysis.
Table 3.3:
Observations on the second night of NOT
technical time in May 2000.
| Target | Frame rate / Hz | Number of
exposures | Seeing FWHM / as | Strehl ratio for best
1% of exposures |
|---|
| alpha Leonis | 185 | 6000 | 0.71 | 0.079 |
| gamma Leonis | 159 | 5000 | 0.65 | 0.092 |
| gamma Leonis | 182 | 5000 | 0.54 | 0.099 |
| zeta Bootis | 152 | 24000 | 0.58a | 0.20 |
| zeta Bootis | 152 | 24000 | 0.64a | 0.17 |
| CN Bootis | 152 | 2000 | 0.58 | 0.084 |
| alpha Herculis | 191 | 6000 | 0.42 | 0.21 |
| alpha Herculis | 191 | 6000 | 0.38 | 0.21 |
| beta Delphini | 373 | 10000 | 0.52 | 0.20b |
| beta Delphini | 257 | 10000 | 0.40 | 0.18b |
| beta Delphini | 190 | 10000 | 0.60 | 0.16b |
| alpha Delphini | 180 | 10000 | 0.47 | 0.18b |
| alpha Delphini | 180 | 10000 | 0.57 | 0.20b |
a Approximate value after accounting for tracking error
b The Strehl ratio was reduced by atmospheric
dispersion at high zenith angle
|
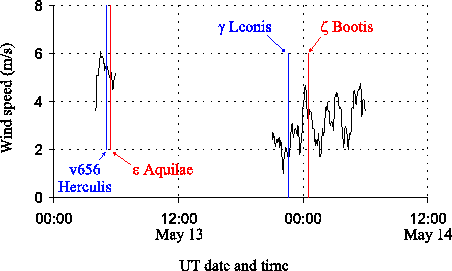
Figure 3.7 shows the wind speed during the observations
at the NOT in May 2000. These measurements were taken at the top of
the NOT weather mast situated at the right hand side of
Figure 3.1, a few tens of metres from the telescope.
Figure 3.7:
The wind speed measured at the NOT weather station during the
observations in May 2000. The times that four runs were taken are
indicated by the star names on the graph. The wind speed was typically
in the range  --
--  for these observations.
 |
Bob Tubbs
2003-11-14