

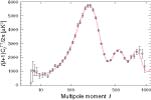
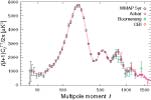
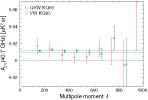
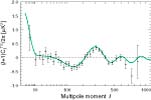
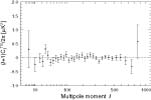
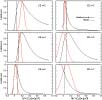
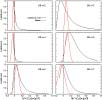
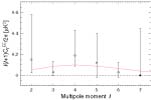
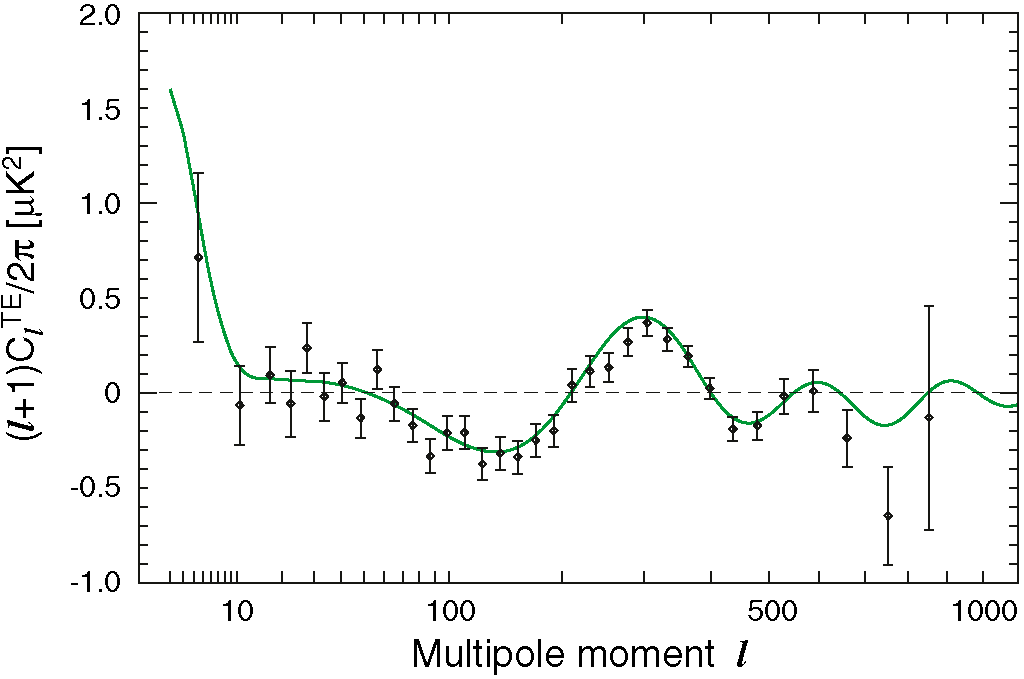
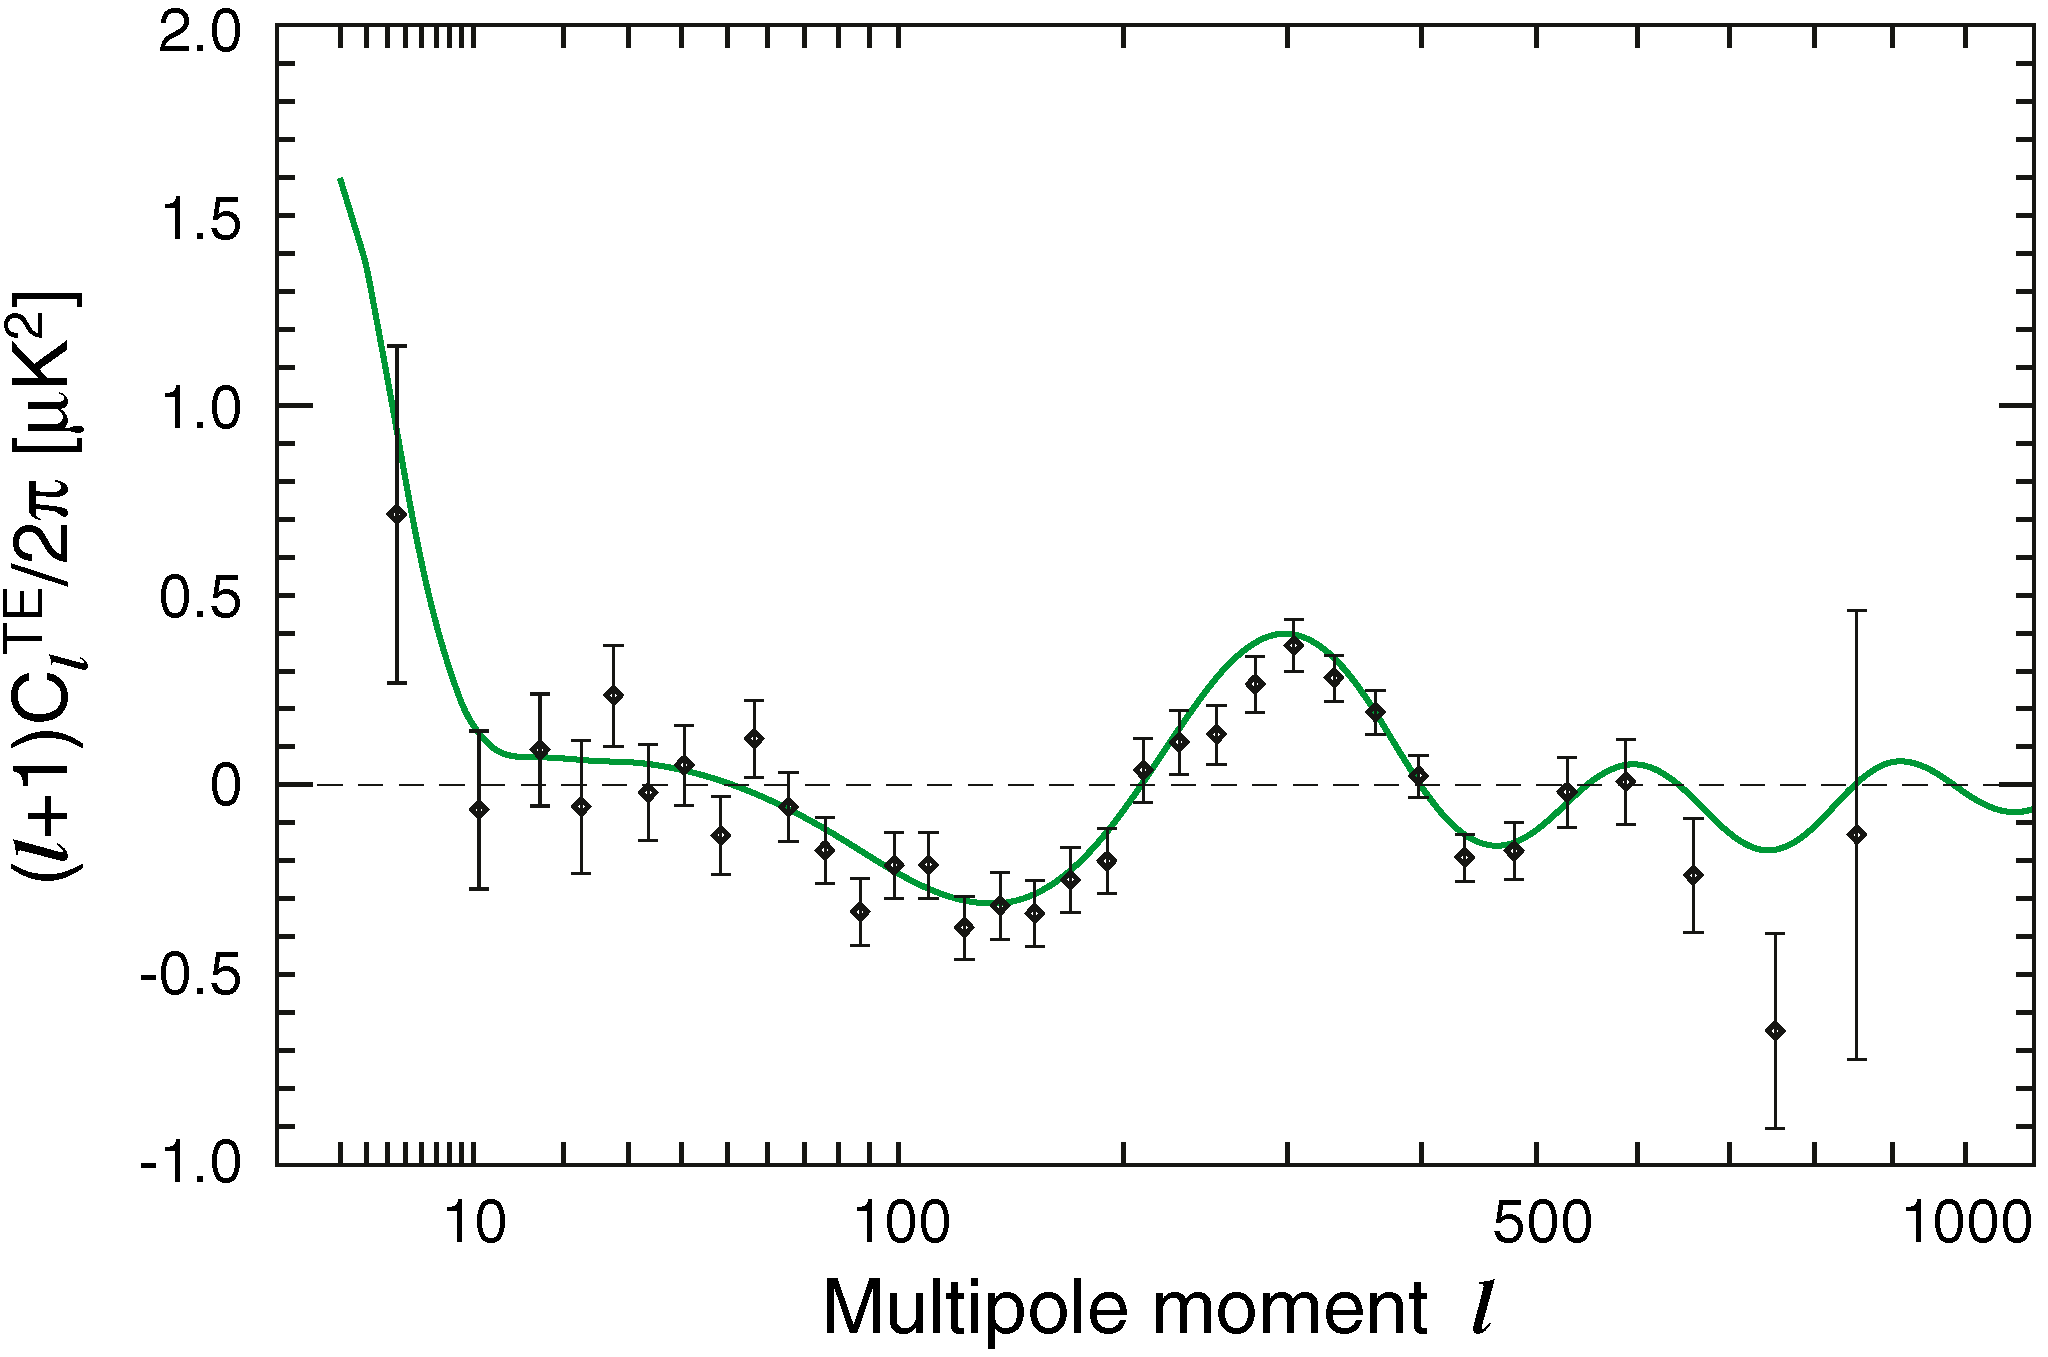
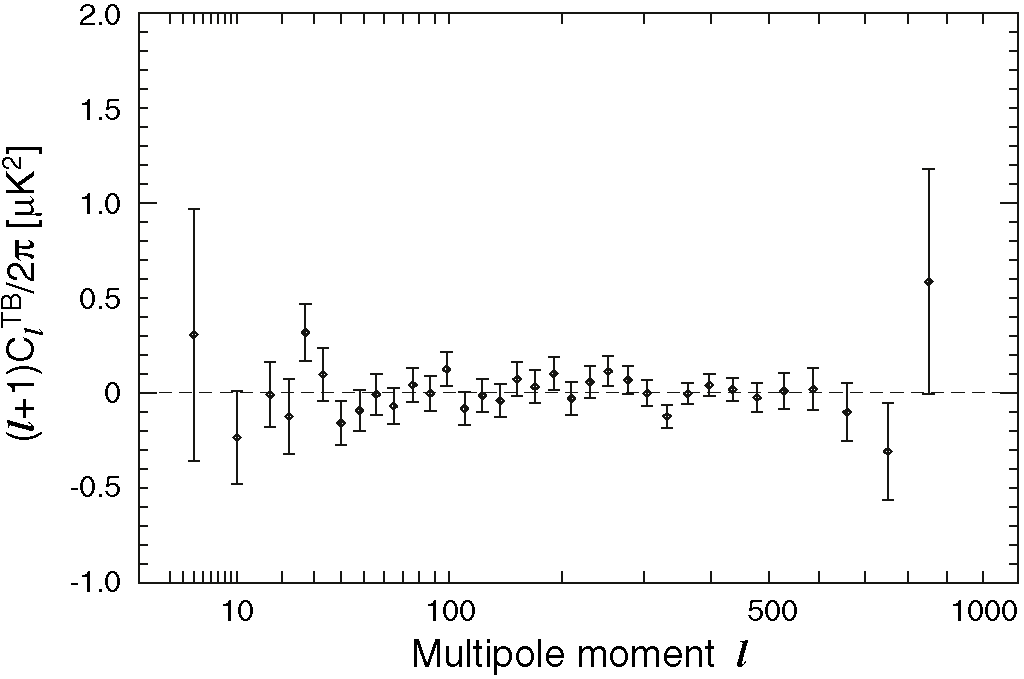
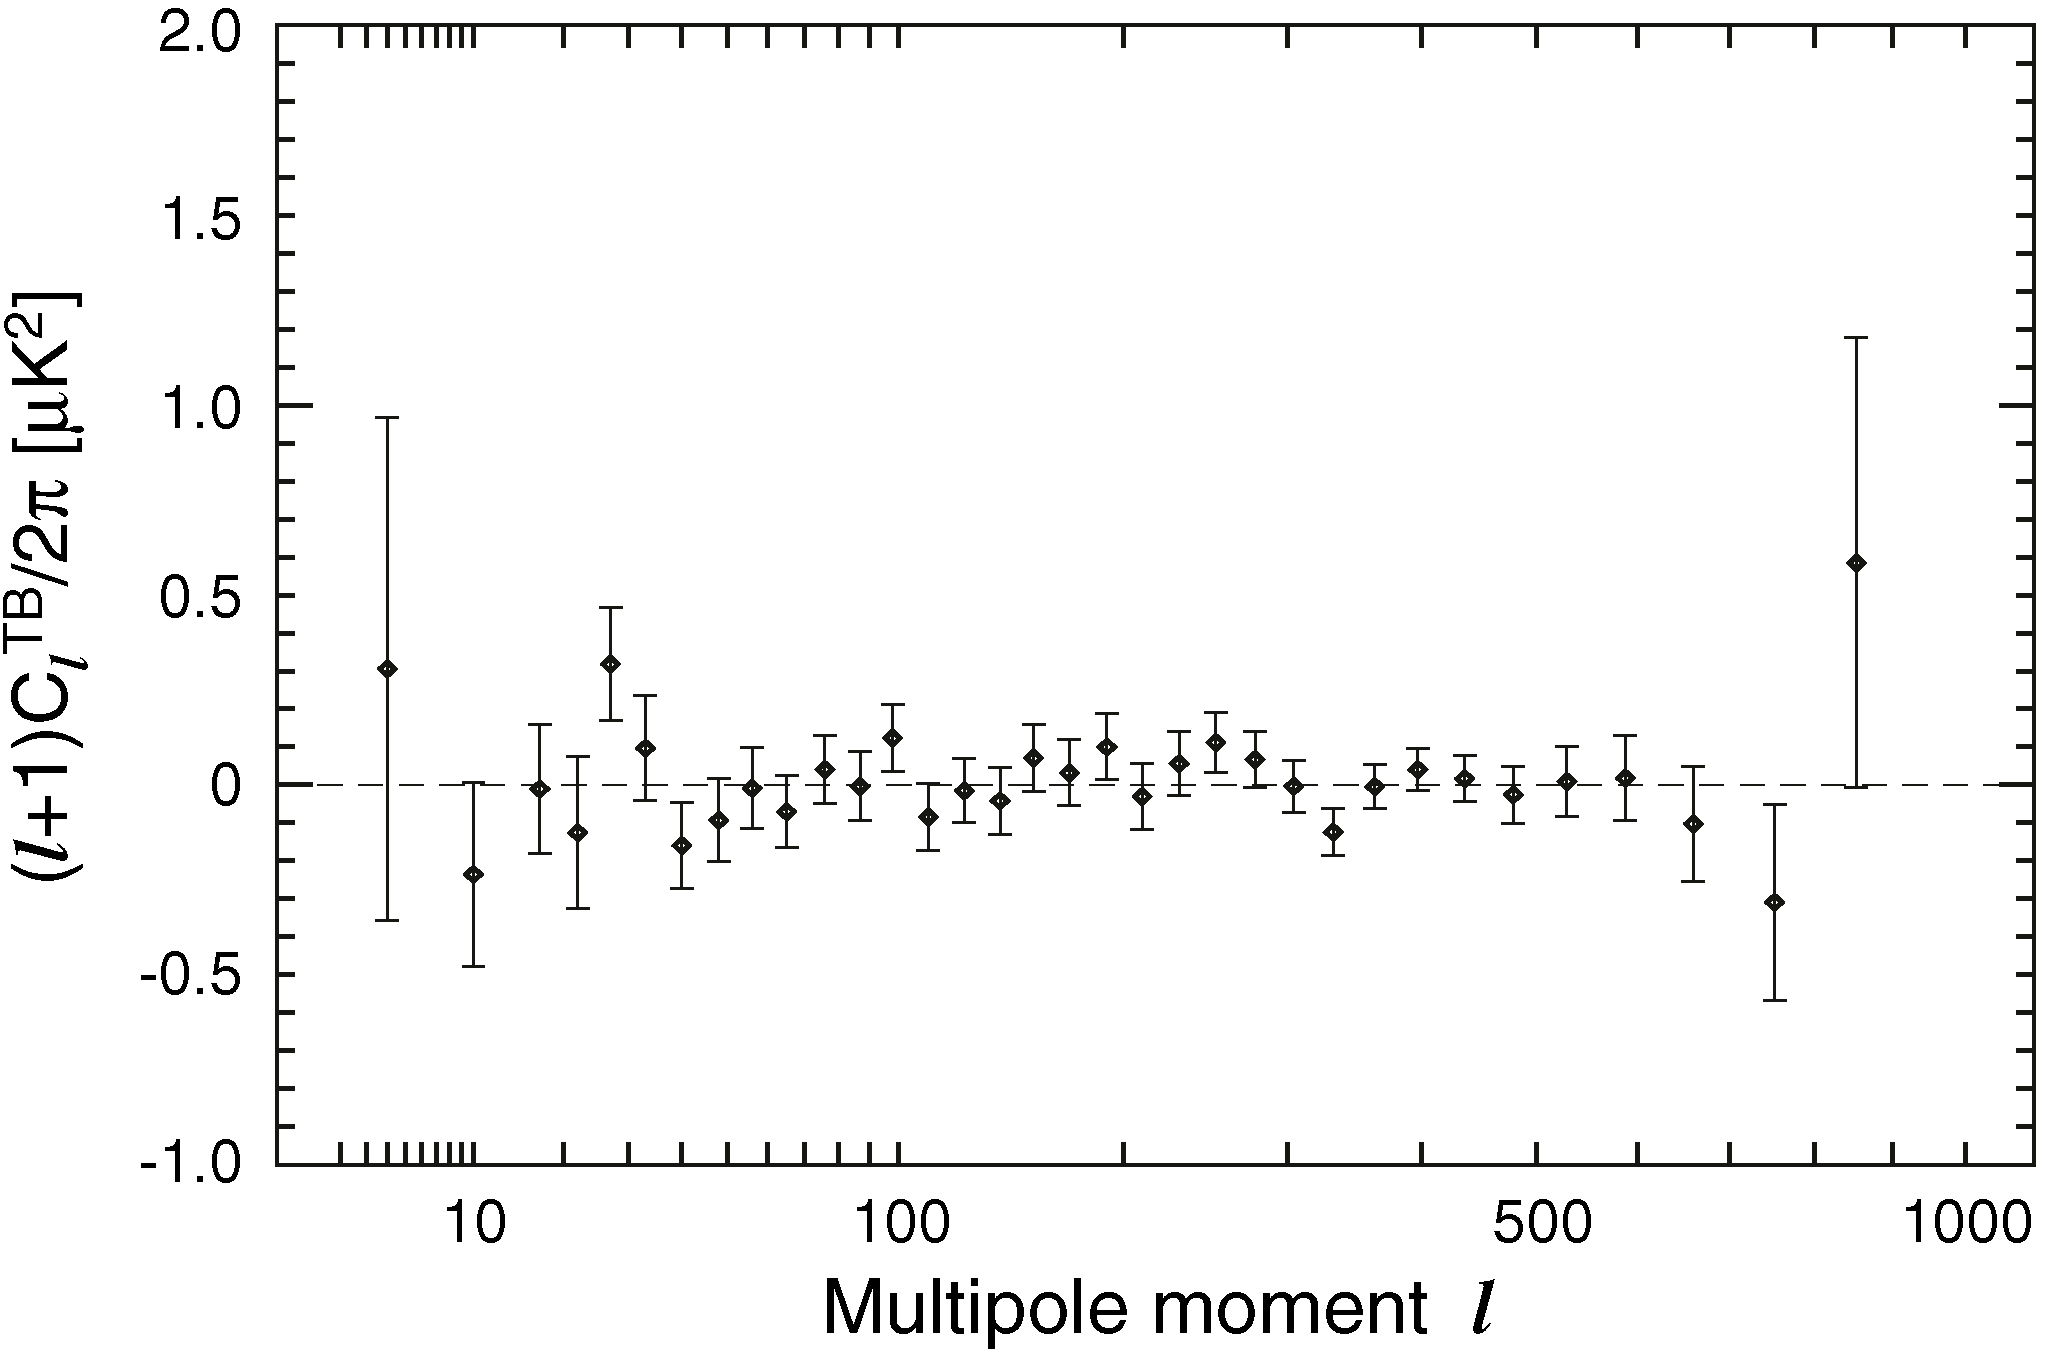
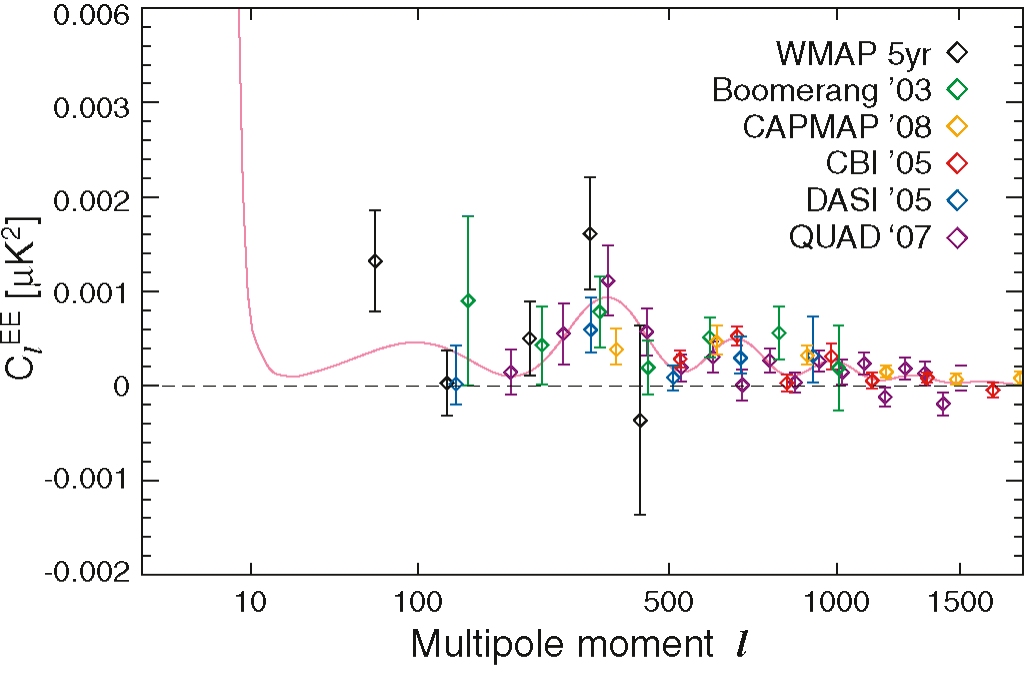
Angular Power Spectra
Five-Year Wilkinson Microwave Anisotropy Probe (WMAP) Observations: Angular Power Spectra, M. Nolta, et al., 2009ApJS..180..296N, reprint / preprint (408 KB) / bundled figures (108 KB) / individual figures / ADS / astro-ph
| ||||||||||||||||||||||||||||||||||||||||


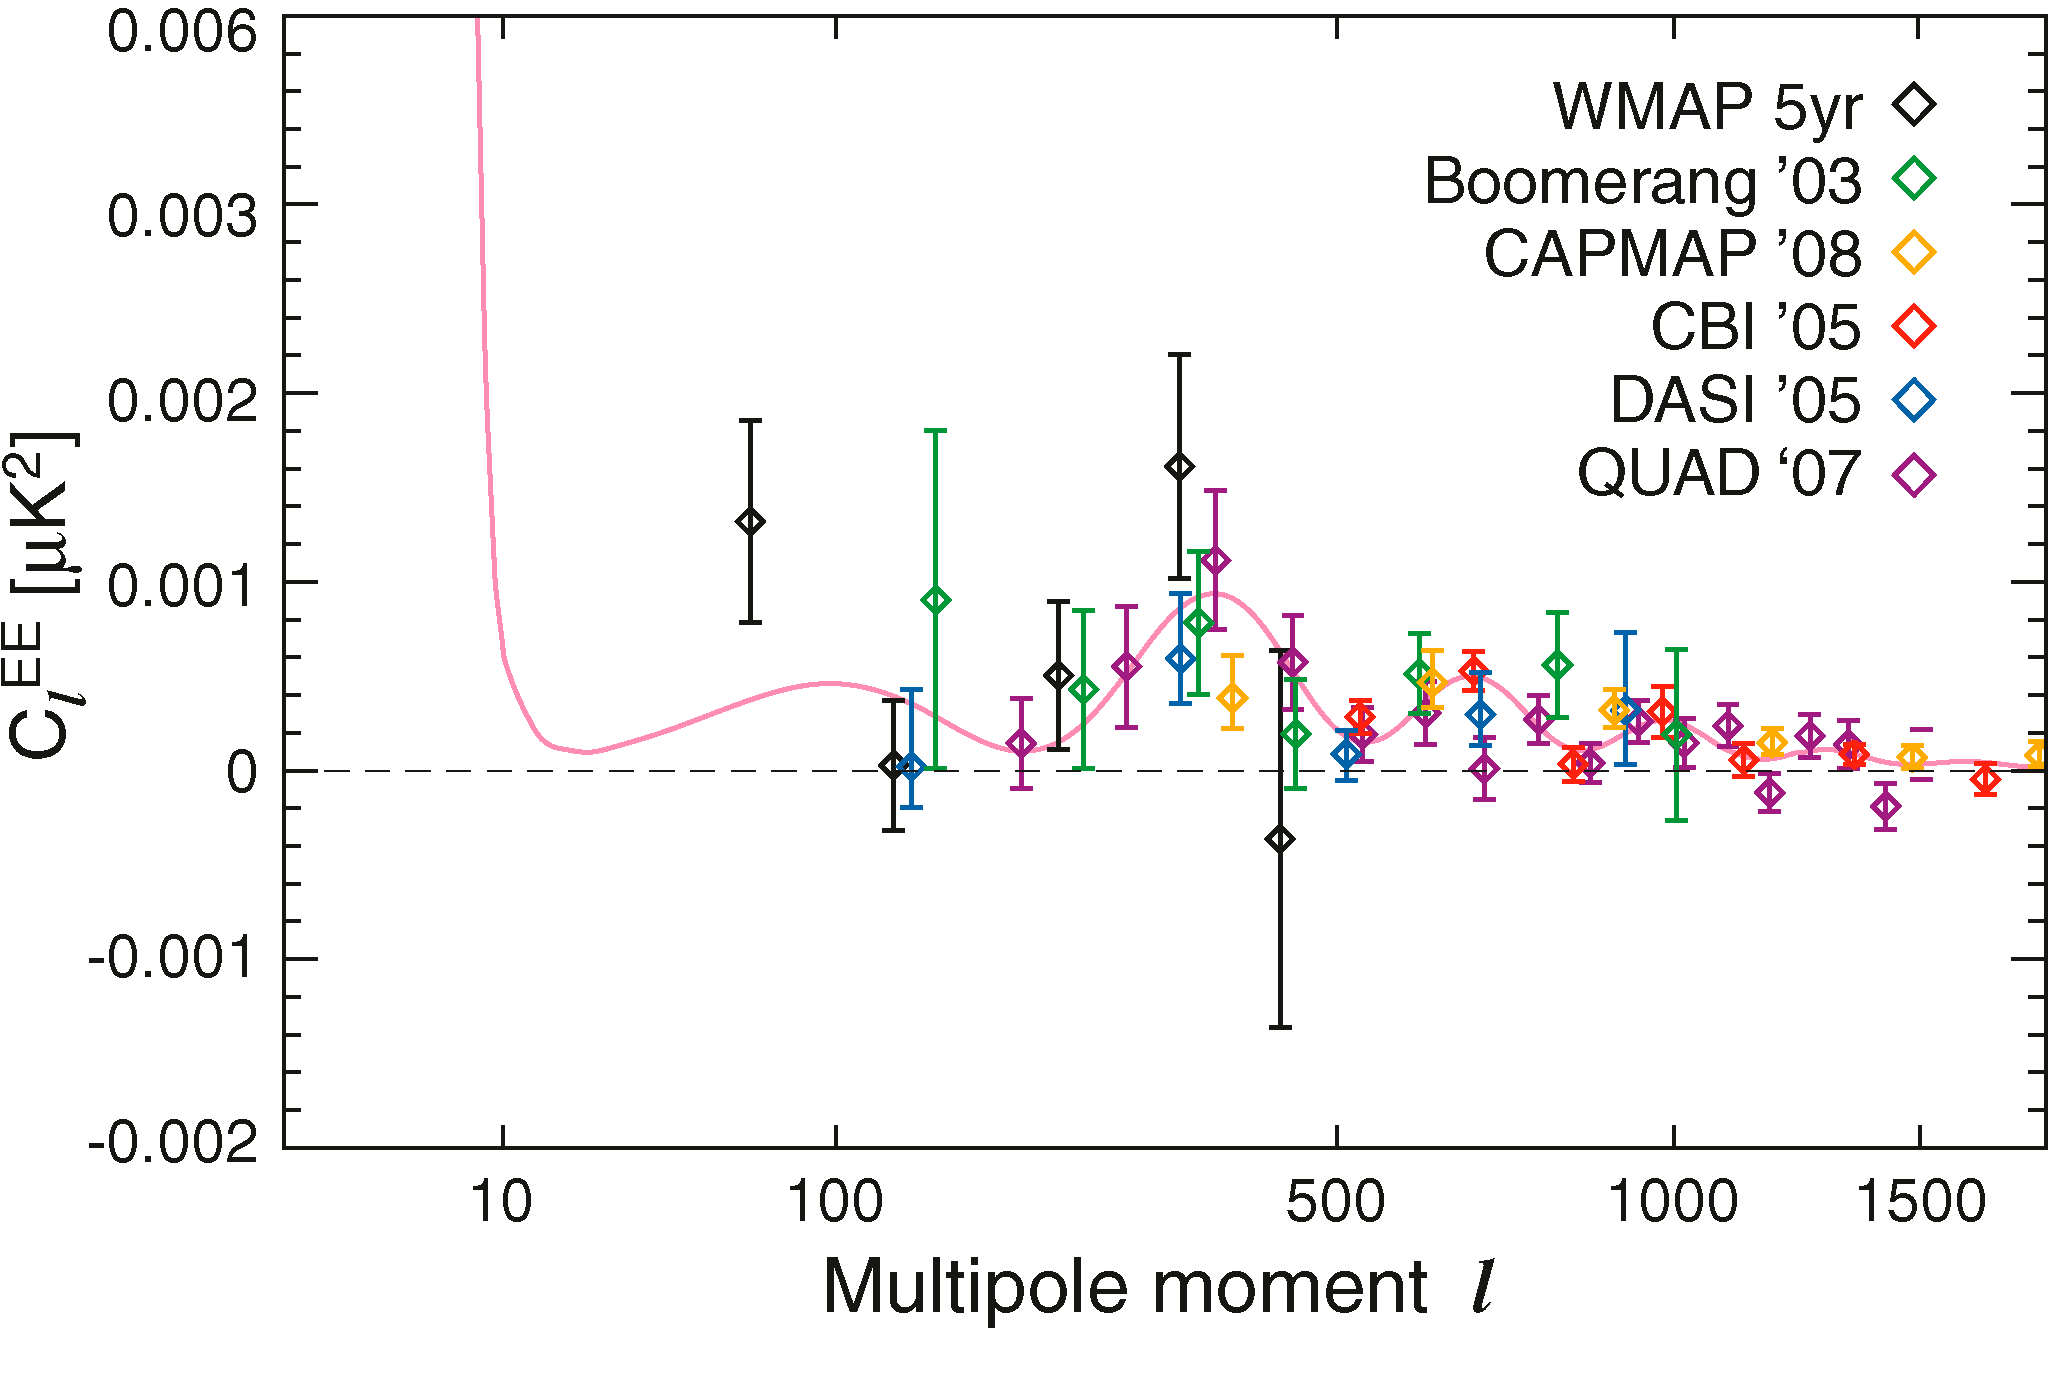
Angular Power Spectra
Five-Year Wilkinson Microwave Anisotropy Probe (WMAP) Observations: Angular Power Spectra, M. Nolta, et al., 2009ApJS..180..296N, reprint / preprint (408 KB) / bundled figures (108 KB) / individual figures / ADS / astro-ph
| ||||||||||||||||||||||||||||||||||||||||