Next: Dynamic range Up: Results Previous: Limiting magnitude of reference Contents
The ![]() best exposures from the same dataset on
best exposures from the same dataset on ![]() used in
Chapter 5.5.3 were separated into two groups of
used in
Chapter 5.5.3 were separated into two groups of
![]() . The exposures in these two groups were observed during two
separate time windows, so the atmospheric effects should be
uncorrelated for the two datasets. The exposures in each group were
shifted and added together to give two independent images of the field
in M13. I used the same approach to accurately measure the positions
of the stars in these two images as was used for measuring the
location of the brightest speckles in individual short exposures -
the two images were filtered using the modulation transfer function of
a diffraction-limited telescope (shown in Figure 5.6)
and resampled, and the peak pixel in the resulting stellar images was
taken as the position of each star. The relative star positions
calculated for the two independent datasets were compared and found to
agree within
. The exposures in these two groups were observed during two
separate time windows, so the atmospheric effects should be
uncorrelated for the two datasets. The exposures in each group were
shifted and added together to give two independent images of the field
in M13. I used the same approach to accurately measure the positions
of the stars in these two images as was used for measuring the
location of the brightest speckles in individual short exposures -
the two images were filtered using the modulation transfer function of
a diffraction-limited telescope (shown in Figure 5.6)
and resampled, and the peak pixel in the resulting stellar images was
taken as the position of each star. The relative star positions
calculated for the two independent datasets were compared and found to
agree within ![]()
![]() for eight of the brightest stars, without
accounting for changes in plate scale or orientation. The stellar
magnitudes agreed within
for eight of the brightest stars, without
accounting for changes in plate scale or orientation. The stellar
magnitudes agreed within ![]() . Clearly for astronomically useful
measurements the optical distortions in the instrument would need to
be accurately determined, and any shift in the stellar positions due
to limited charge transfer efficiency would also have to be
characterised. Given good instrument characterisation, the accuracy of
the astrometry and photometry would improve substantially with
increased observing time, potentially allowing accurate measurements
of globular cluster velocity dispersions and photometric variability
studies.
. Clearly for astronomically useful
measurements the optical distortions in the instrument would need to
be accurately determined, and any shift in the stellar positions due
to limited charge transfer efficiency would also have to be
characterised. Given good instrument characterisation, the accuracy of
the astrometry and photometry would improve substantially with
increased observing time, potentially allowing accurate measurements
of globular cluster velocity dispersions and photometric variability
studies.
Some of the Lucky Exposures images generated from data taken using L3Vision CCDs
were found to show evidence for smearing at low signal levels in the
direction of CCD serial transfers. The dependency of the smearing
effect on both the position in the image and on the signal level gave
weight to the hypothesis that problems with charge transfer efficiency
might be to blame. In order to investigate the smearing effect in more
detail I chose an image of M15 which was quite badly affected, taken
from our observing run in July 2002 through the ![]()
![]() HiRac I
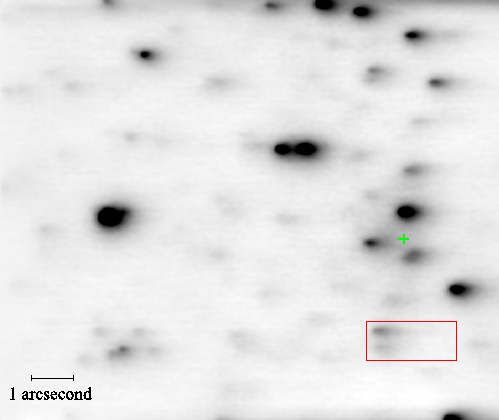
filter at the NOT. Figure 5.22 shows a region around the
core of M15. The cluster centre is marked by a green cross toward the
right-hand side (as determined by Guhathakurta et al. (1996)). The image
has been contrast stretched to highlight some of the fainter
stars. Most of the stars show some evidence of horizontal smearing,
particular the fainter stars toward the right-hand
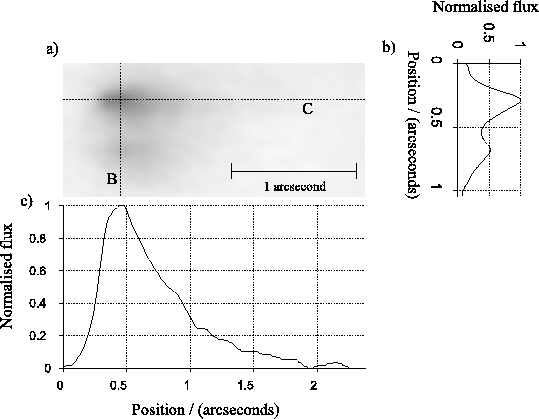
edge. Cross-sections through two stars toward the lower right-hand
corner of the image are shown in Figure 5.23. The
horizontal cross-section along line C shows a long tail to the right
of the stellar centroid, reminiscent of the charge distributions
measured in the laboratory under conditions of poor transfer
efficiency (one of these distributions was shown in
Figure 4.13).
HiRac I
filter at the NOT. Figure 5.22 shows a region around the
core of M15. The cluster centre is marked by a green cross toward the
right-hand side (as determined by Guhathakurta et al. (1996)). The image
has been contrast stretched to highlight some of the fainter
stars. Most of the stars show some evidence of horizontal smearing,
particular the fainter stars toward the right-hand
edge. Cross-sections through two stars toward the lower right-hand
corner of the image are shown in Figure 5.23. The
horizontal cross-section along line C shows a long tail to the right
of the stellar centroid, reminiscent of the charge distributions
measured in the laboratory under conditions of poor transfer
efficiency (one of these distributions was shown in
Figure 4.13).
 |
 |
Bob Tubbs 2003-11-14