

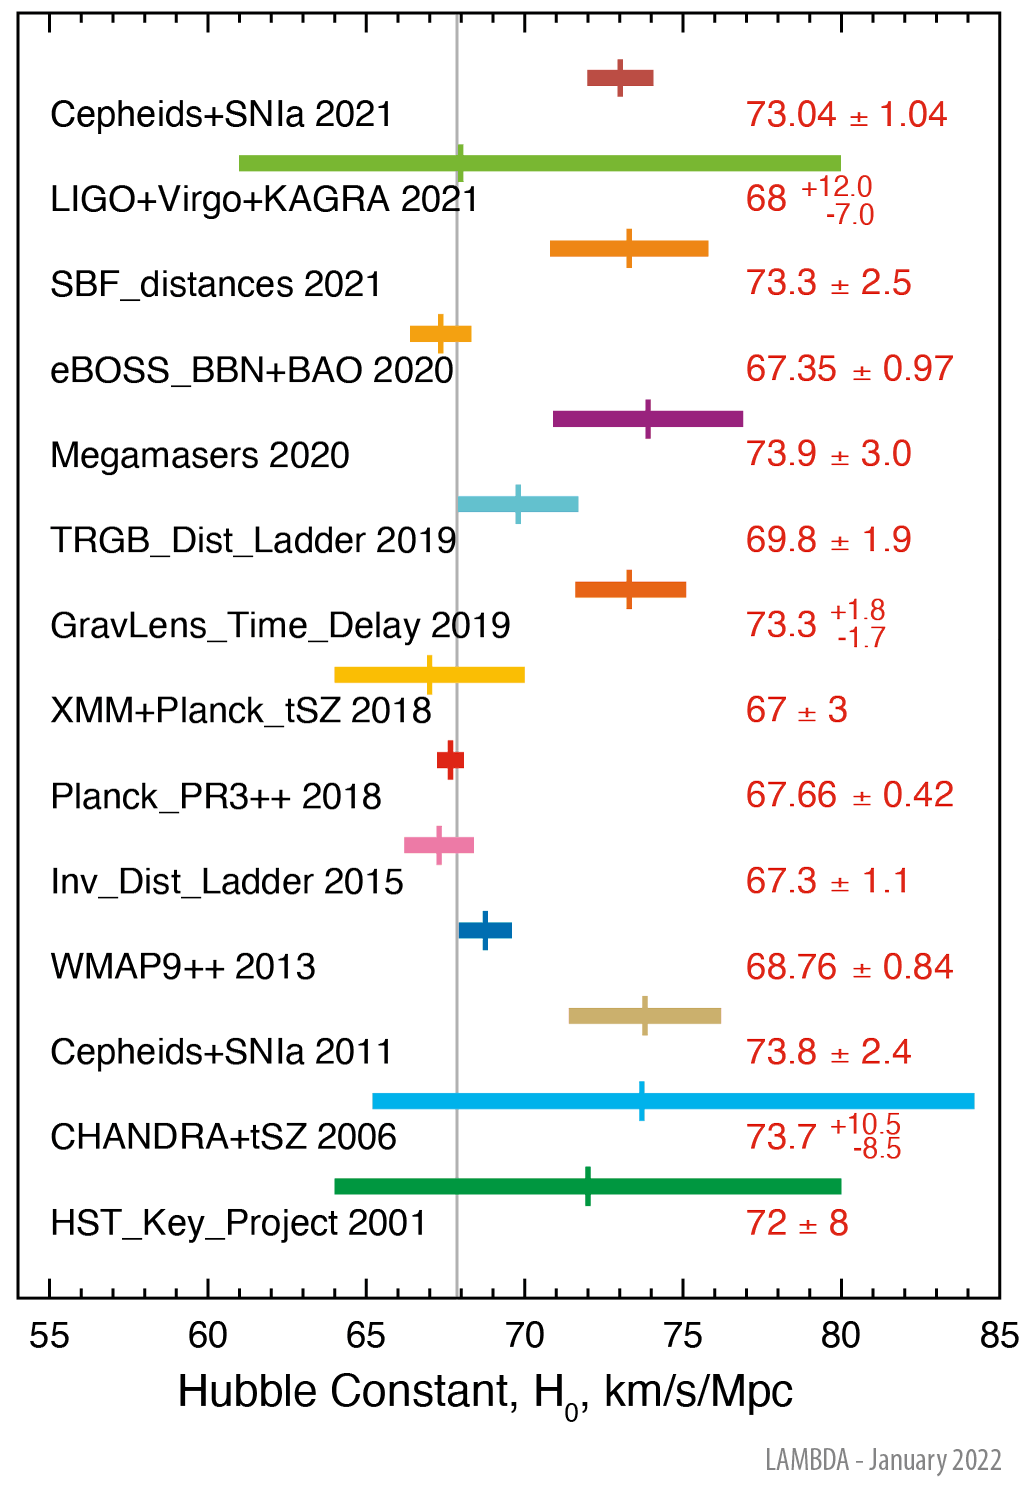
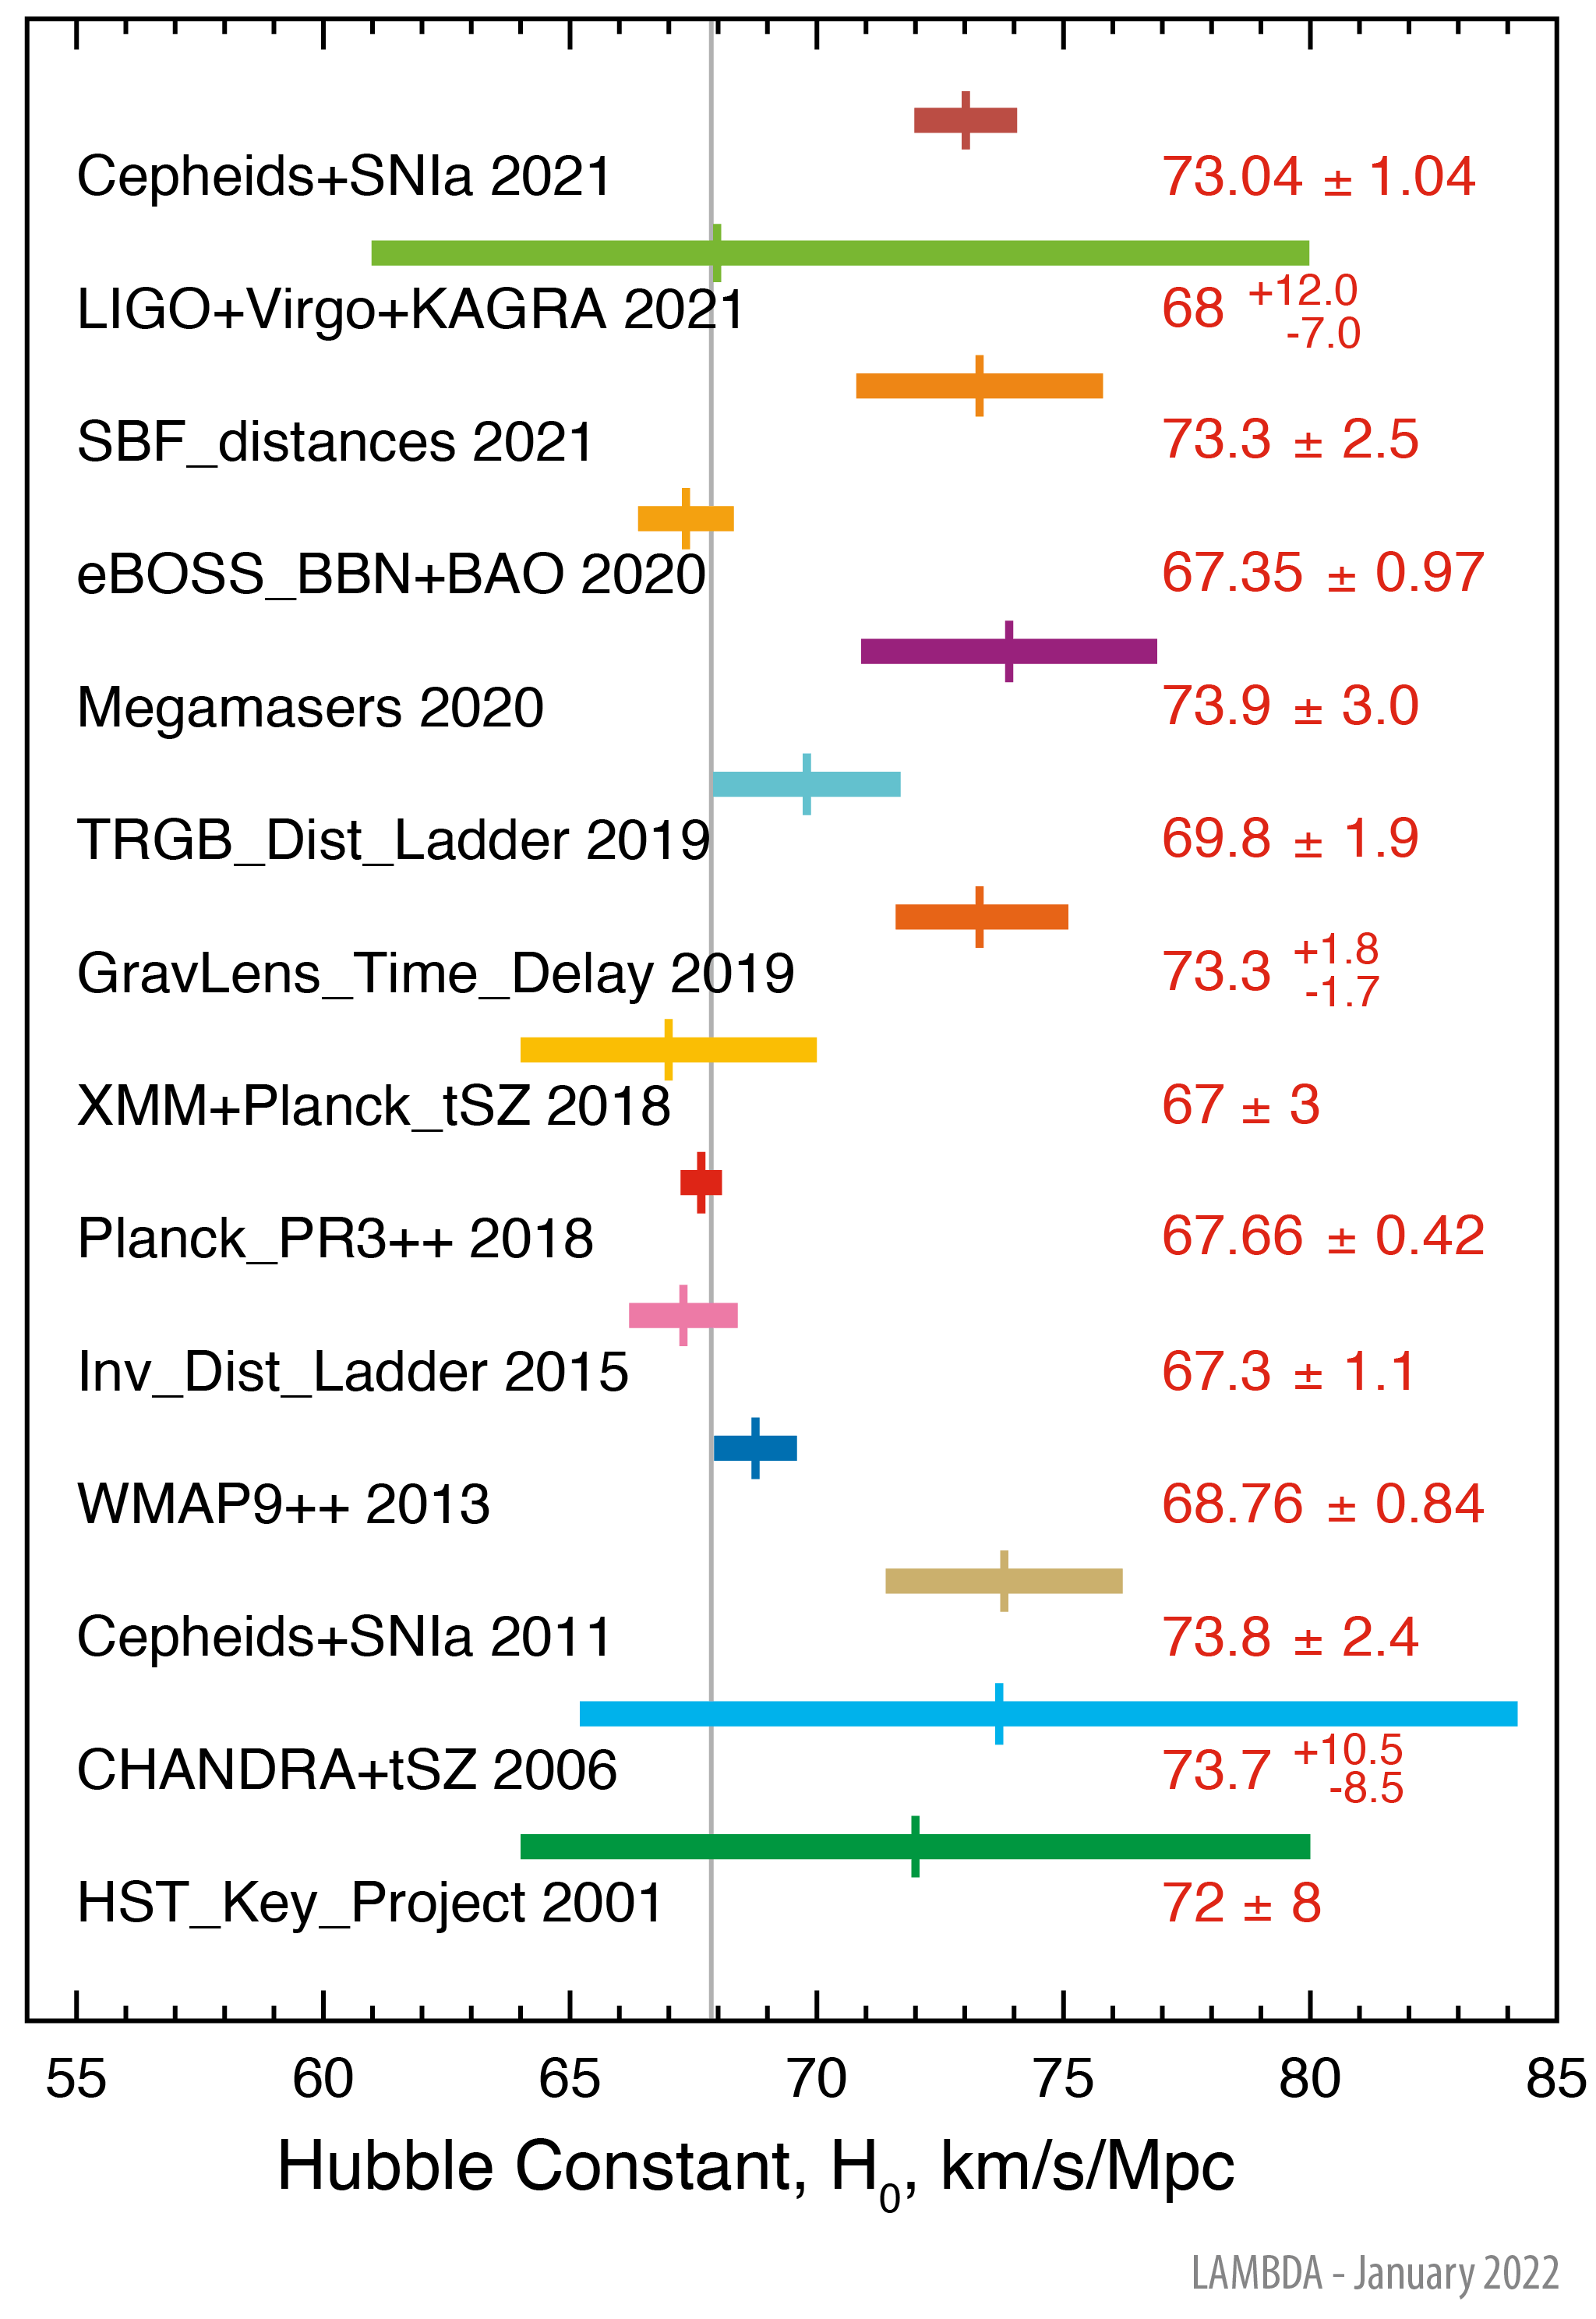
Hubble ConstantThe time-dependent expansion of spacetime is characterized in the FLRW equations as a function of redshift z by the Hubble parameter H(z). Under the assumption of ΛCDM, H(z) = H0 * sqrt(Ωm(1+z)3 + ΩΛ + Ωk(1+z)2) (e.g. Wei & Wu 2017, Chen, Kumar & Ratra 2017, Verde et al. 2014, Farooq & Ratra 2013). The present-day (z=0) value of the expansion is referred to as the Hubble constant, H0. There is a long history in the literature toward determination of an unbiased and accurate value of H0, dating from the 1920's with the observations of galaxies by Hubble. There are a number of reviews of this history; we cite for example Freedman & Madore (2010), and online websites such as this one at CFA. Current values in the literature hover near 70 km/s/Mpc. However, a concordance value with associated uncertainty 1% or less has yet to be reached, and recent literature has noted the moderate tension between values for H0 derived using a variety of methods. Both unaccounted-for uncertainties in the data and potential inadequacy of the standard ΛCDM model may explain the tensions. We illustrate the recent history of Hubble constant determinations with two separate plots. The first plot intercompares H0 values derived from a variety of methods. This plot is designed to provide an overview of methods and tensions discussed in the literature. Some measurements presented in this plot combine multiple datasets. The second plot compares determinations of H0 through the use of only CMB data. The first determinations of H0 involved measurements of distances and radial velocities associated with objects far enough away to not be bound gravitationally to our Local Group. Distances determined on cosmological scales rely on the 'distance ladder', which builds on the reliability of direct measurements close-by and the extension of those measurements outward through the use of standard candles such as Cepheid variables and Type Ia supernovae. We represent determinations of this type with four entries in the first plot: the HST Key Project (Freedman et al. 2001), Cepheids+SNIa (Riess et al. 2011), TRGB Dist Ladder (Freedman et al. 2019) and Cepheids+SNIa (Riess et al. 2021). For the 2021 Riess et al. entry, we plot the SH0ES result using Cepheids+SNIa only; when combined with independent TRGB measures they derive a value of 72.53 ± 0.99. Characterization of potential systematics affecting the distance determination is a key issue in this method. Another standard candle method, based on the correlation between turbulent emission lines velocity dispersion and their integrated luminosity, is employed by Fernández Arenas et al. (2018) to derive H0 from observations of H II galaxies and giant H II regions. They report an initial result of 71.0 ± 2.8(random) ± 2.1(systematic) km/s/Mpc. Recent advances in gravitational wave (GW) detection technology provide an analysis approach independent of the cosmic distance ladder. The first estimate of the Hubble constant using a GW source detection was a joint effort of the LIGO/Virgo teams (Abbott et al. 2017), combined with collaborative followup observations identifying the optical counterpart of the source. In this determination, the amplitude of gravitational waves resulting from the merger of a binary neutron star system are analyzed to determine the luminosity distance to the system, and a cosmological redshift obtained from optical identification of the source host galaxy. The most recent determination from the LIGO-Virgo-KAGRA Collaboration (2021) uses 47 gravitational wave sources from the Third LIGO-Virgo-KAGRA Gravitational Wave Transient Catalog, deriving a value of 68-7+12 km/s/Mpc. Future GW source detections should provide tighter constraints. In ΛCDM theory, a characteristic acoustic scale for the oscillating primordial photon and baryon plasma is established at the time of decoupling, when the plasma temperature has cooled sufficiently for recombination. Acoustic features are detected not only in CMB radiation power spectra, but also in the linear matter power spectra constructed from positional information of objects in large-scale structure surveys (Baryon Acoustic Oscillations, BAO, e.g., Eisenstein, Hu & Tegmark 1998). BAO data alone cannot be used to derive H0, but combinations of BAO with CMB, large-scale structure (LSS) clustering information or baryon density may be used for this purpose (e.g., Addison et al. 2013). A combination of this type, labeled 'BAO+D/H 2017' in the plot, is represented by the results of Addison et al. (2017), who used BAO constrained with a baryon density determined from deuterium abundance combined with BBN theory. Aubourg et al. (2015) used BAO + SNIa in combination with CMB sound horizon scale (an 'inverse distance ladder' technique) to infer H0 = 67.3 ±1.1 km/s/Mpc without the constraint of a flat ΛCDM cosmology. Strong gravitational lensing of a variable source, resulting in multiple lensed images, may be used to obtain H0 via the observed time delay for an intrinsic source brightness change to propagate between lensed images. The time delay function is proportional to H0-1, but also requires knowledge of the lens redshift and angular diameter distances involved, and has some dependence on the assumed cosmology. The technique presents challenges in observational precision and accuracy in modeling the lens mass distribution; for reviews, equations and error discussion see e.g. Schechter (2005), Freedman & Madore (2010), Suyu et al. (2010), Linder (2011) and Wilson et al. (2017). Although the basic theory was discussed as early as 1964 (Refsdal 1964), improvements in observational sensitivity and lens modeling have been a key to shrinking uncertainties. In the plot, we quote a recent result from the COSMOGRAIL project (H0LiCOW; Bonvin et al. 2017, Wong et al. 2019) based on observations of six systems and the assumption of ΛCDM. Observations of the thermal SZ effect (tSZ) have a number of cosmological applications (e.g. determination of matter distribution, see also Carlstrom et al. 2002, Birkinshaw & Hughes 1994). Determination of the Hubble constant independent of the cosmic distance ladder is one such application. Combined tSZ decrement and X-ray emission observations of a galaxy cluster enable direct determination of the angular diameter distance to that cluster, which along with its redshift allow H0 to be computed using an assumed cosmology. Distance determinations for a number of X-ray clusters and a range of spectroscopic redshifts provide reductions in statistical uncertainties (Reese et al. 2002, Carlstrom et al. 2002). Bonamente et al. (2006) used CHANDRA X-ray observations and interferometric tSZ data for 38 clusters to derive a value of H0 = 73.7-8.5+10.5; the quoted uncertainties are a quadrature sum of statistical and systematic uncertainties. Systematics are a dominant issue in this determination: subsequent analyses suggested larger absolute calibration uncertainties for the X-ray instrument (Reese et al. 2010), and uncertainties in the modeling of the cluster density and temperature profile can lead to systematic over- or under-estimates of H0 (Bonamente et al. 2012, Batistelli et al. 2016). A more recent application of this technique (Kozmanyan et al. 2019) uses newer data (Planck tSZ and XMM Newton X-ray observations) and an integrated treatment of systematic bias estimates to present a value of 67 ± 3. Finally, the value of the Hubble constant may be determined indirectly from CMB data through the use of the ΛCDM model itself (the equation in the first paragraph shows the main parameter dependencies). In addition to maps of temperature and polarization CMB anisotropies, CMB observations on small angular scales provide additional model constraints through the effect of weak gravitational lensing of the CMB. In the first summary plot, WMAP and Planck data have been combined with data from other sources, including BAO data (see data references), which reduces the quoted uncertainty. In the CMB-only plot, we illustrate uncertainties obtained without combining with other datasets, and a wider range of determinations, including suborbital measurements from ACTPol (Louis et al. 2017) and SPTpol (Henning et al. 2017). Because of smaller sky coverage, suborbital surveys lack large angular scale information and must assume a prior for the optical depth to reionization, τ.  Image Credit: NASA / LAMBDA Archive Team The Hubble Constant H0 characterizes the present-day expansion rate of the universe. Its value may be determined using a variety of methods. The figure includes results from distance ladder determinations (labeled HST Key Project, Cepheids+SNIa (2011 and 2021), TRGB Dist Ladder), indirect CMB measurements (WMAP9++, Planck_PR3++, both of which combine CMB with other data), BAO in combination with baryon abundance (BAO+D/H), the thermal SZ effect (CHANDRA+tSZ, XMM+Planck tsZ), strong gravitational lensing (Gravlens Time Delay) and gravitational waves (LIGO+Virgo+KAGRA). More detailed descriptions of these methods are given in the text. Uncertainties in the gravitational wave method are expected to decrease as the method matures. A tightly constrained value for H0 with agreement across multiple methods has yet to be achieved. The gray vertical line, representing the weighted average of WMAP and Planck data points, is positioned at 67.88 km/sec/Mpc.
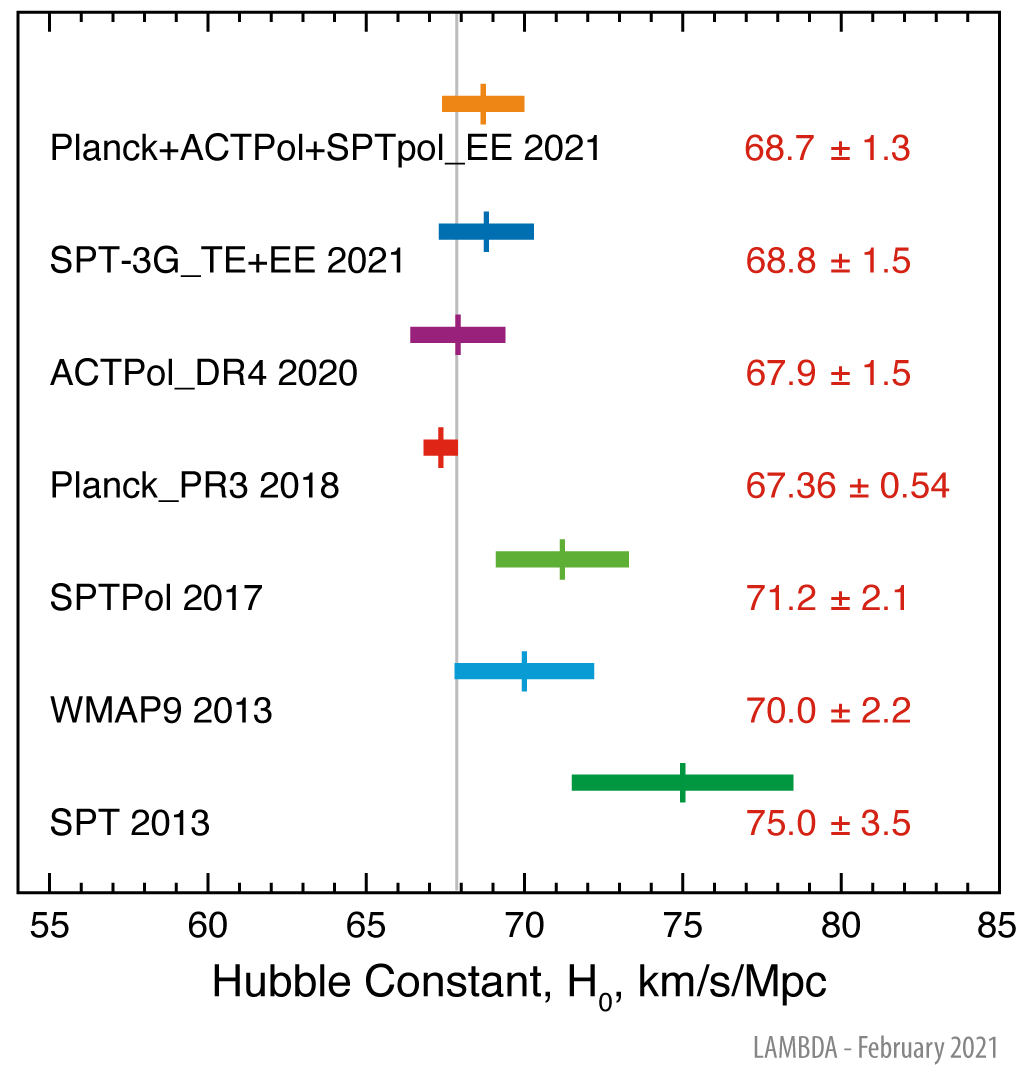
 Image Credit: NASA / LAMBDA Archive Team The value of H0 may be inferred from fits of the ΛCDM model to observations of the Cosmic Microwave Background (CMB). Because the CMB data represent a snapshot of the universe at high redshift, this method relies on the model to compute the Hubble parameter at z=0 and is not a direct measurement of H0. How well low redshift direct measurements agree with model predictions based on fits to high redshift data serves as a test of the standard ΛCDM model. This figure illustrates recent H0 determinations using only CMB data, uncombined with lower redshift measurements. Values with the smallest quoted uncertainties are those from the Planck mission, which also show the most disagreement with the 2021 local distance ladder determination shown in the preceding plot. The difference is an interesting topic requiring more study. The gray vertical line at 67.88 km/sec/Mpc is taken from the first figure and shown as a fiducial guide.
Contributed by the NASA / LAMBDA Archive Team. |
