

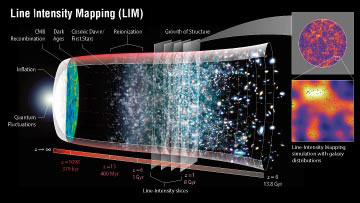
Line Intensity MappingAtoms and molecules that comprise the gas in the universe can undergo energy state transitions that produce radiation emitted at well defined, discrete spectral frequencies. These spectral emission lines can be used to trace physical conditions along the observed line-of-sight (LOS), and also map the distribution of the gas with redshift. Low spatial resolution observations of LOS integrated line emission at different frequencies are referred to as "intensity mapping" (IM) or equivalently "line intensity mapping" (LIM). The concept is similar to galaxy surveys for Large Scale Structure (LSS) studies, but does not resolve individual sources and thus is able to survey larger areas of sky more quickly. Results from line intensity mapping are also expected to provide insight into the cosmological epoch of reionization. The method is in the early stages of development both observationally and analytically; removal of contaminating foreground emission is expected to be a key analysis factor. Since receivers are designed for a specific range of frequencies, current and upcoming LIM experiments each target specific lines: no one experiment targets all possible lines. Potential targets include 21 cm neutral hydrogen, molecular CO, and cooling lines such as [CII]. A list of known experiments and their status is provided in the Line Intensity Mapping Experiments table.  Image Credit: NASA / LAMBDA Archive Team LIM measures the integrated sky emission from a specific atomic or molecular line transition at different redshifts, in effect taking 'snapshots' in time that show the evolution of these tracers of luminous gas and dust in the universe. As the Era of Reionization begins, the first stars to form heat their nearby surroundings, forming bubbles of ionized gas embedded within a largely neutral medium. As dark matter halos continue to condense, the star formation rate increases and the regions of neutral gas shrink until reionization is complete. Structure continues to grow and merge under the influence of gravity, forming a vast cosmic web of dark matter density. The abundance of luminous galaxies traces the statistics of the underlying matter density. The cosmic star formation rate continues to increase until peaking near redshift z ~ 2, and then starts to decline to present day levels. A slice through the cosmic volume shown here near z~1 simulates a false color image of the line emission captured by the lower resolution LIM observations at a fixed redshift, and superposes the positions of the galaxies (small dots) associated with that emission. The appearance of the LIM image will evolve as one looks back in time (increasing z), and analysis of those changes will provide a more detailed reconstruction of ionization history, star formation rates, and growth of structure, beyond the very general picture discussed here. Use of multiple line tracers enhances the picture of physical conditions and allows for consistency checks.
Contributed by the NASA / LAMBDA Archive Team. |
