

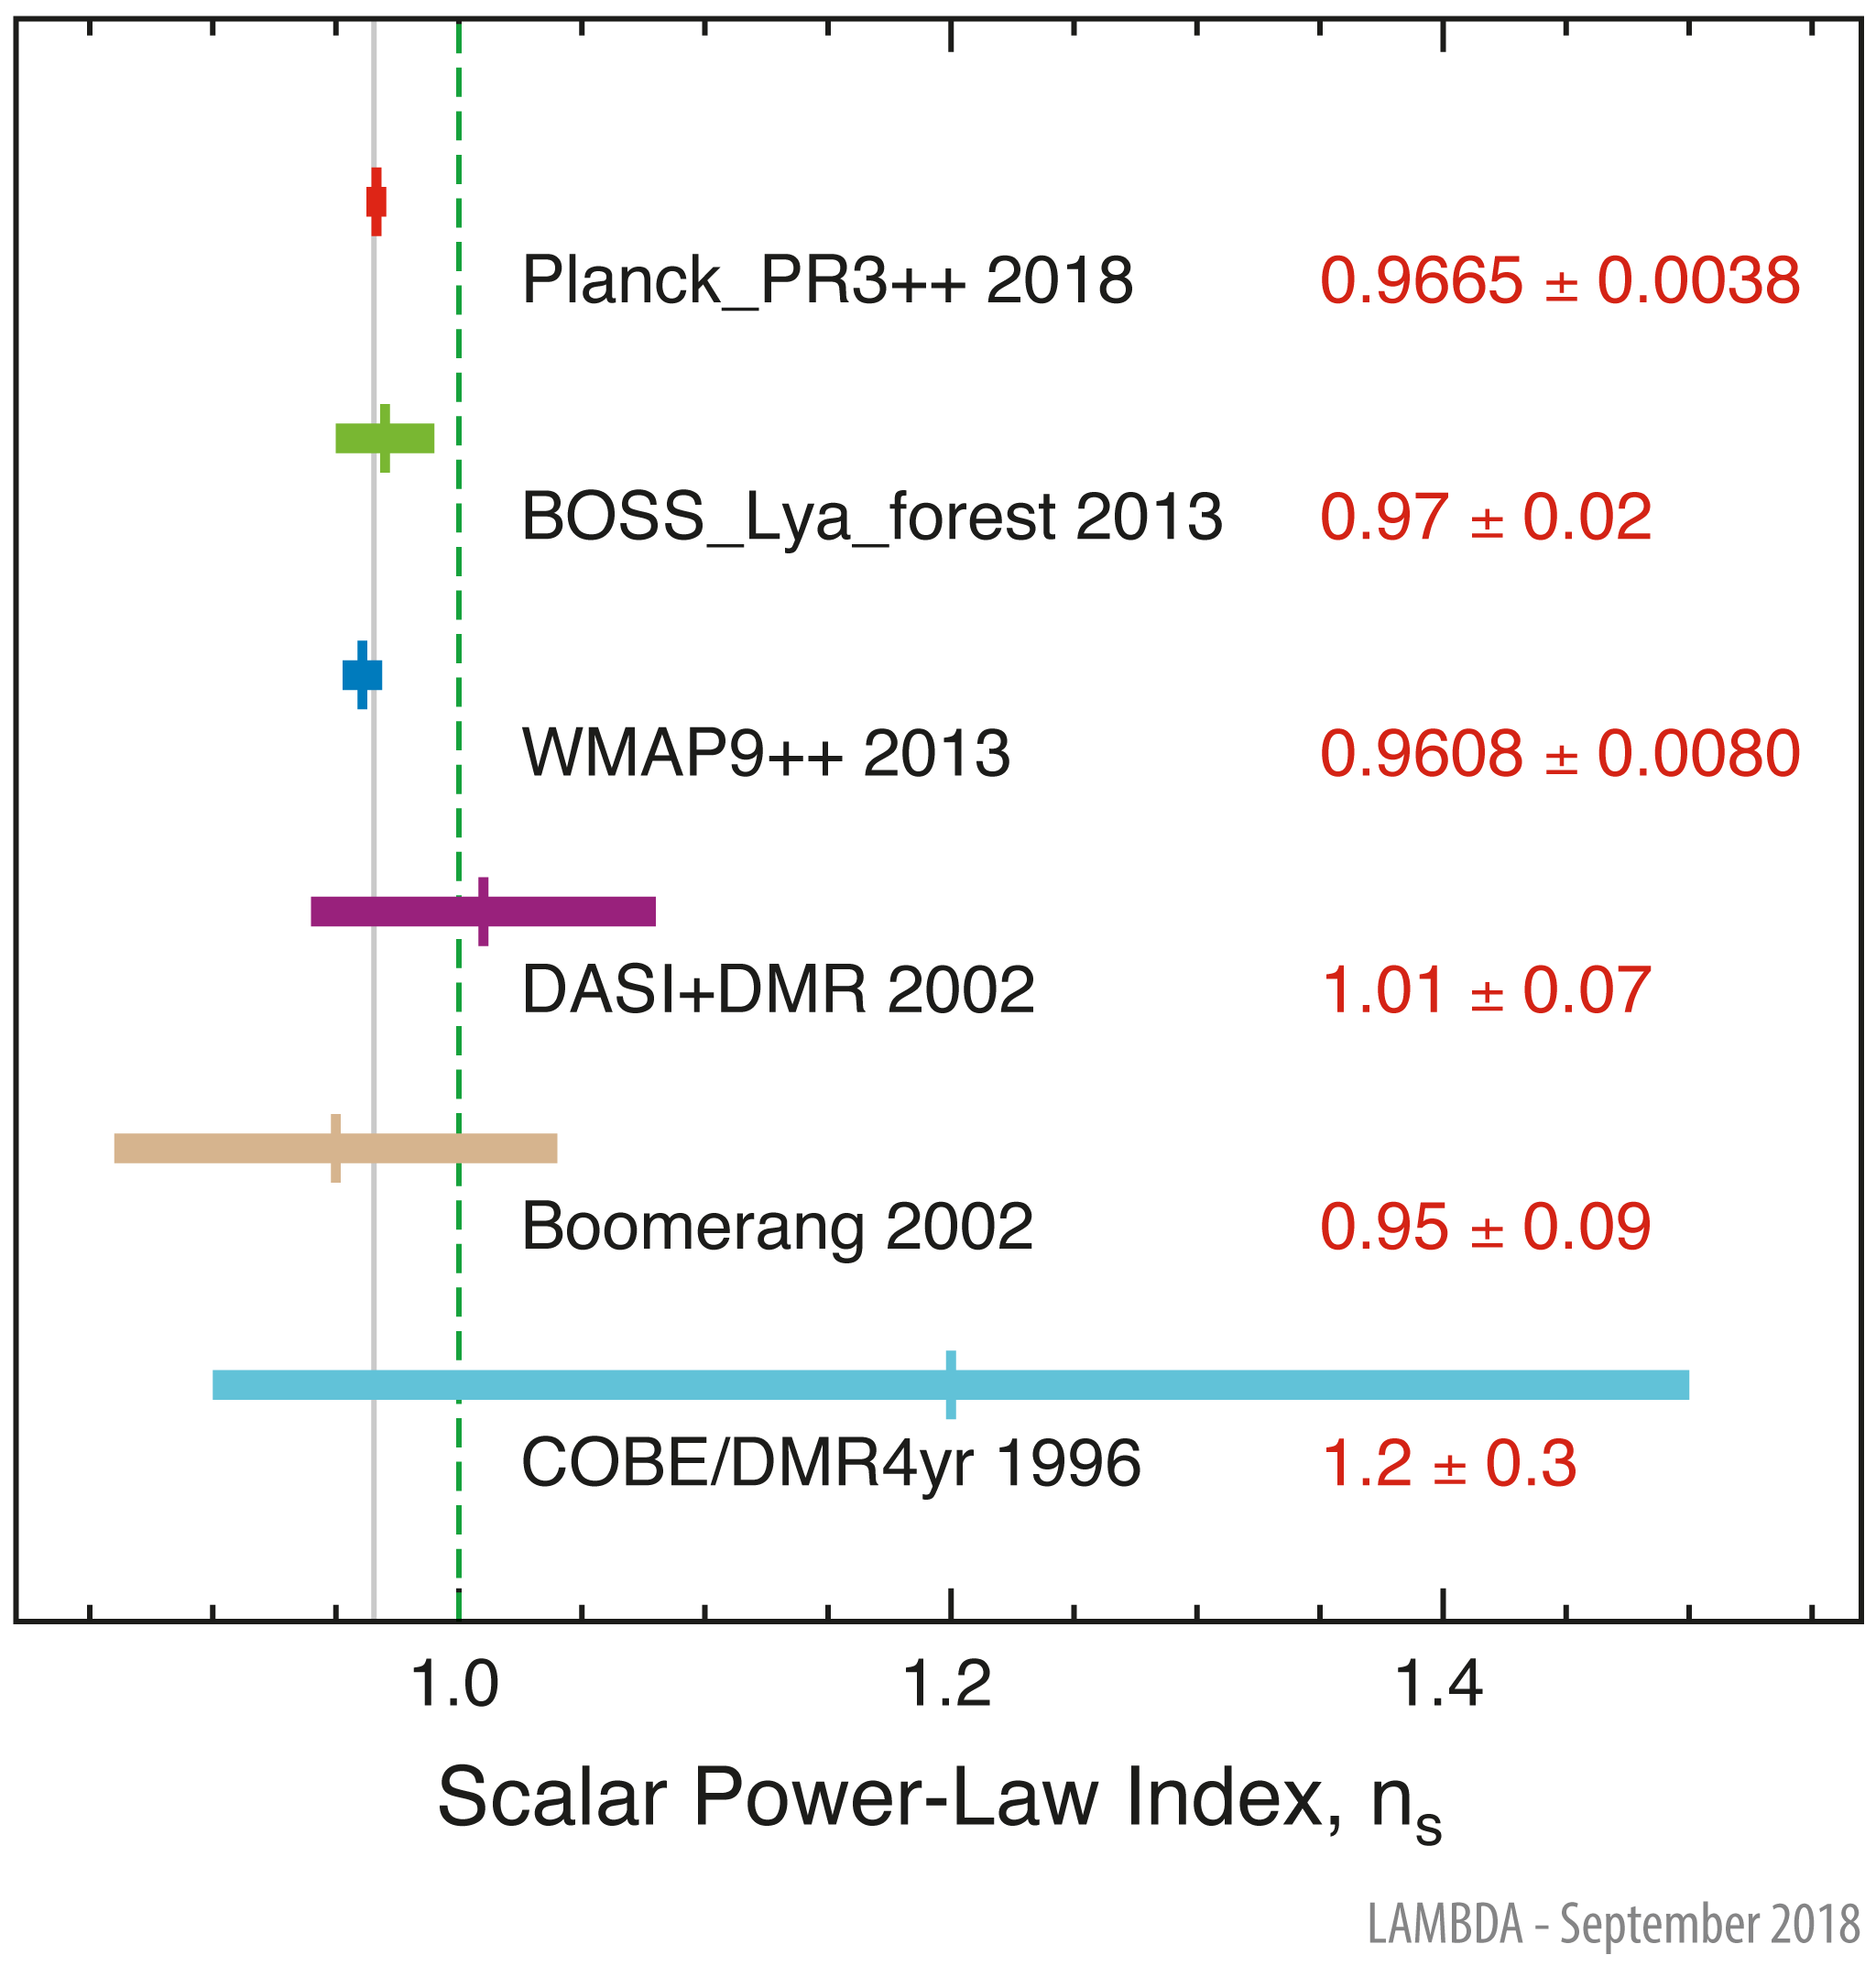
Scalar Power-Law Index, nsΛCDM characterizes the power spectrum of the primordial scalar perturbations as a power law, ∝ kns-1 (e.g., Peiris et al. 2003). Scale invariance is indicated when the scalar index ns is identically one, e.g., the power in the primordial gravitational potential fluctuations is the same over all physical scales. In ΛCDM, field fluctuations are the root cause of the observed CMB anisotropies, and thus ns is a critical parameter for characterizing the strength of the CMB anisotropies on all angular scales. The power-law index has been observed to be approximatey scale invariant for some time, but the associated uncertainties have been sufficiently large to accomodate a variety of model scenarios. In general, inflation predicts values slightly less than 1: this is a consequence of a slowly varying inflationary potential and horizon size over the period of inflation (Kinney 2003, Tsujikawa 2003, Baumann 2009). Early CMB analyses of temperature-only data contended with parameter degeneracy existing between ns and the optical depth to reionization, τ (Spergel et al. 2007). This degeneracy is broken with the addition of polarization measurements such as those obtained by WMAP and Planck. Recent determinations from these missions, shown in the figure below, obtain values for ns near 0.96-0.97, with uncertainties which indicate a signficantly detected difference from scale invariance (indicated by the dashed vertical fiducial line at ns = 1). This supports inflationary scenarios. The 2013 BOSS Lyα forest analysis result supports the CMB analyses, but this method is not yet at the stage where it has the statistical power to exclude scale invariance.  Image Credit: NASA / LAMBDA Archive Team In ΛCDM, the temperature and matter anisotropies we observe today in the cosmic microwave background and large-scale structure are thought to be seeded by primordial scalar perturbations in the field driving inflation. How closely these perturbations follow scale invariance (dashed vertical line at ns=1) has been a subject of interest for some time. Recent determinations by Planck and WMAP have firmly established ns<1, supportive of inflation scenarios, which generally predict values slightly less than 1. The gray vertical line, representing the weighted average of WMAP and Planck data points, is positioned at ns = 0.9655.
Contributed by the NASA / LAMBDA Archive Team. |
