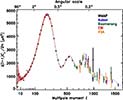
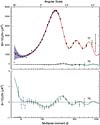
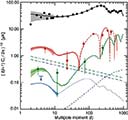
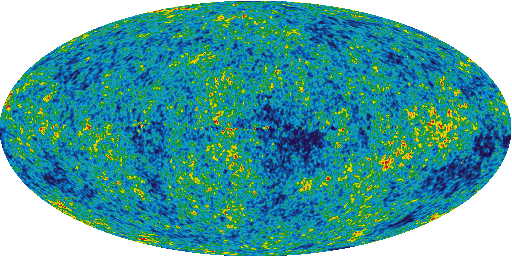
WMAP Data Product Images

The data made available through this page has been updated. The most recent version of this data may be accessed through https://lambda.gsfc.nasa.gov/product/wmap/current/

WMAP Three-year Paper Figures
Figures from the Three-Year WMAP) papers in a form suitable for use in talks.

Image Credit: NASA / LAMBDA Archive Team

Jarosik et al.,
Three-Year Wilkinson Microwave Anisotropy Probe (WMAP) Observations: Beam Profiles, Data Processing, Radiometer Characterization and Systematic Error Limits.
(images)
Hinshaw et al.,
Three-Year Wilkinson Microwave Anisotropy Probe (WMAP) Observations: Temperature Results.
(images)
Page et al.,
Three-Year Wilkinson Microwave Anisotropy Probe (WMAP) Observations: Polarization Analysis.
(images)
Spergel et al.,
Three-Year Wilkinson Microwave Anisotropy Probe (WMAP) Observations: Implications for Cosmology.
(images)
Kogut et al.,
Figures from the paper "Three-Year Wilkinson Microwave Anisotropy Probe (WMAP) Observations: Foreground Polarization
(images)

Back to top

WMAP Full-sky Temperature Maps
The images below represent full-sky maps of the cosmic microwave background anisotropy and foreground signal from our galaxy (in red). The 5 frequency maps are constructed from the differential time-ordered observations of the ten WMAP differencing assemblies. Galactic foreground is stongest in K band, weakest in V and W bands.

Image Credit: NASA / LAMBDA Archive Team

K-Band K-Band Map (23 GHz)
Linear scale from -200 to 200 uK
PNG (60kb - 300x512 pixels)
PNG (219kb - 562x1024 pixels)
PNG (737kb - 1024x2048 pixels)
Ka-Band Ka-Band Map (33 GHz)
Linear scale from -200 to 200 uK
PNG (85kb - 300x512 pixels)
PNG (321kb - 562x1024 pixels)
PNG (1mb - 1024x2048 pixels)
Q-Band Q-Band Map (41 GHz)
Linear scale from -200 to 200 uK
PNG (92kb - 300x512 pixels)
PNG (351kb - 562x1024 pixels)
PNG (1.1mb - 1024x2048 pixels)
V-Band V-Band Map (61 GHz)
Linear scale from -200 to 200 uK
PNG (98kb - 300x512 pixels)
PNG (376kb - 562x1024 pixels)
PNG (1.2mb - 1024x2048 pixels)
W-Band W-Band Map (94 GHz)
Linear scale from -200 to 200 uK
PNG (98kb - 300x512 pixels)
PNG (376kb - 562x1024 pixels)
PNG (1.2mb - 1024x2048 pixels)

Back to top

WMAP Full-sky Polarization Maps
Maps of observed polarization intensity ( P = sqrt(Q^2 + U^2) ) and direction (gamma = 0.5*arctan(U/Q)) for the five WMAP frequency bands. Color is used to specify the magnitude of P and arrows indicate direction. The length of the arrow is logarithmically dependent on the magnitude of P. The maps are smoothed to 2 degrees. The dominant polarization signal is Galactic in origin. See Page etal (2006) for further details.

Image Credit: NASA / LAMBDA Archive Team

W-Band K-Band Map (23 GHz)
Linear scale from 0 to 50 uK.
PNG (243kb - 288x513 pixels)
PNG (760kb - 559x1025 pixels)
PNG (2.2mb - 1104x2050 pixels)
W-Band Ka-Band Map (33 GHz)
Linear scale from 0 to 50 uK.
PNG (229kb - 288x512 pixels)
PNG (681kb - 559x1025 pixels)
PNG (1.9mb - 1104x2050 pixels)
W-Band Q-Band Map (41 GHz)
Linear scale from 0 to 50 uK
PNG (215kb - 288x512 pixels)
PNG (626kb - 559x1025 pixels)
PNG (1.8mb - 1104x2050 pixels)
W-Band V-Band Map (61 GHz)
Linear scale from 0 to 50 uK.
PNG (202kb - 287x512 pixels)
PNG (589kb - 559x1025 pixels)
PNG (1.7mb - 1104x2050 pixels)
W-Band W-Band Map (94 GHz)
Linear scale from 0 to 50 uK.
PNG (218kb - 287x512 pixels)
PNG (654kb - 559x1024 pixels)
PNG (1.9mb - 1104x2050 pixels)

Back to top

WMAP Stokes Q and U Maps
Stokes Q and U maps constructed from WMAP Three-year K and Ka band observations, smoothed to 1 degree. The Galactic plane is dominated by positive Stokes Q because the foreground polarization direction is perpendicular to the plane. For comparison, the Stokes Q and U maps of a noiseless CMB simulation have peak-to-peak values of less than 6 uK.

Image Credit: NASA / LAMBDA Archive Team

W-Band K and Ka band maps of Stokes Q and U

PNG (230kb - 346x510 pixels)
PNG (900kb - 692x1021 pixels)
PNG (3.3mb - 1383x2041 pixels)

Back to top

WMAP CMB Power Spectra
Temperature and polarization power spectra derived from the WMAP Three-year data. Data are represented as points, curves correspond to the best-fit LCDM model, and shaded regions delineate cosmic variance about the model.

Image Credit: NASA / LAMBDA Archive Team

W-Band WMAP Three-year Power Spectrum
See Fig. 16 of Hinshaw et al. (2006)
PNG (10kb - 359x507 pixels)
PNG (22kb - 715x1008 pixels)
PNG (117kb - 1429x2016 pixels)
PDF (49kb)
W-Band WMAP Three-year Power Spectrum
compared to recent measurements
of Boomerang, CBI, VSA and Acbar.
See Fig. 18 of Hinshaw et al. (2006)
PNG (13kb - 419x514 pixels)
PNG (29kb - 828x1031 pixels)
PNG (132kb - 1661x2039 pixels)
PDF (75kb)
Power Spectra TT and TE Power Spectra
See Fig. 22 of Hinshaw et al. (2006)
PNG (12kb - 414x515 pixels)
PNG (27kb - 828x1031 pixels)
PNG (137kb - 1639x2040 pixels)
PDF (68kb)
W-Band TT, TE, EE for best fit model
black=TT, red=TE, green=EE
See Fig. 25 of Page et al. (2006)
PNG (15kb - 503x471 pixels)
PNG (34kb - 950x1014 pixels)
PNG (182kb - 1899x2027 pixels)
PDF (67kb)

Back to top

WMAP Internal Linear Combination Map
The Internal Linear Combination Map is a weighted linear combination of the five WMAP frequency maps. The weights are computed using criteria which minimize the Galactic foreground contribution to the sky signal. The resultant map provides a low-contamination image of the CMB anisotropy.

Image Credit: NASA / LAMBDA Archive Team

W-Band Internal Linear Combination Map
Galactic coordinates,
Mollweide projection
Linear scale from -200 to 200 uK
PNG (97kb - 256x512 pixels)
PNG (381kb - 512x1024 pixels)
PNG (1.4mb - 1024x2048 pixels)
W-Band Internal Linear Combination Map
Ecliptic coordinates,
Lambert Azimuthal Equal Area projection
Linear scale from -200 to 200 uK
PNG (98kb - 256x512 pixels)
PNG (383kb - 512x1024 pixels)
PNG (1.4mb - 1024x2048 pixels)

Back to top

WMAP Foreground Model Maps, individual components
The synchrotron, free-free and thermal dust foreground models derived from WMAP data using the Maximum Entropy Method (MEM) are shown at the frequencies where each foreground is most dominant.

Image Credit: NASA / LAMBDA Archive Team

Synchrotron map for K band Synchrotron map for K band
Linear scale from -1 to 5 mK
PNG (52kb - 256x512 pixels)
PNG (155kb - 512x1024 pixels)
PNG (485kb - 1024x2048 pixels)
Free Free map for K band Free-free map for K band
Linear scale from -1.0 to 4.7 mK
PNG (36kb - 256x512 pixels)
PNG (109kb - 512x1024 pixels)
PNG (333kb - 1024x2048 pixels)
Dust map for K band Dust map for W band
Linear scale from -0.5 to 2.3 mK
PNG (33kb - 256x512 pixels)
PNG (155kb - 512x1024 pixels)
PNG (485kb - 1024x2048 pixels)

Back to top

WMAP Foreground Model Maps, 3-color images
Three-color maps from the Maximum Entropy Method (MEM) model for the 5 WMAP frequency bands. These maps indicate which emission mechanism dominates as a function of frequency and sky position. Synchrotron is red, free-free is green, and thermal dust is blue.

Image Credit: NASA / LAMBDA Archive Team

W-Band K-Band Map (23 GHz)
Logarithmic scale
PNG (174kb - 256x512 pixels)
PNG (570kb - 512x1024 pixels)
PNG (1.8mb - 1024x2048 pixels)
W-Band Ka-Band Map (33 GHz)
Logarithmic scale
PNG (194kb - 256x512 pixels)
PNG (653kb - 512x1024 pixels)
PNG (2.2mb - 1024x2048 pixels)
W-Band Q-Band Map (41 GHz)
Logarithmic scale
PNG (202kb - 256x512 pixels)
PNG (685kb - 512x1024 pixels)
PNG (2.3mb - 1024x2048 pixels)
W-Band V-Band Map (61 GHz)
Logarithmic scale
PNG (198kb - 256x512 pixels)
PNG (670kb - 512x1024 pixels)
PNG (2.1mb - 1024x2048 pixels)
W-Band W-Band Map (94 GHz)
Logarithmic scale
PNG (164kb - 256x512 pixels)
PNG (558kb - 512x1024 pixels)
PNG (1.8mb - 1024x2048 pixels)

Back to top

Objects in the Microwave sky
A guide to the microwave sky for reference. This picture shows the large-scale emission from the Milky Way galaxy, including some of its notable components such as the Cygnus complex, the North Polar Spur, the Gum region, etc. The small circles show positions of significant microwave point sources. The brighter sources are labeled for reference.

Image Credit: NASA / LAMBDA Archive Team

W-Band Microwave sky overlay

PNG (34kb - 258x515 pixels)
PNG (87kb - 512x1022 pixels)
PNG (788kb - 1028x2051 pixels)
PDF (76kb)

Back to top

WMAP Intensity Masks
WMAP uses a set of standard sky masks for certain data processing and analysis needs. The masking is based on the K-band signal levels, which each successive mask increasing the severity of the masking cut. The most severe cut is Kp0. Not shown are additional cuts made around point sources.

Image Credit: NASA / LAMBDA Archive Team

Intensity Masks Intensity Masks

PNG (29kb - 388x640 pixels)
PNG (22kb - 620x1024 pixels)
GIF (26kb - 388x640 pixels)
GIF (24kb - 620x1024 pixels)

Back to top

WMAP Polarization Masks
Polarization masks are shown for the P02,P04, P06 and P10 cut levels. The P06 cut is outlined by the black curve. Masked sources are in violet.

Image Credit: NASA / LAMBDA Archive Team

W-Band Polarization Masks
Galactic coordinates
PNG (26kb - 279x513 pixels)
PNG (61kb - 557x1027 pixels)
PNG (549kb - 1117x2053 pixels)

Back to top

WMAP Beams and Window Functions
WMAP uses in-flight observations of Jupiter to characterize the beam for each antenna feed. Window functions are computed from these observations for each of the ten differencing assemblies.

Image Credit: NASA / LAMBDA Archive Team

Window Function Side A Focal Plane Mosiac
Each beam response has been normalized to its peak value. Linear scale from -.5 to 1
PNG (32kb - 650x650 pixels)
Window Function Side B Focal Plane Mosiac
Each beam response has been normalized to its peak value. Linear scale from -.5 to 1
PNG (32kb - 650x650 pixels)
Window Function WMAP Window Functions

PNG (8kb - 362x511 pixels)
PNG (19kb - 723x1021 pixels)
PNG (48kb - 1449x2046 pixels)
PDF (34kb)

Back to top

A service of the HEASARC and of the Astrophysics Science Division at NASA/GSFC
Goddard Space Flight Center, National Aeronautics and Space Administration
HEASARC Director: Dr. Andrew F. Ptak
LAMBDA Director: Dr. Thomas M. Essinger-Hileman
NASA Official: Dr. Thomas M. Essinger-Hileman
Web Curator: Mr. Michael R. Greason