

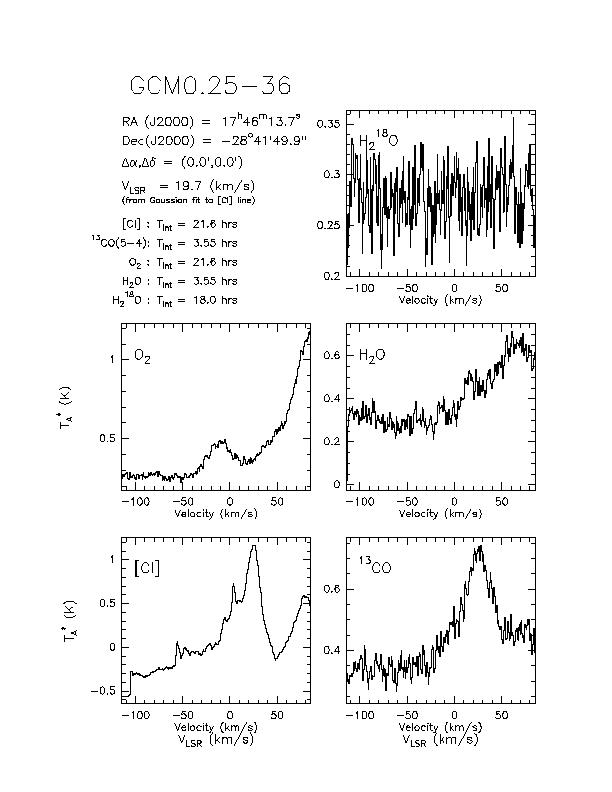
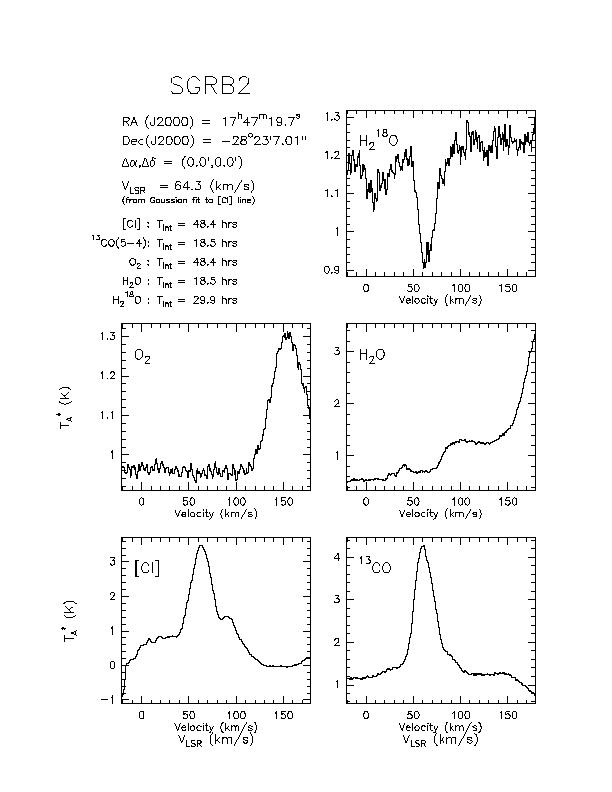
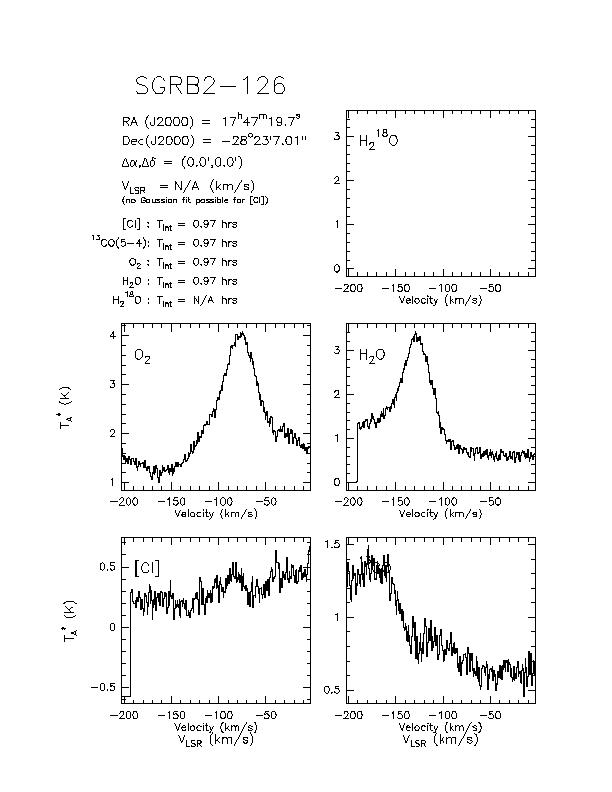
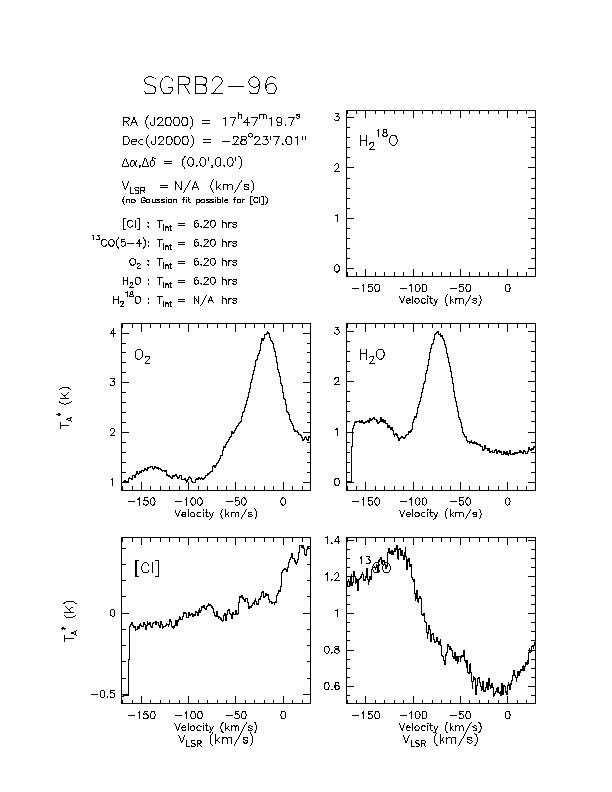
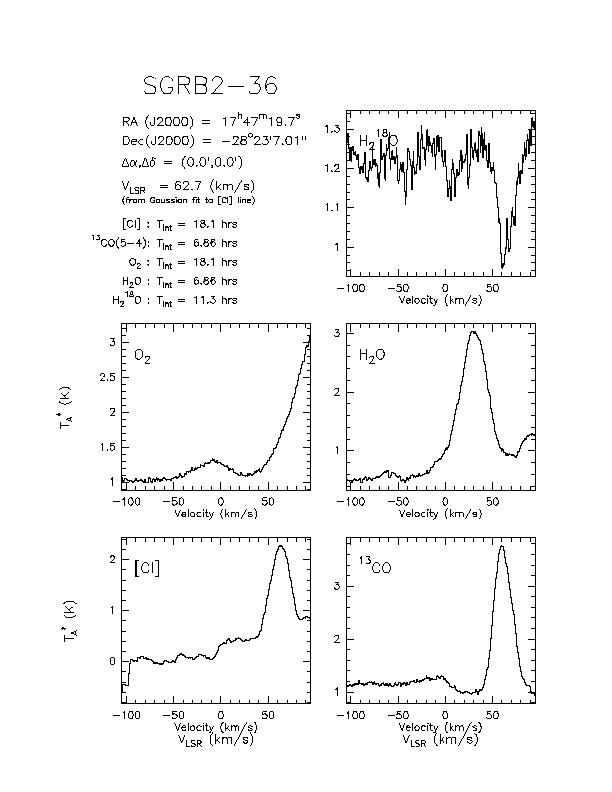
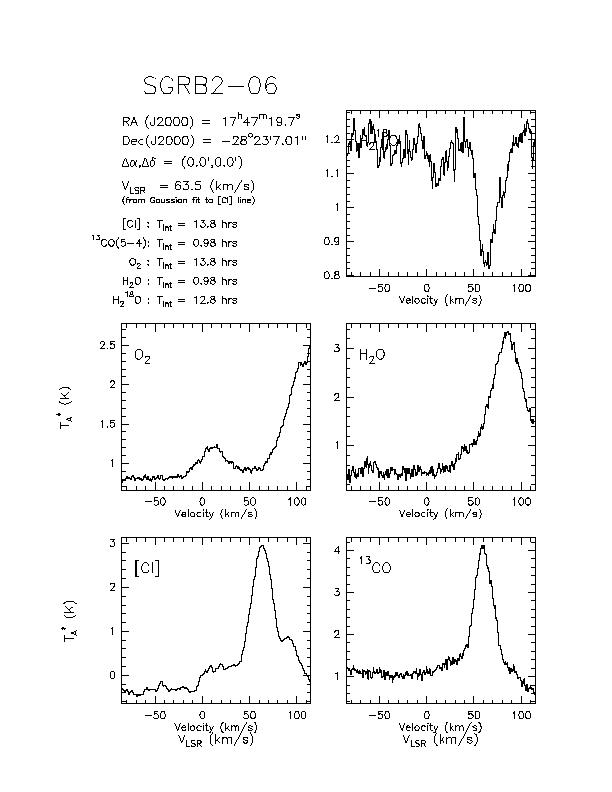
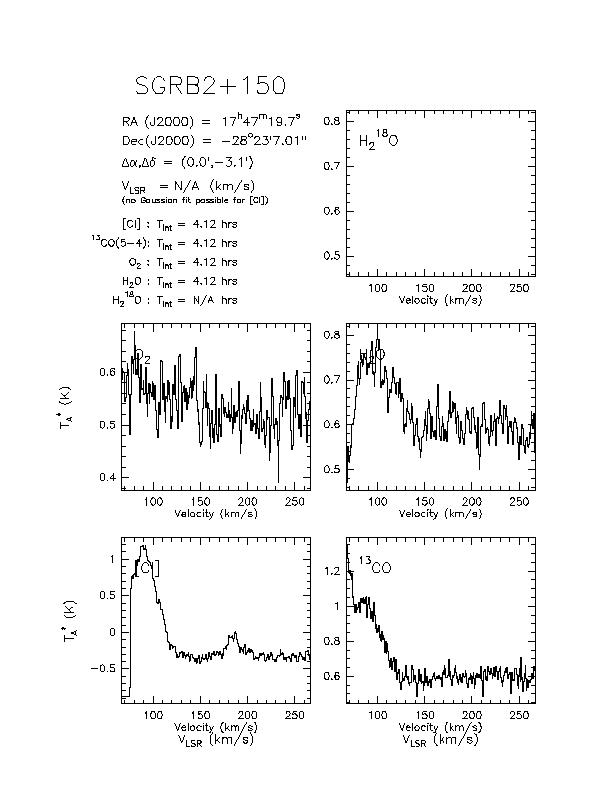
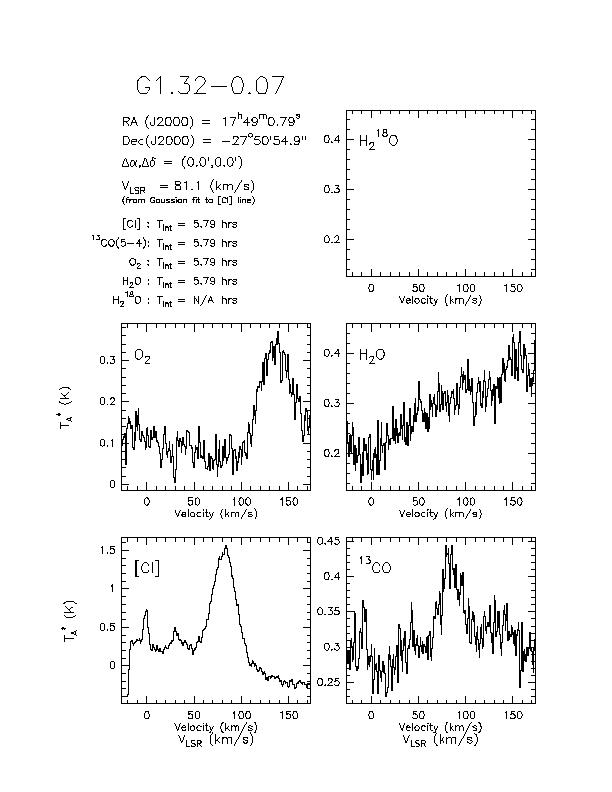
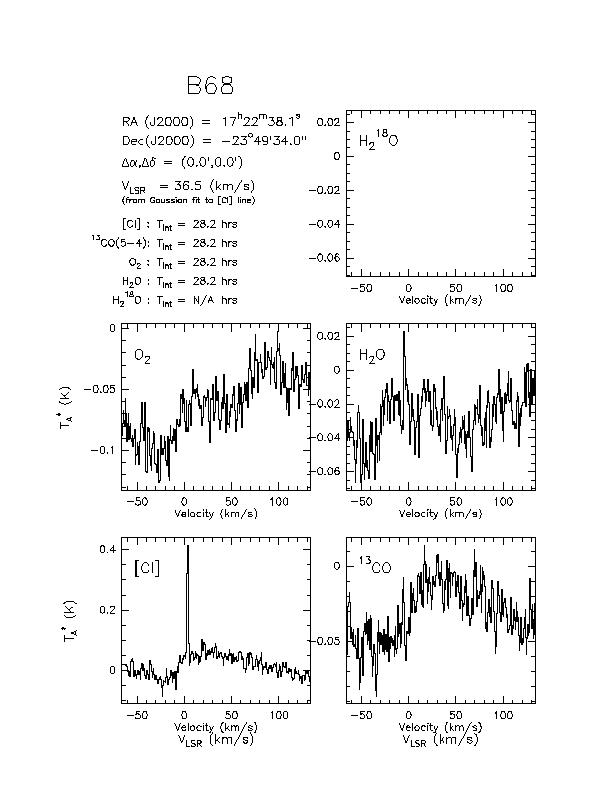
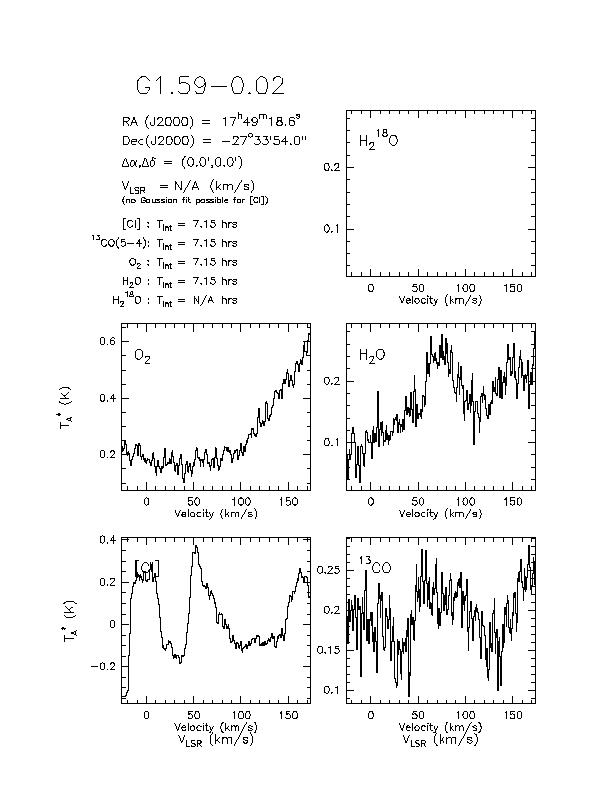
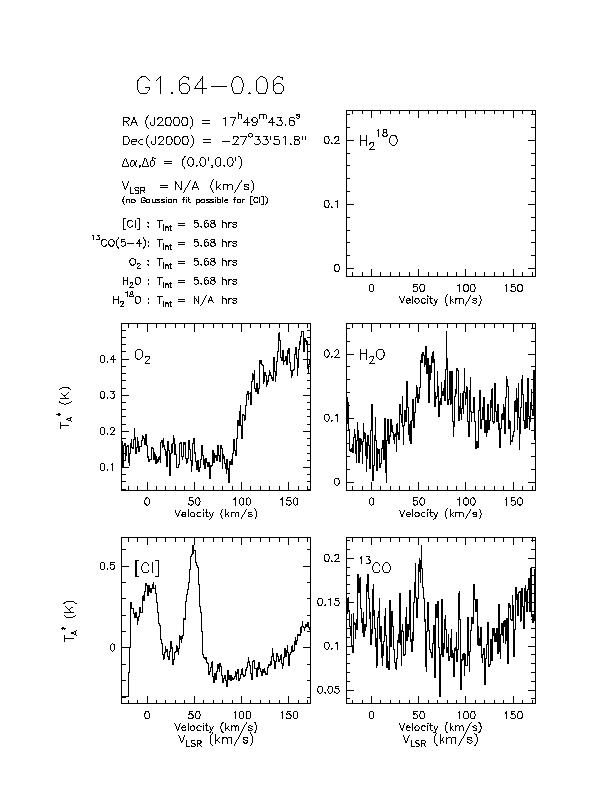
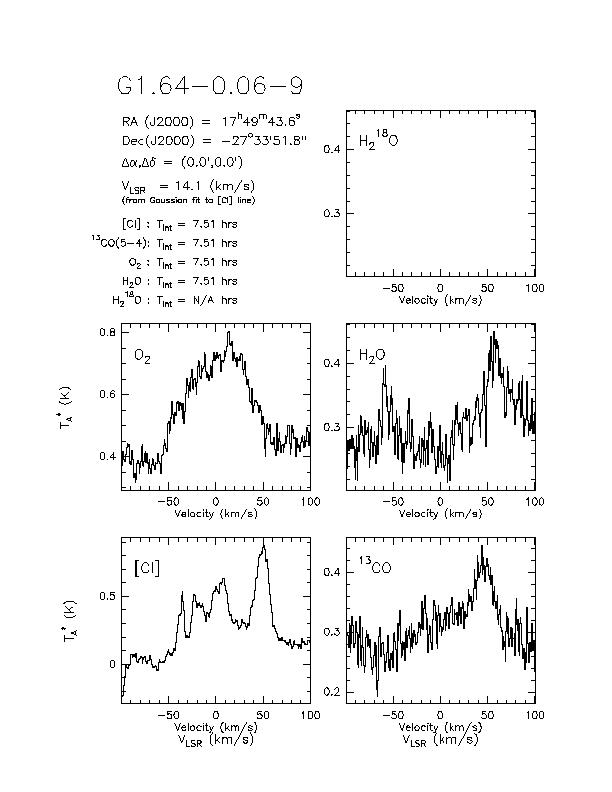
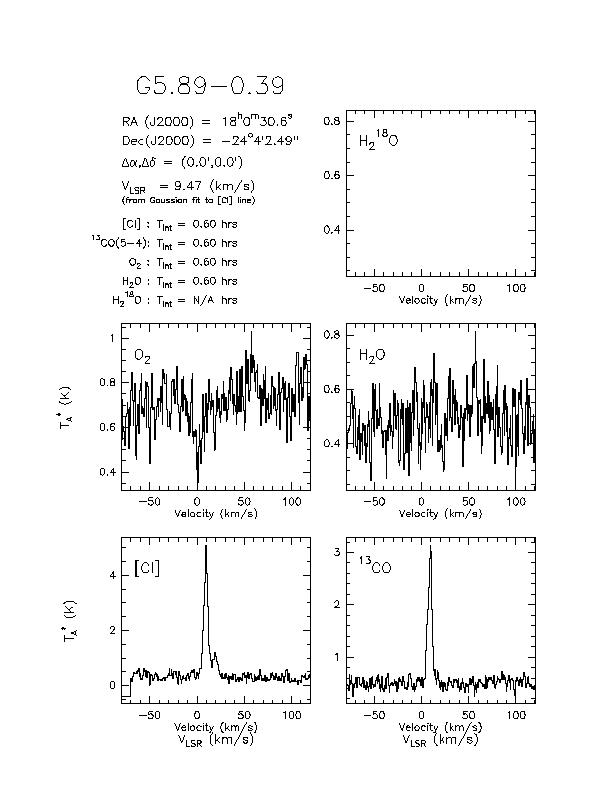
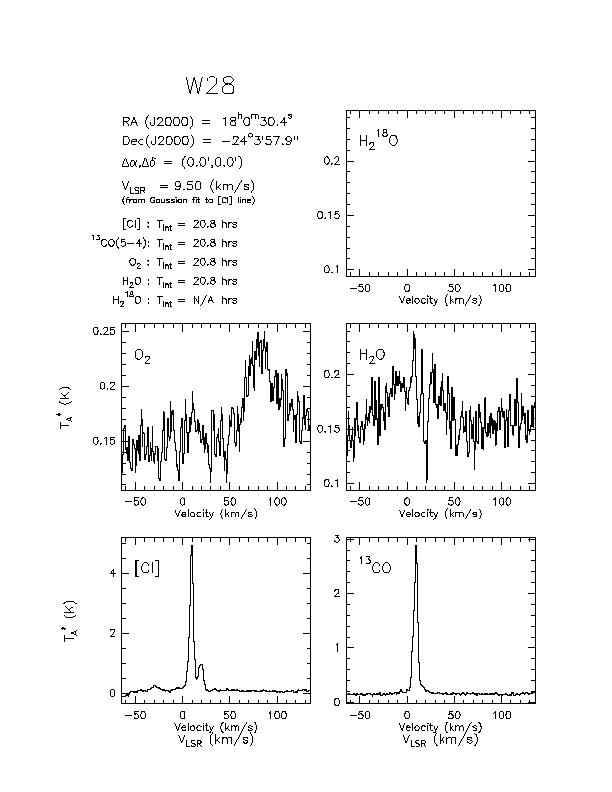
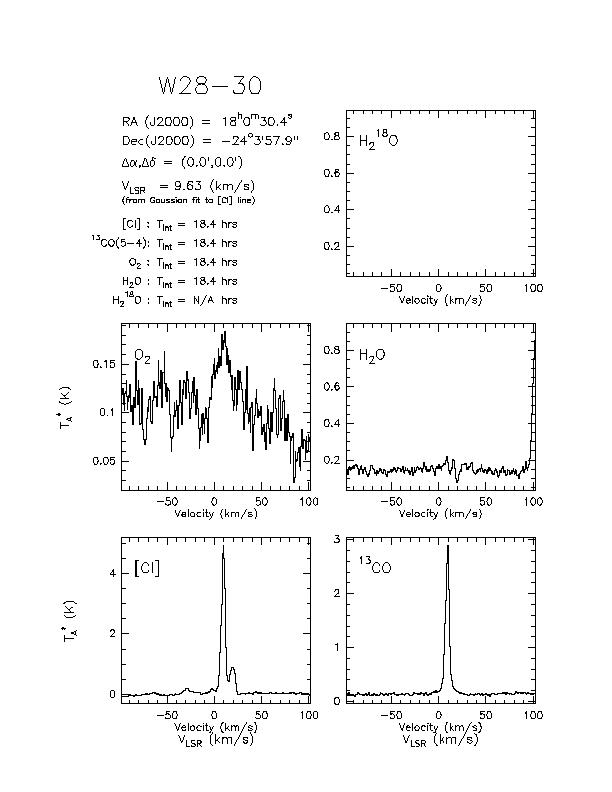
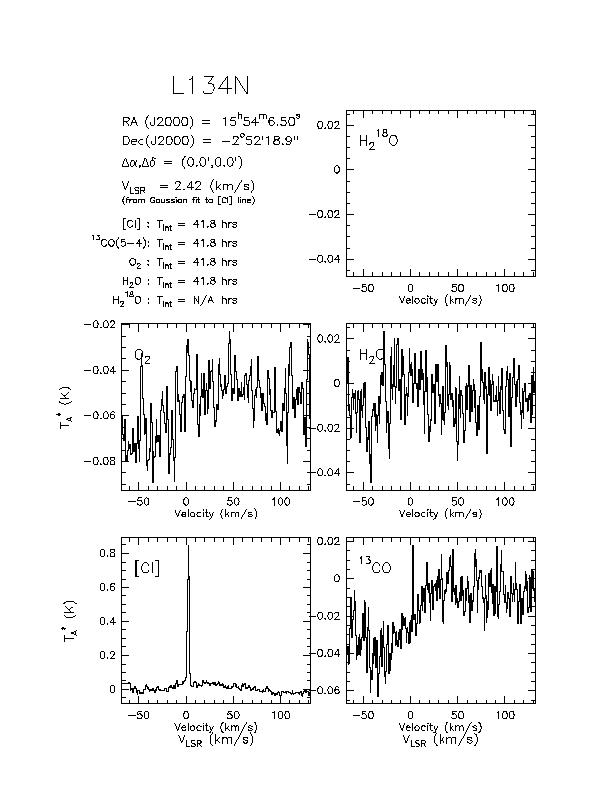
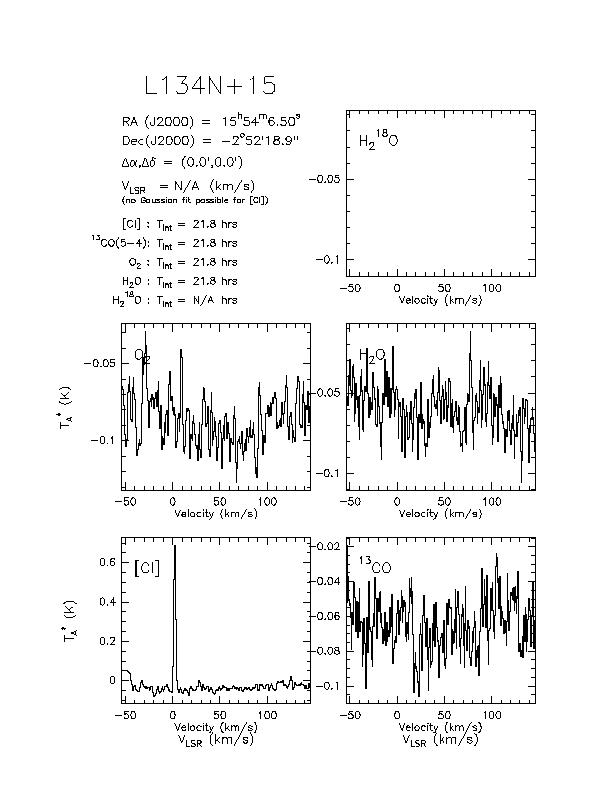
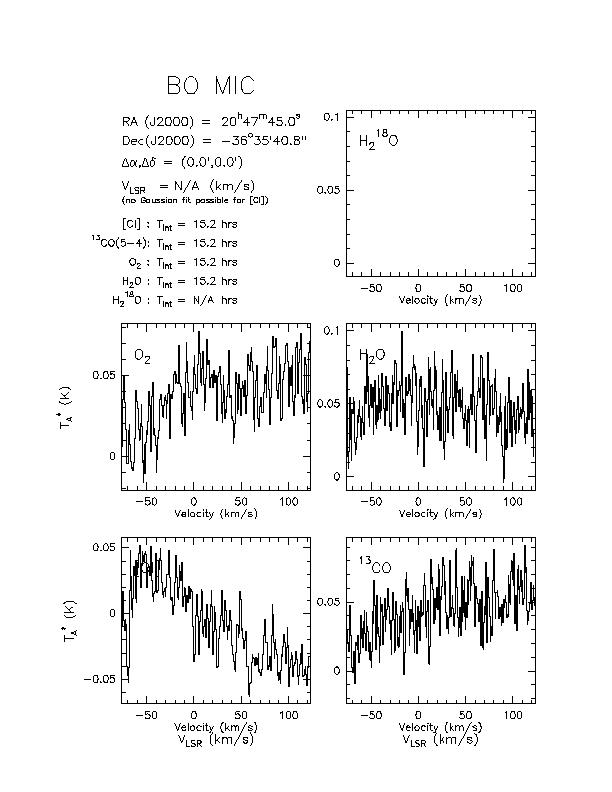
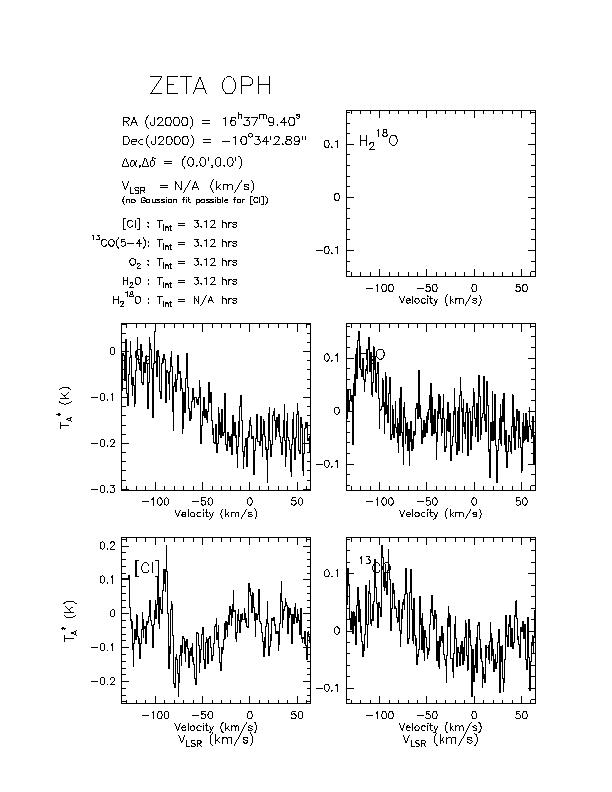
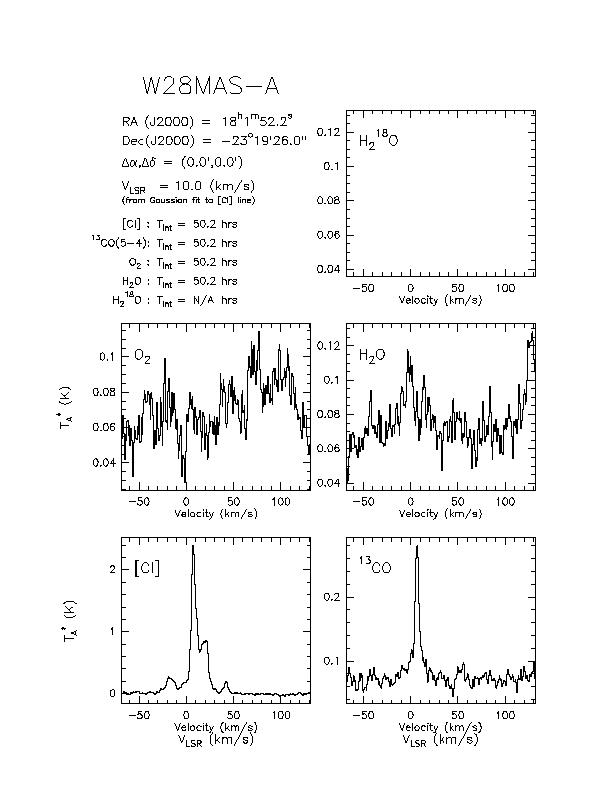
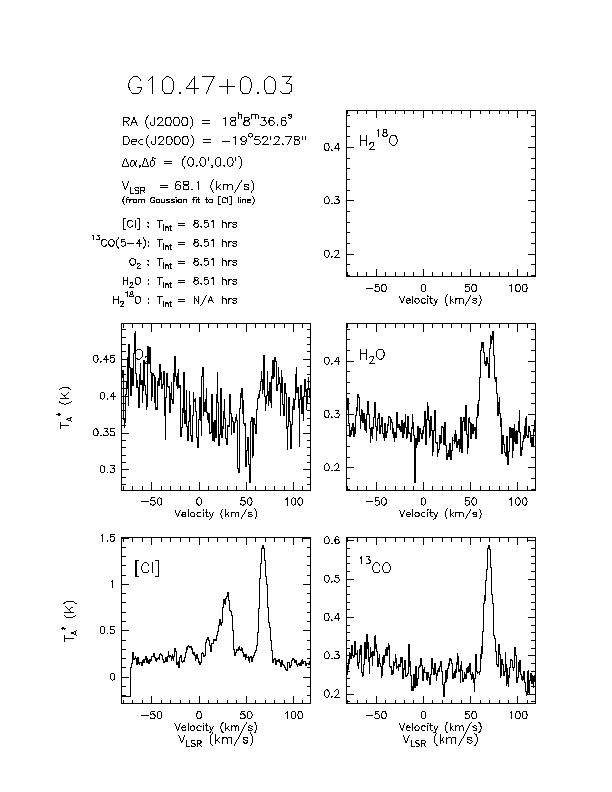
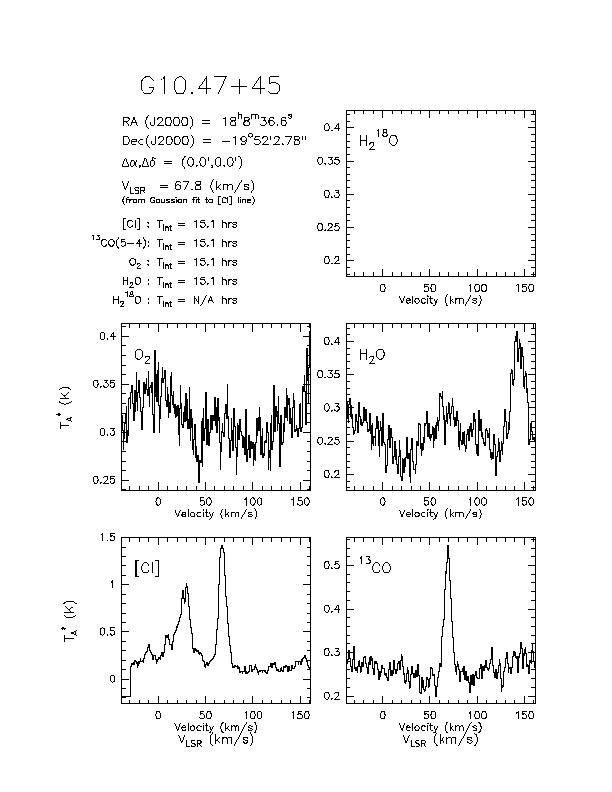
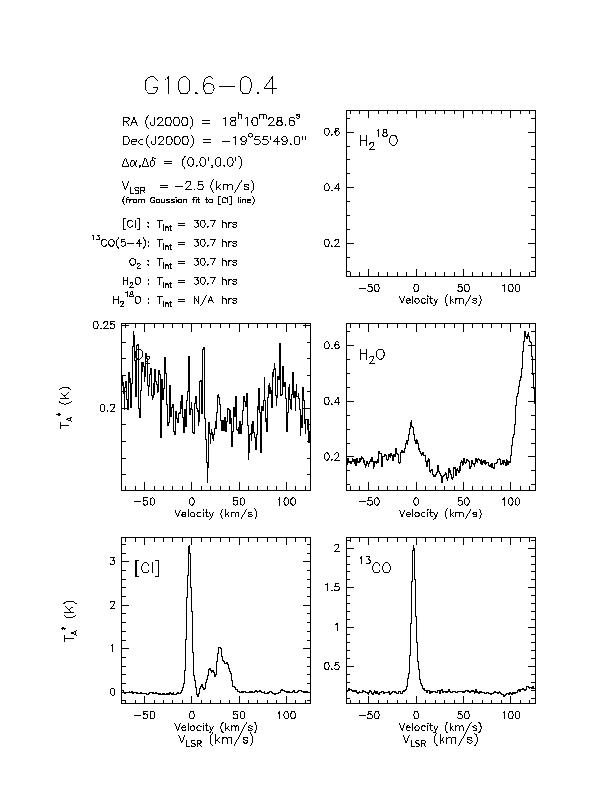
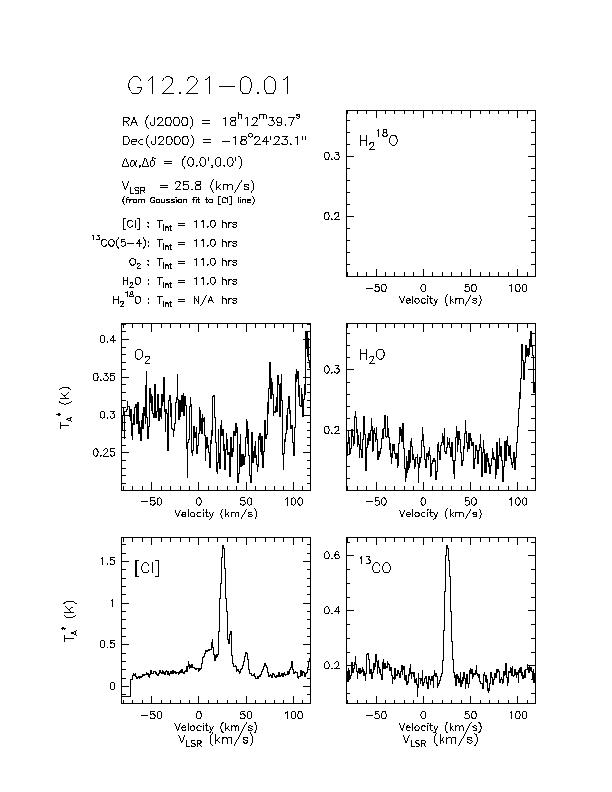
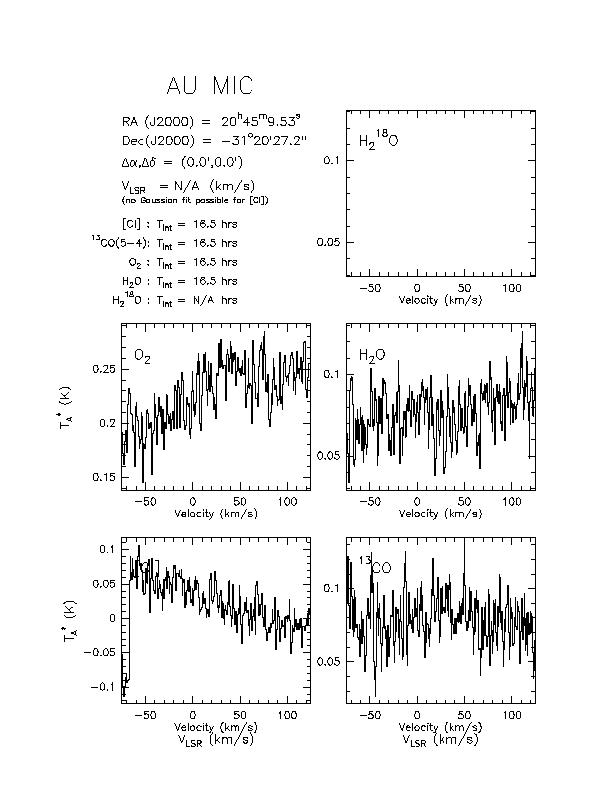
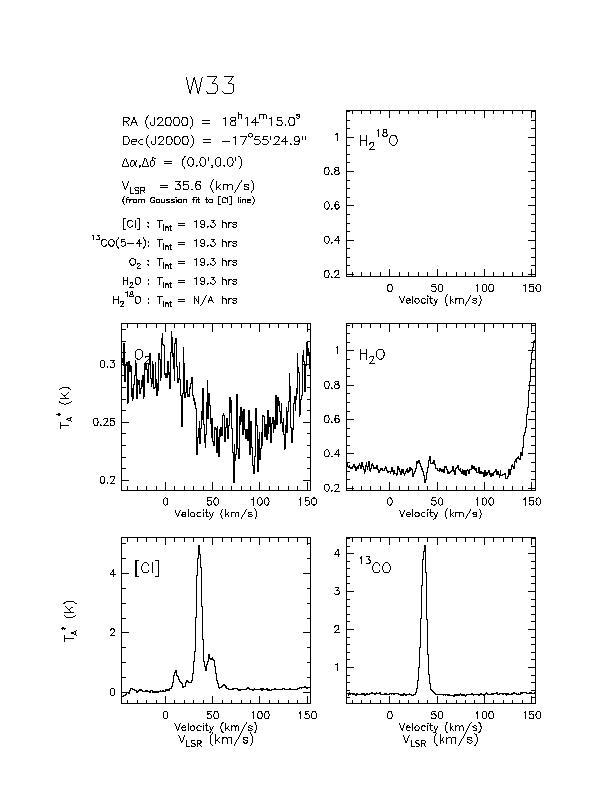
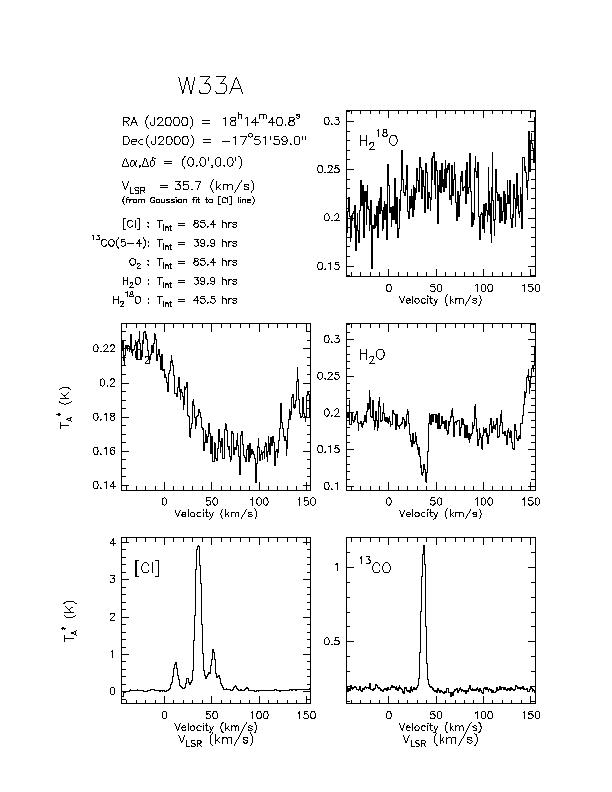
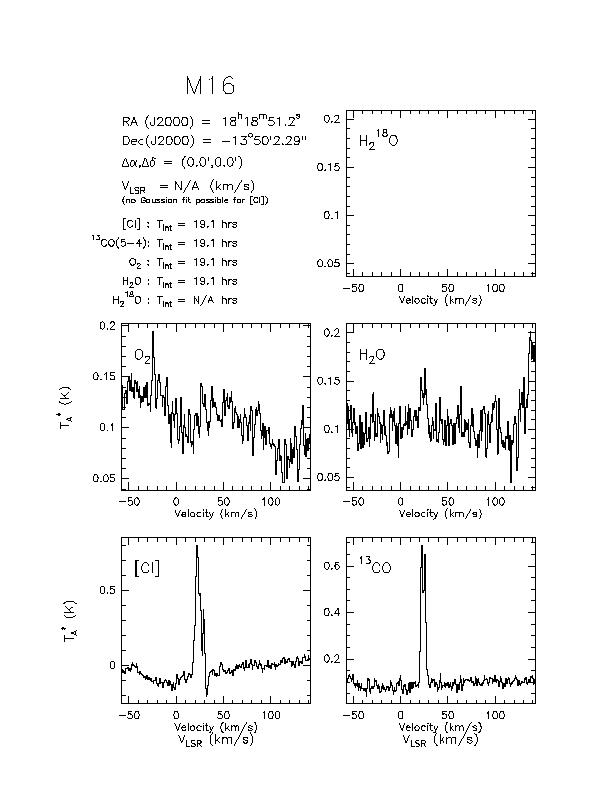
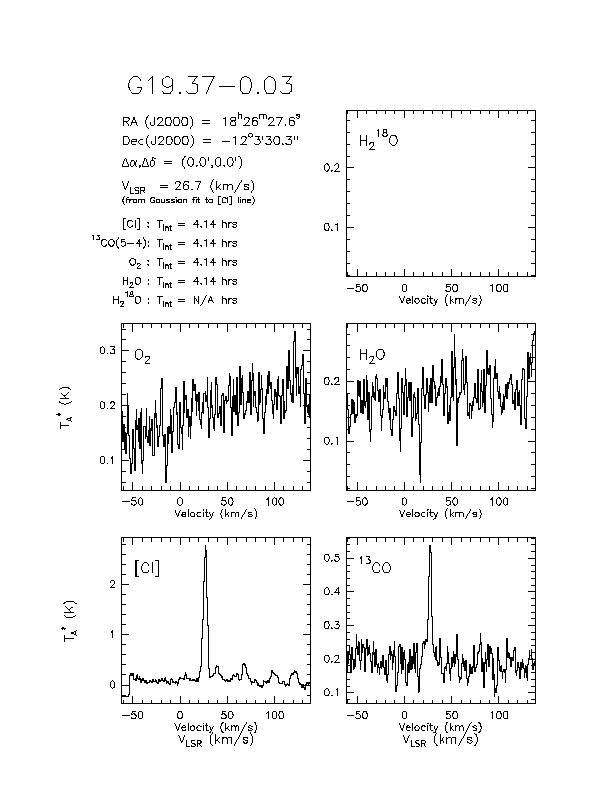
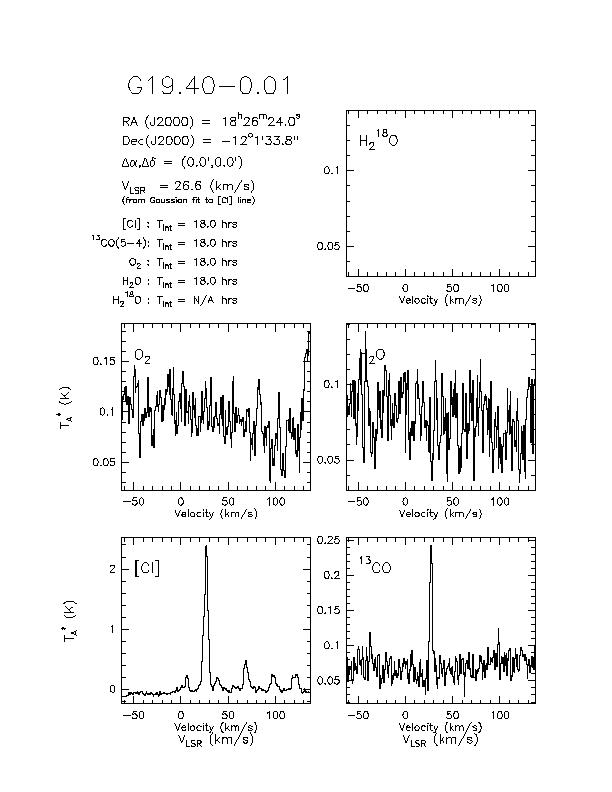
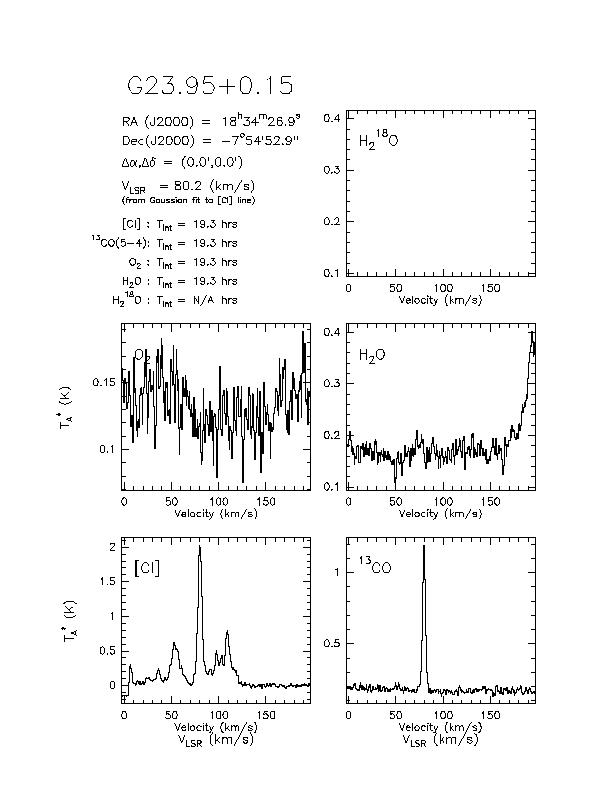
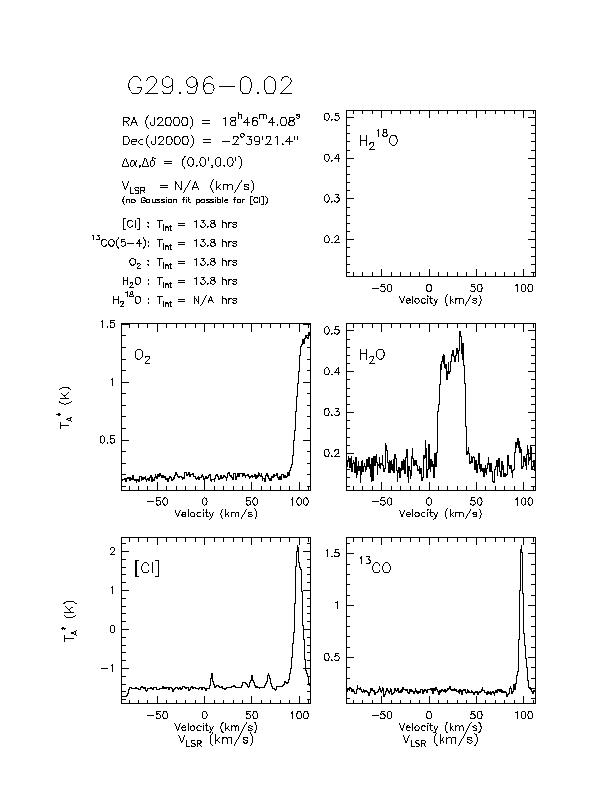
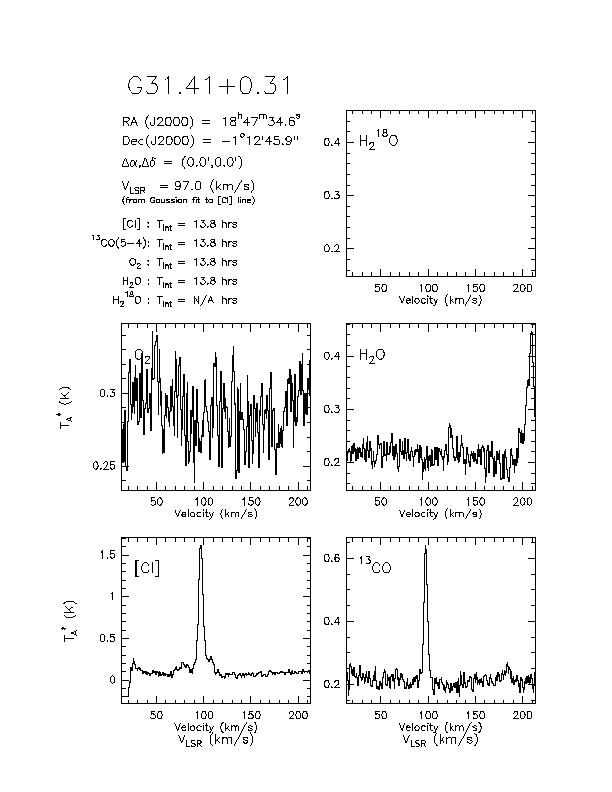
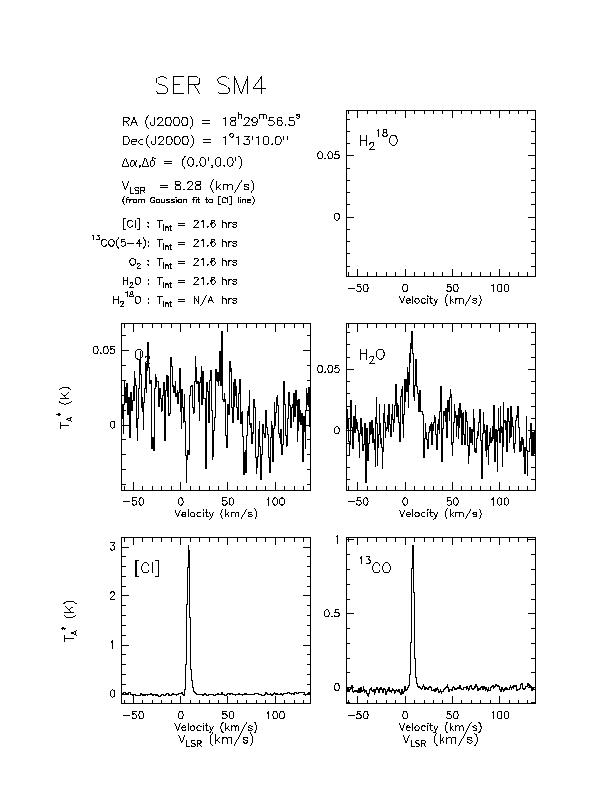
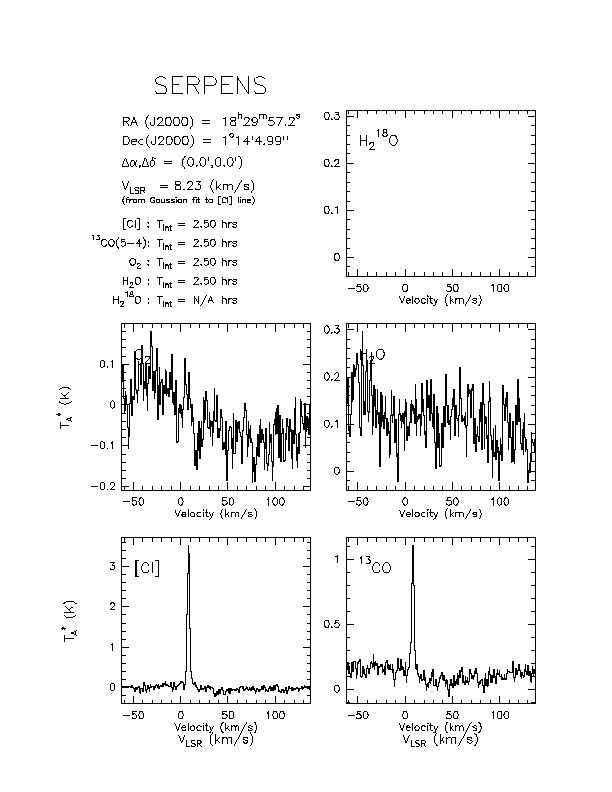
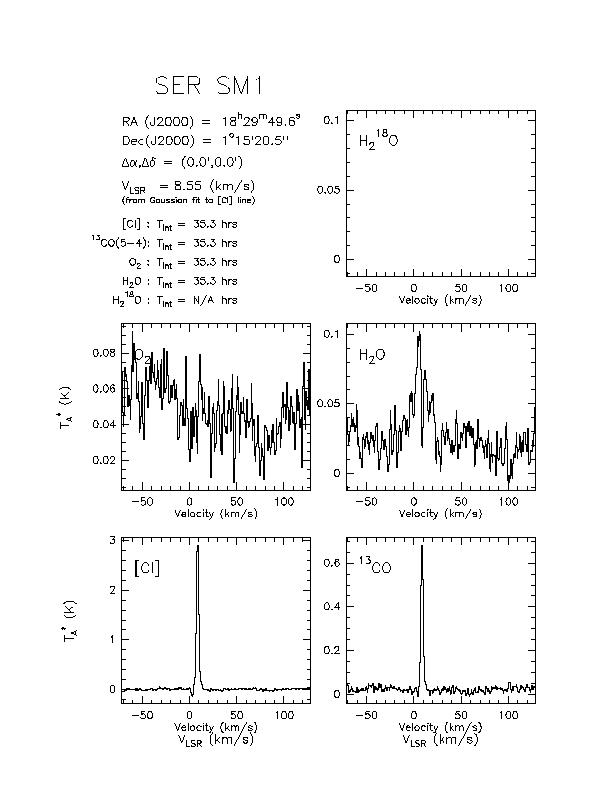
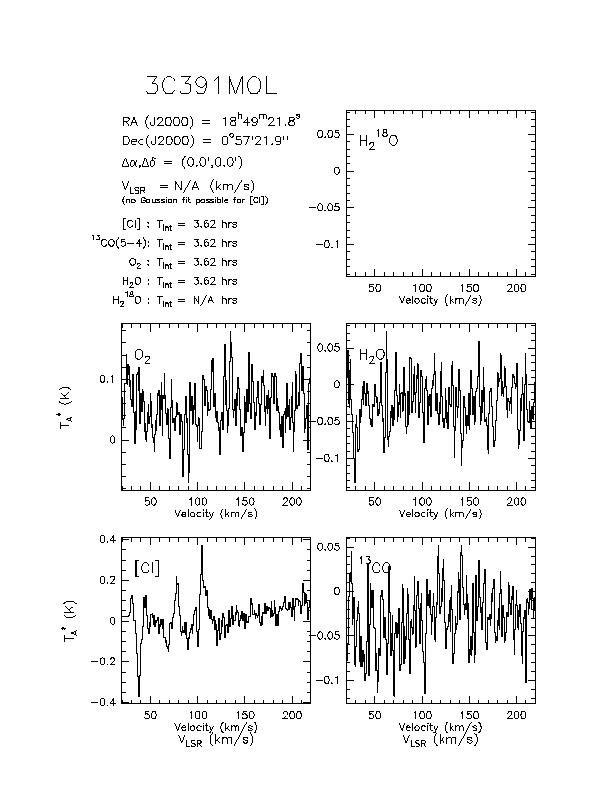
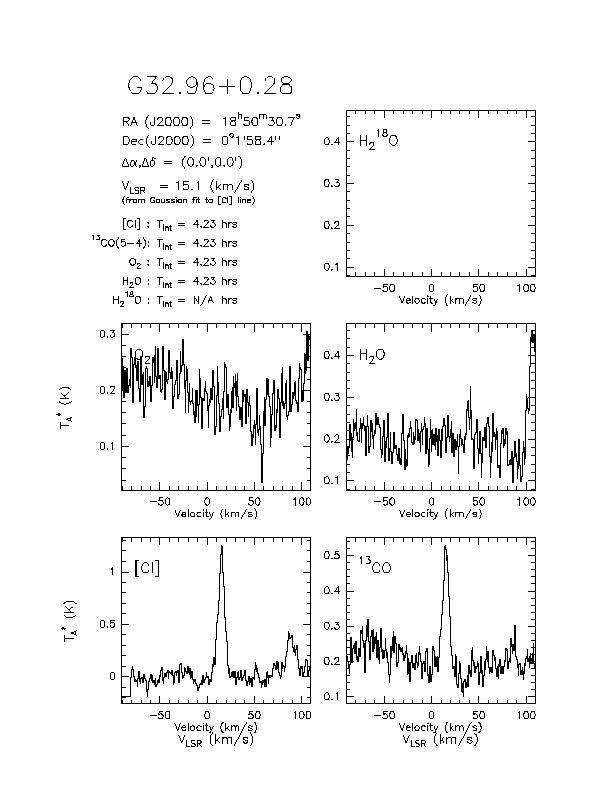
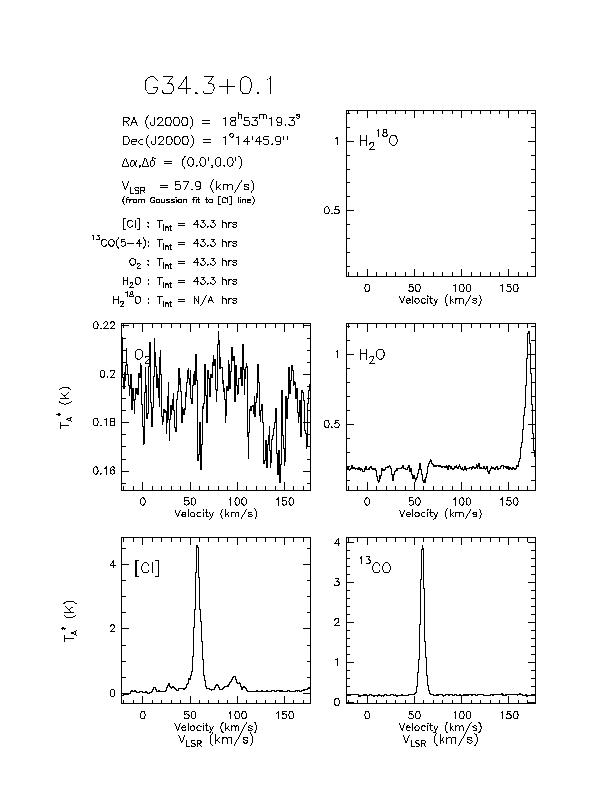
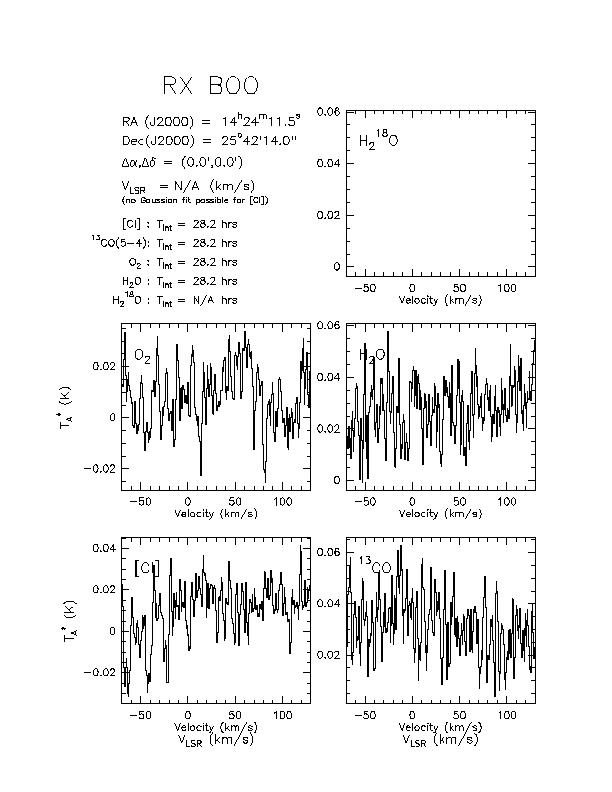
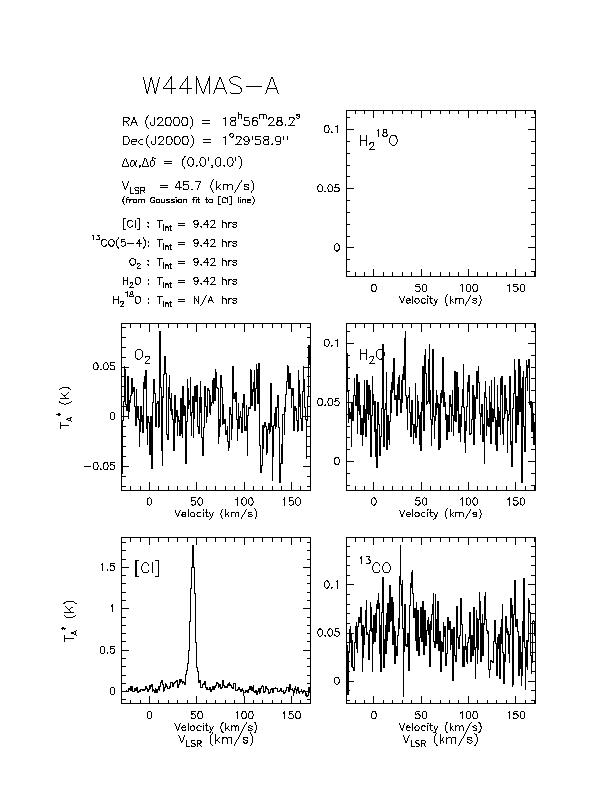
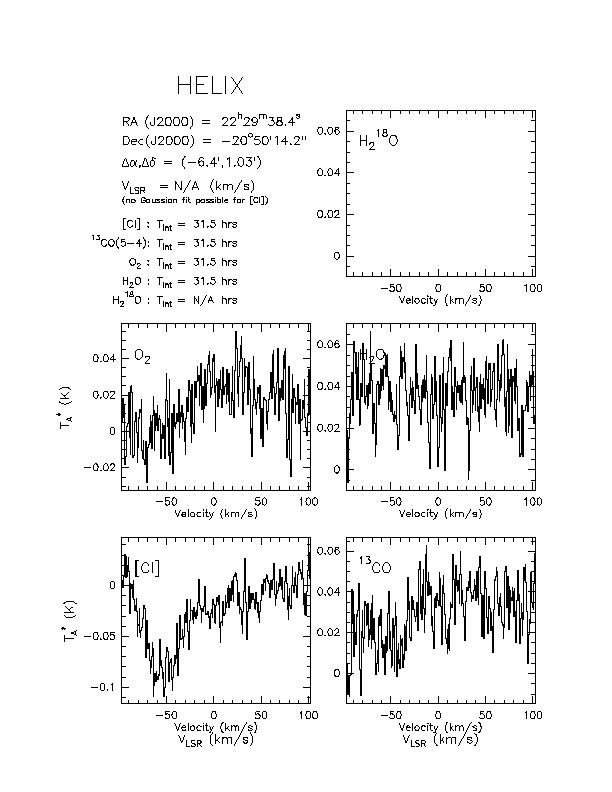
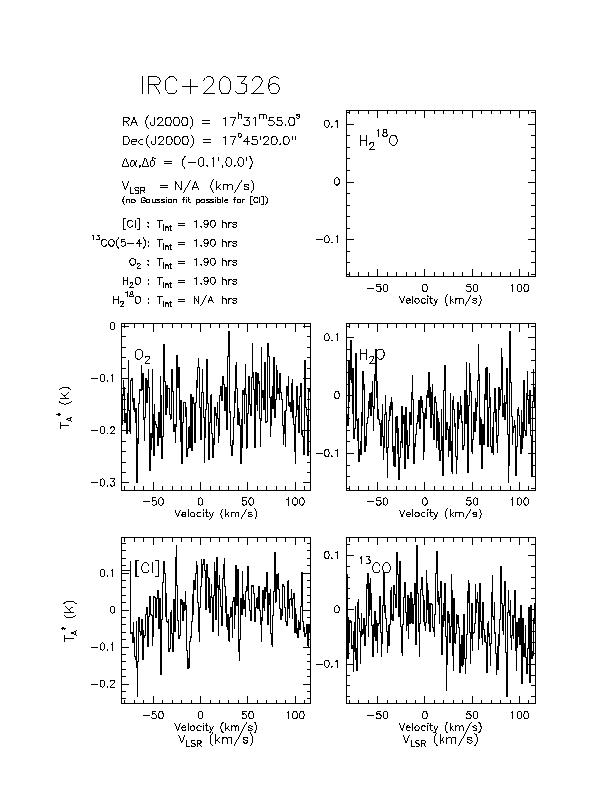
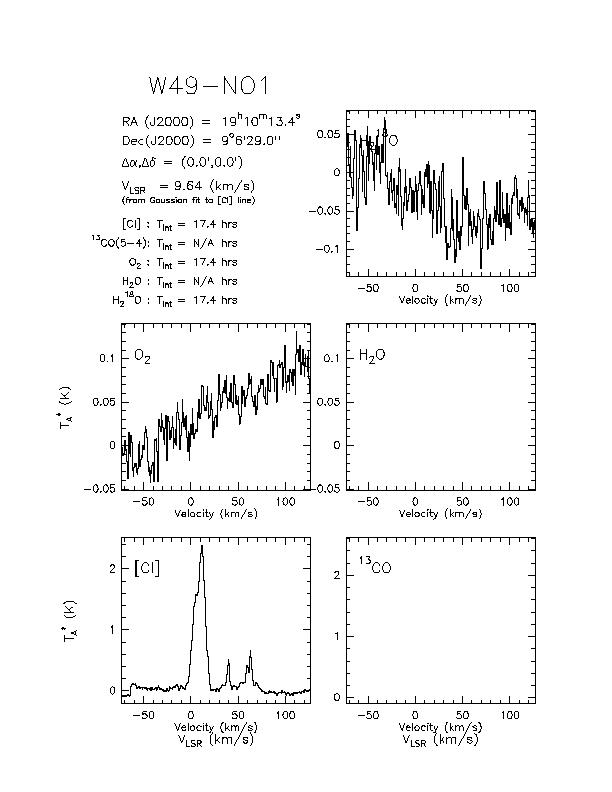
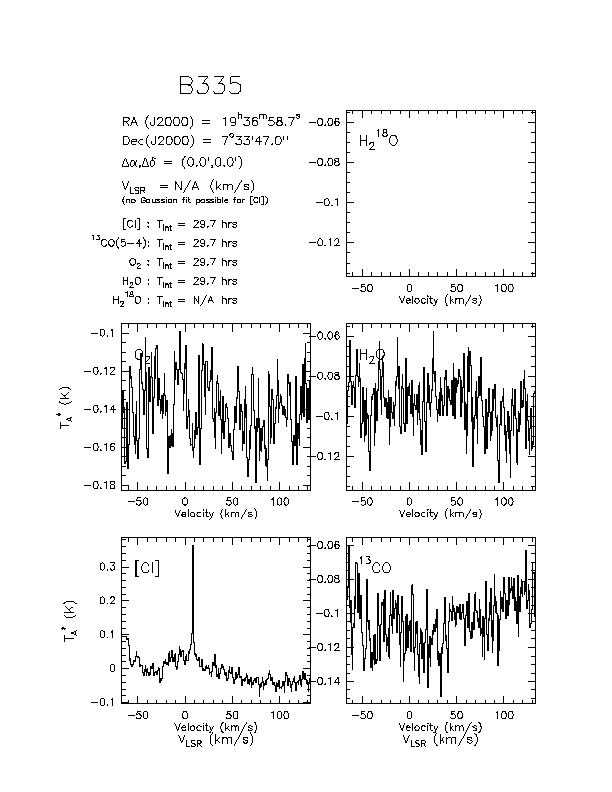
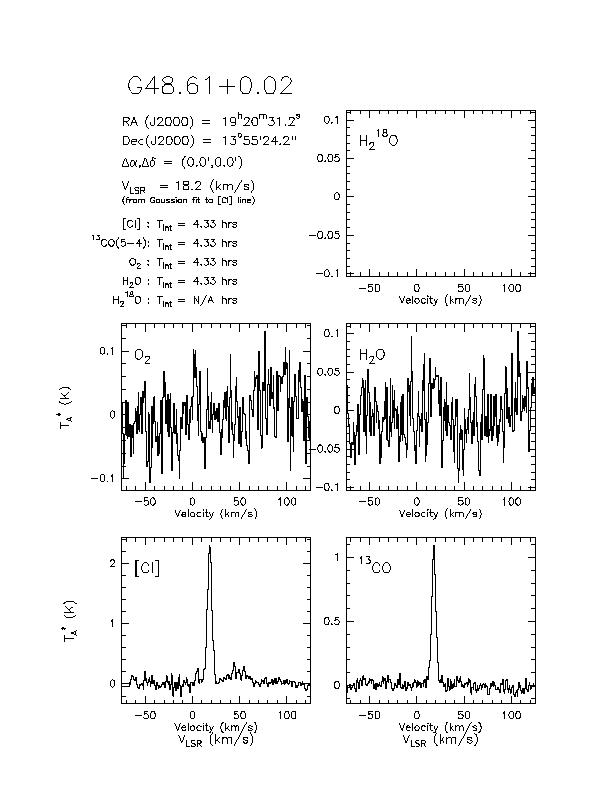
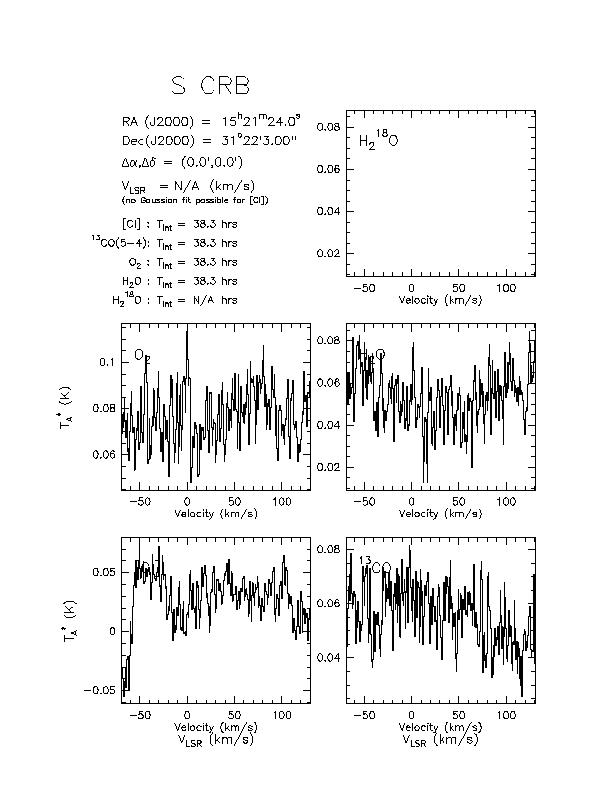
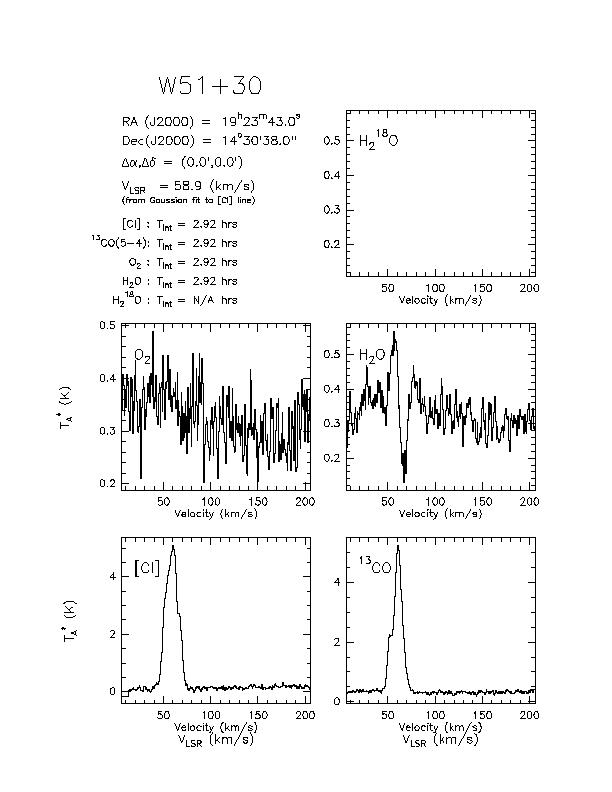
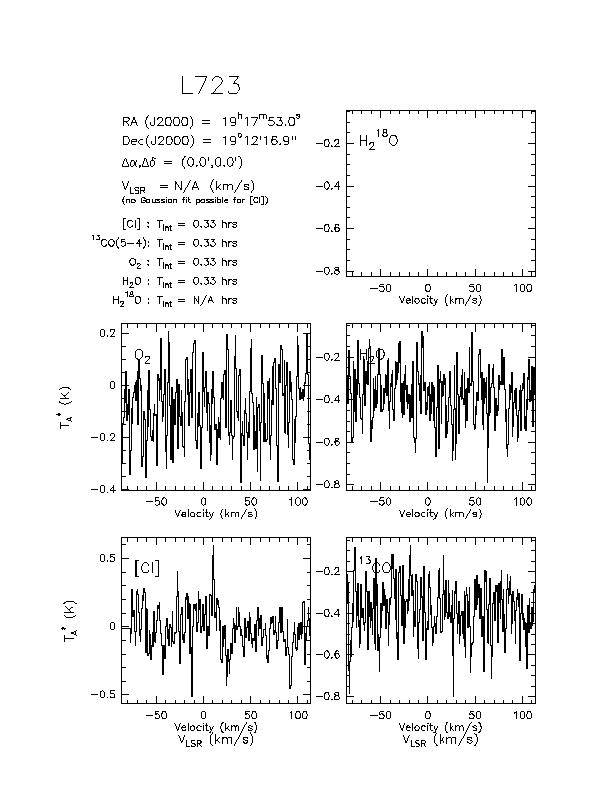
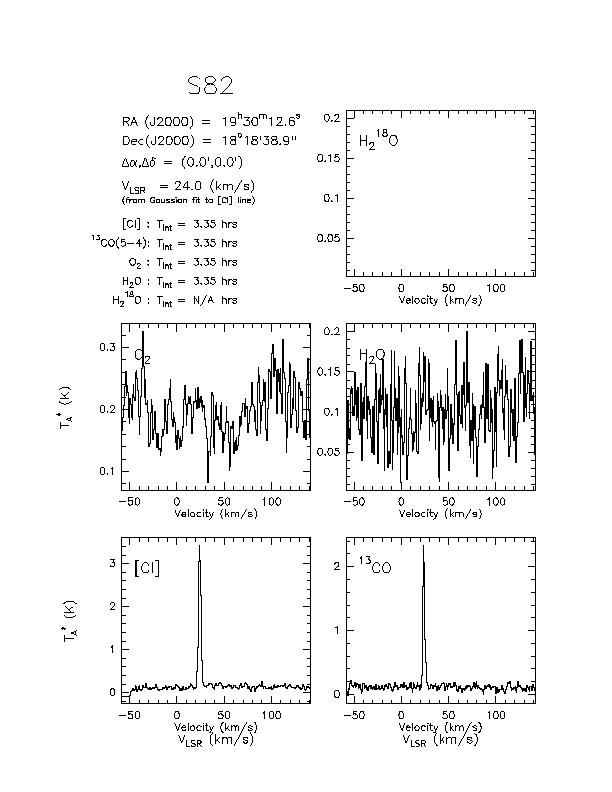
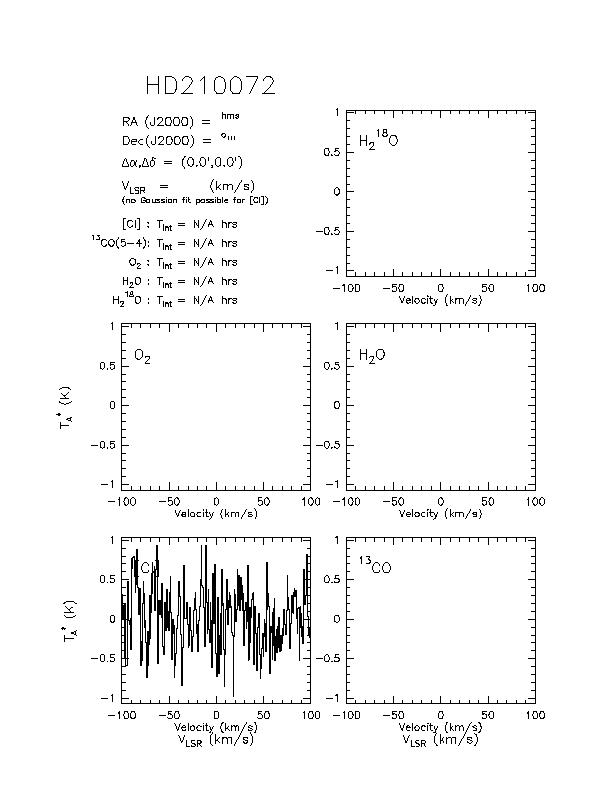
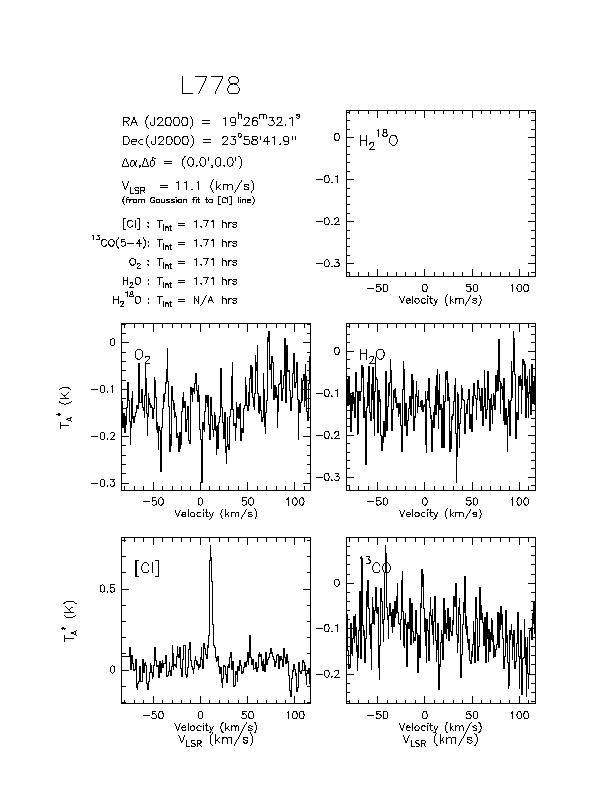
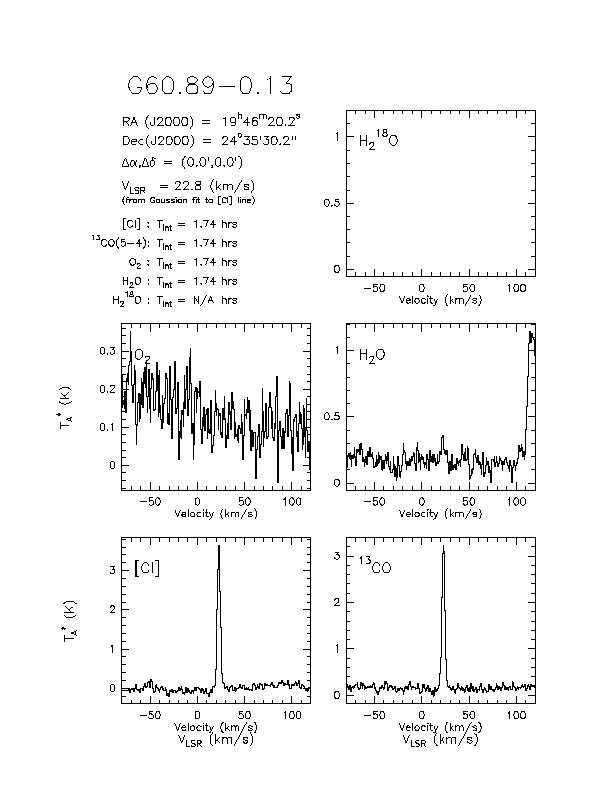
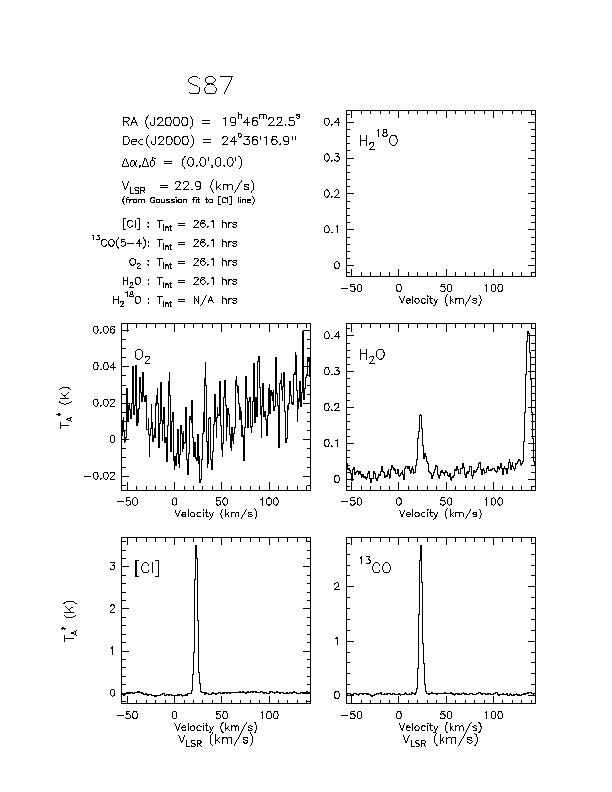
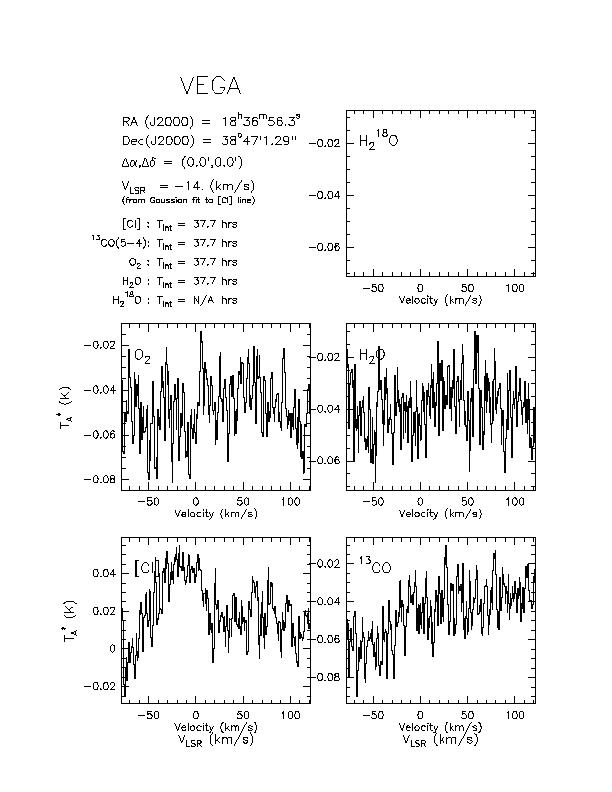
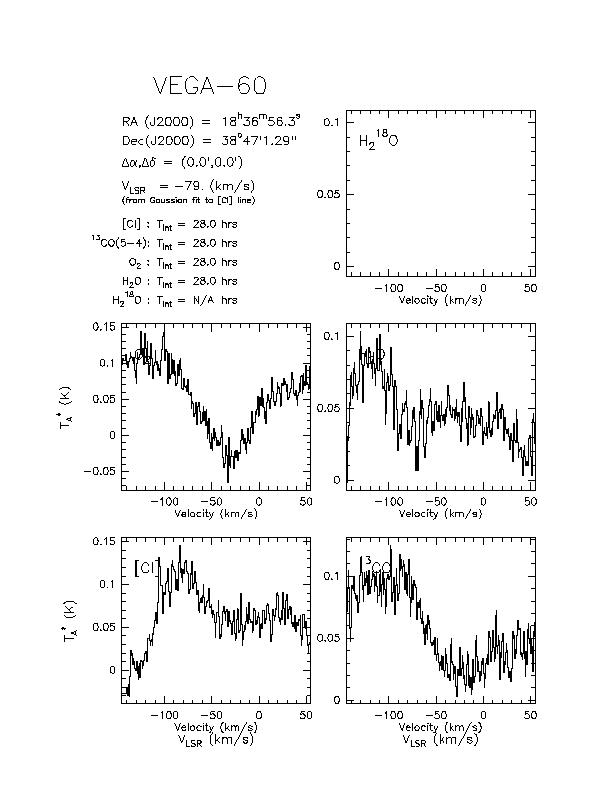
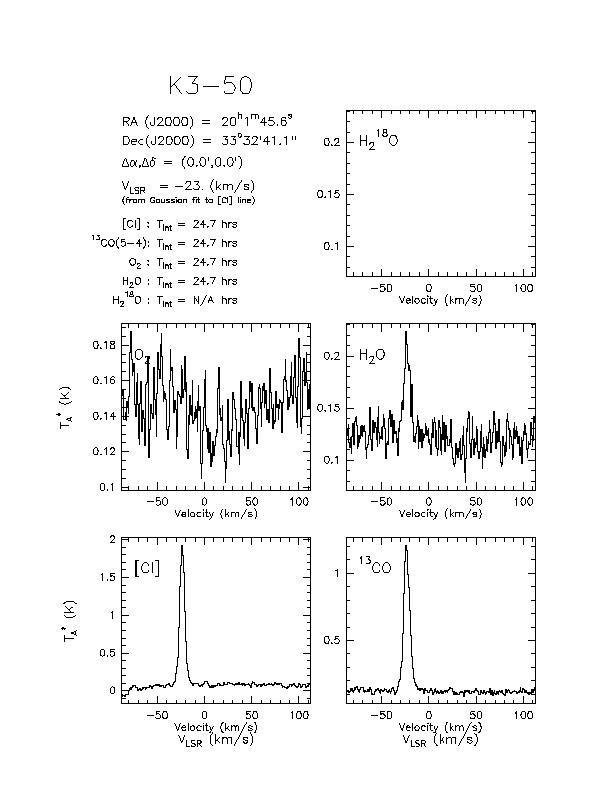
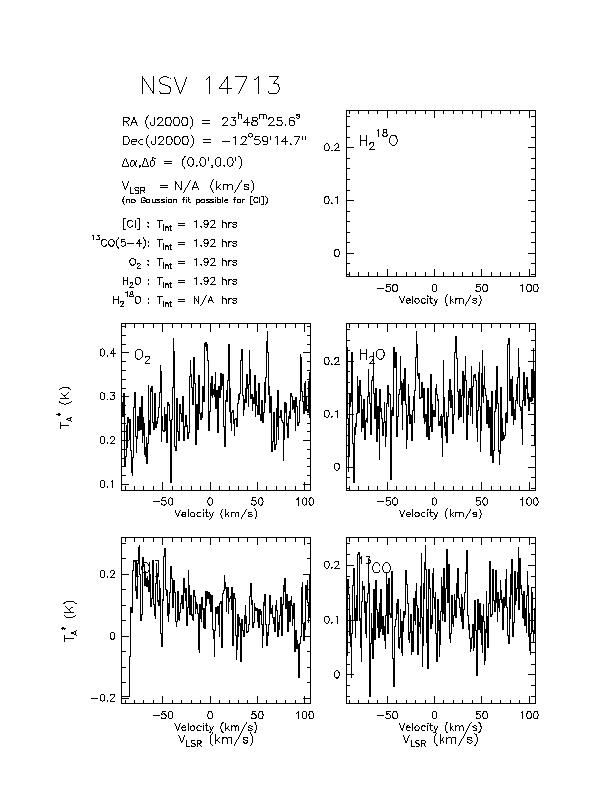
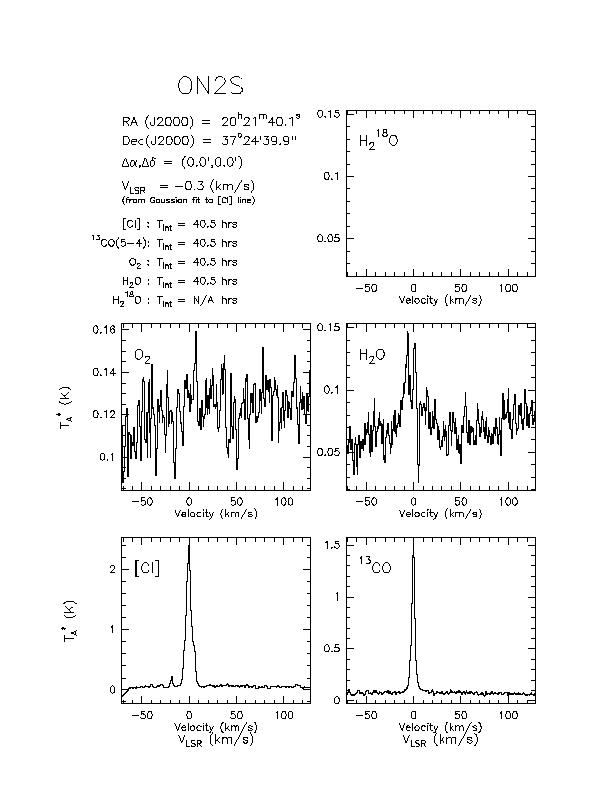
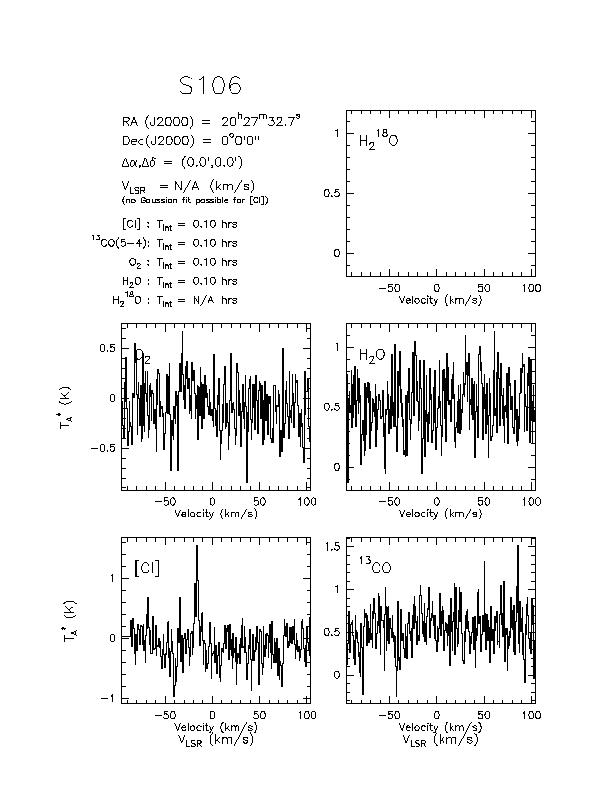
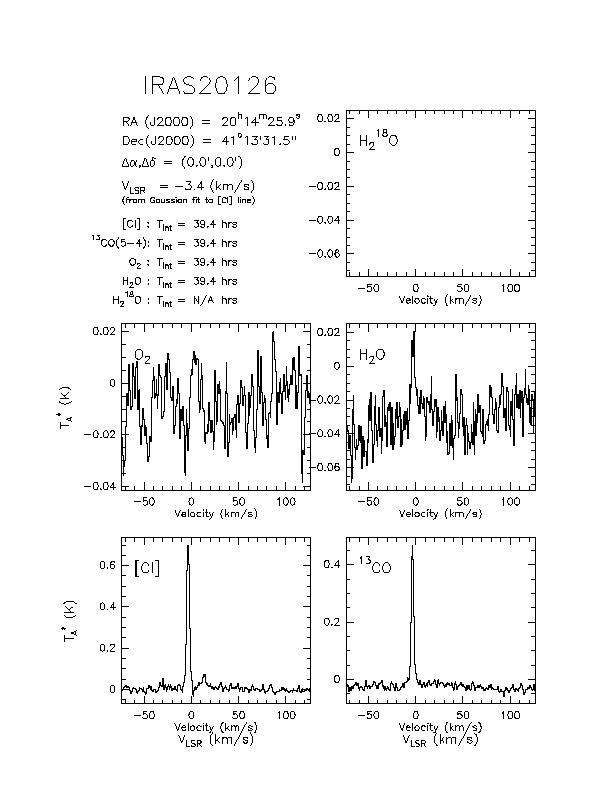
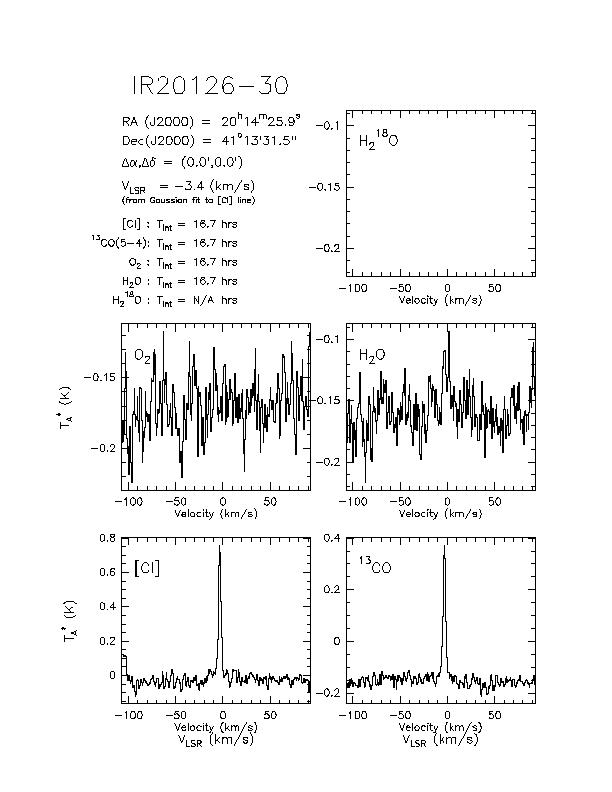
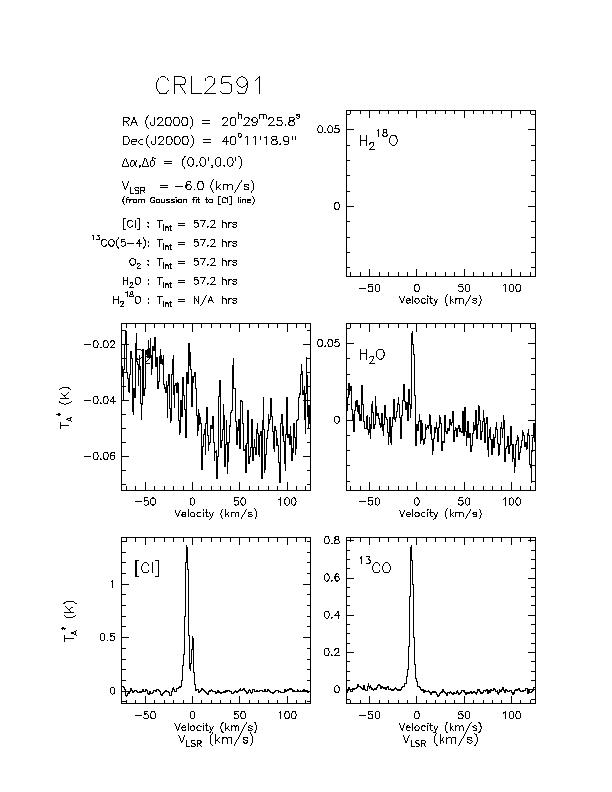
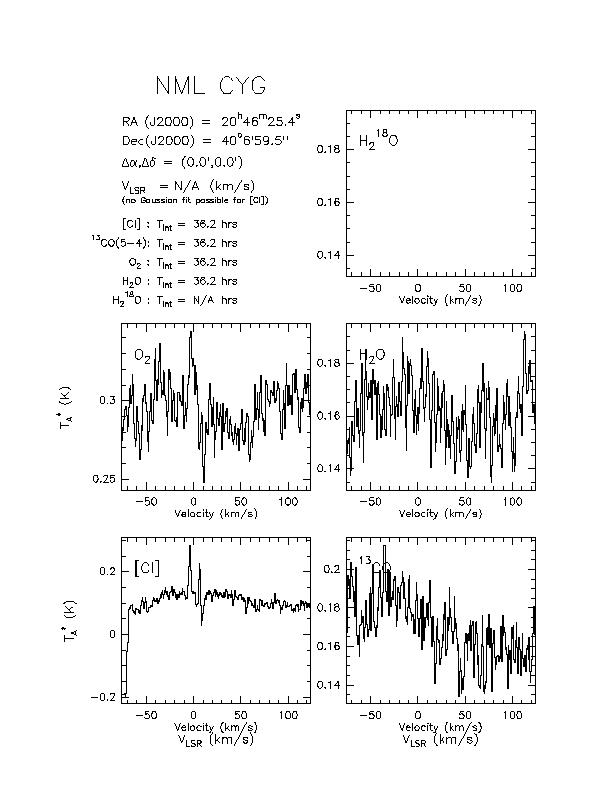
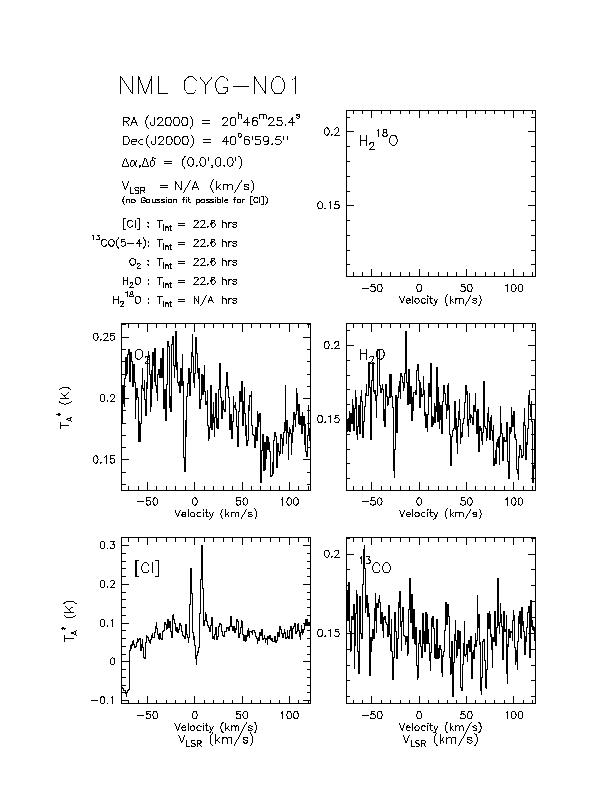
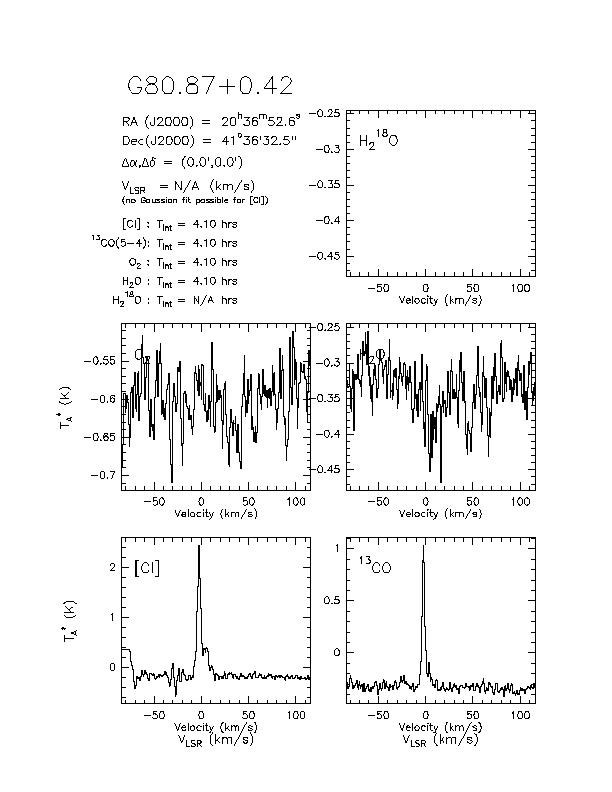
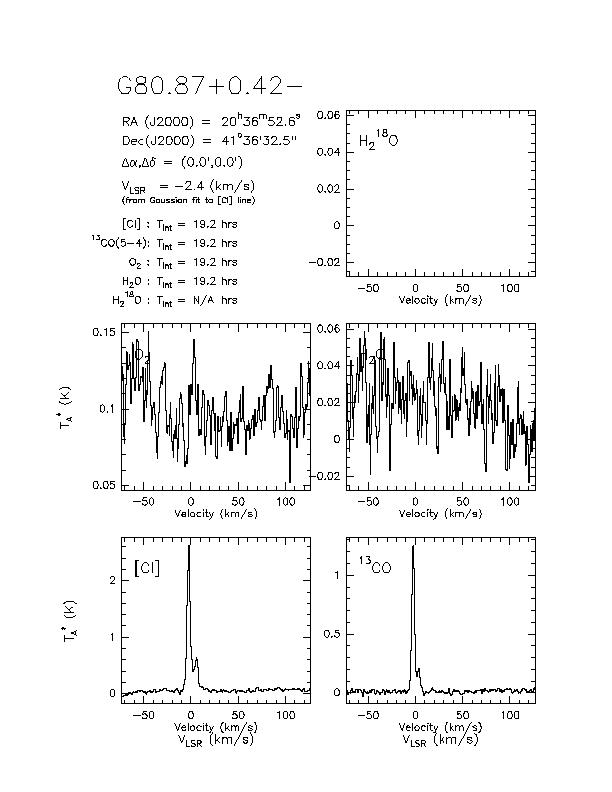
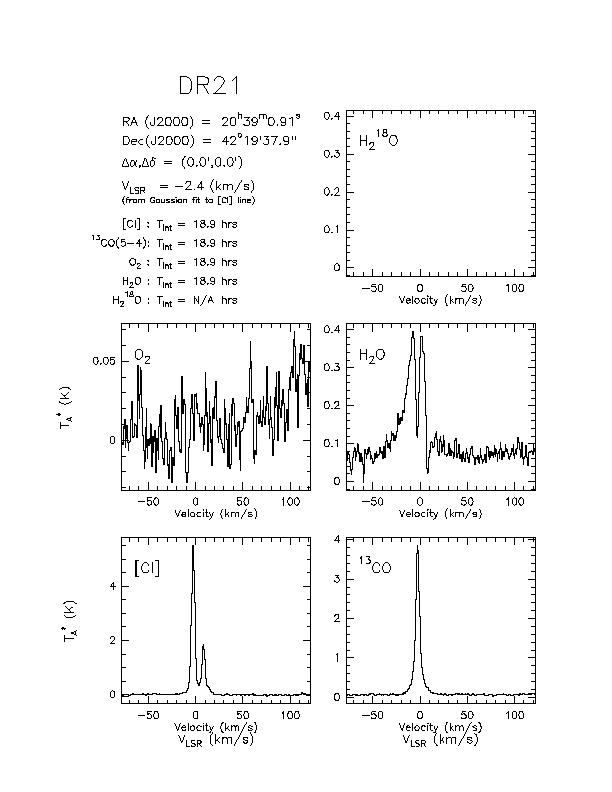
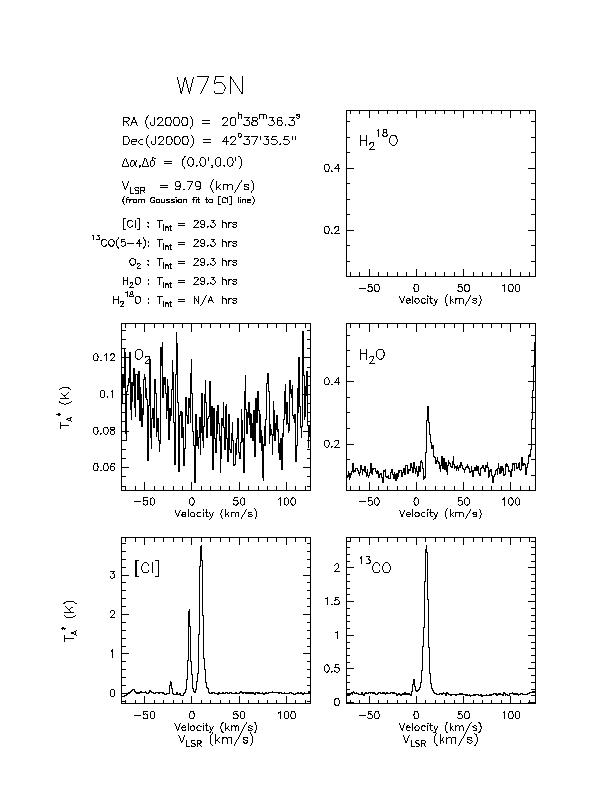
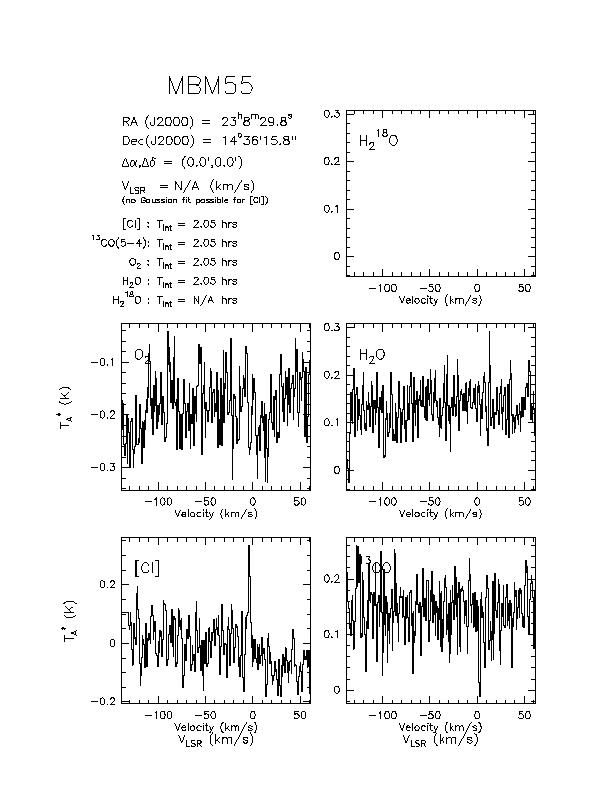
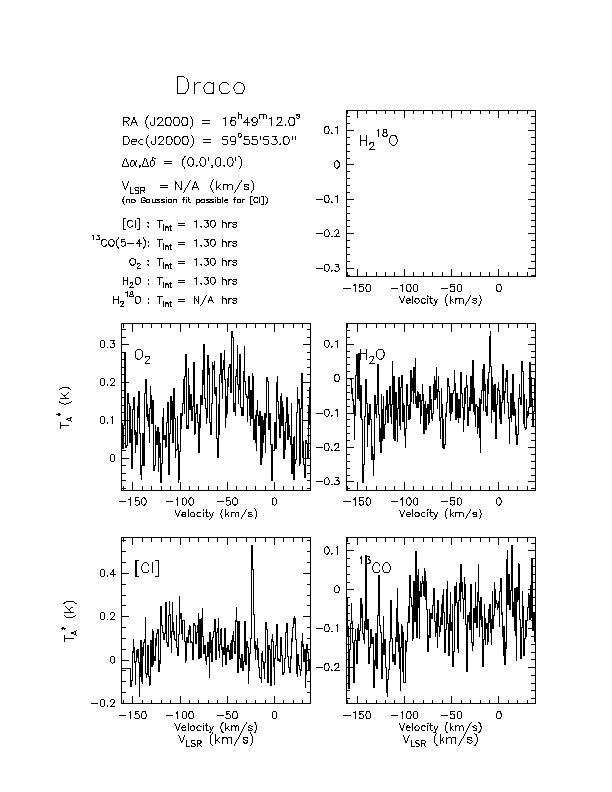
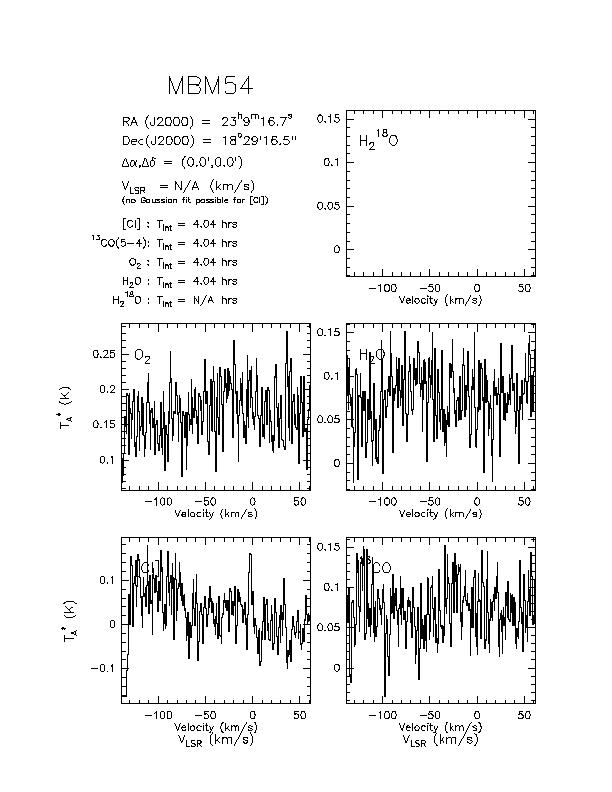
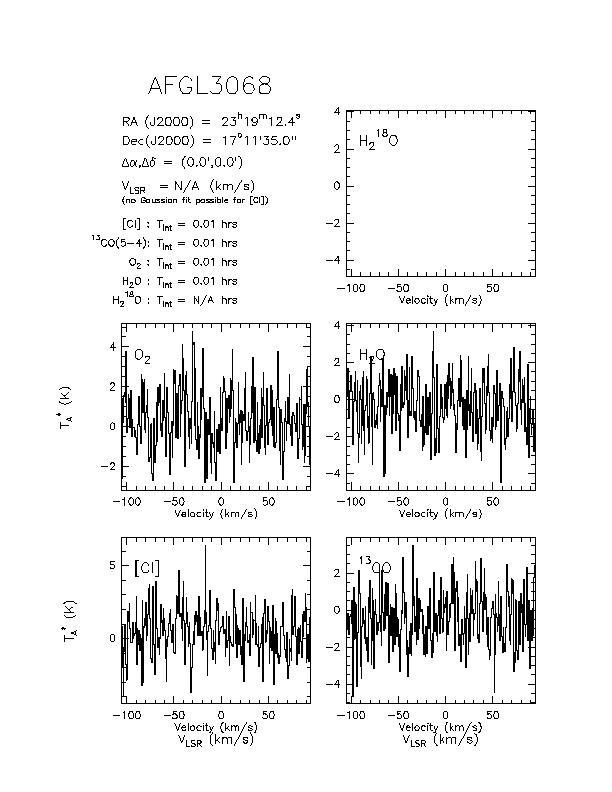
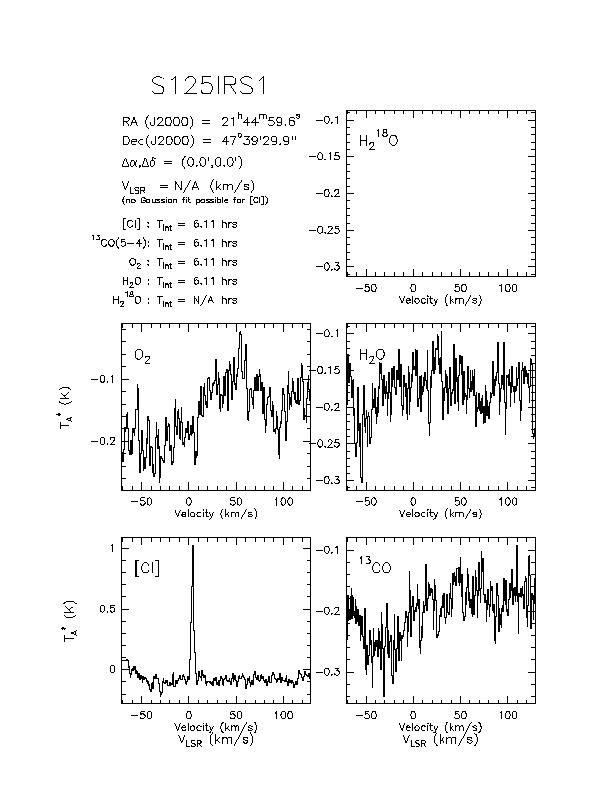
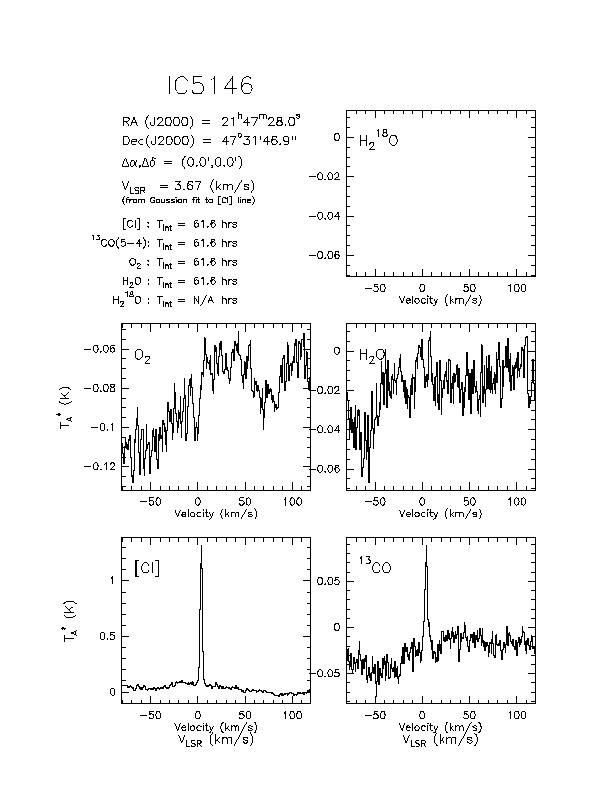
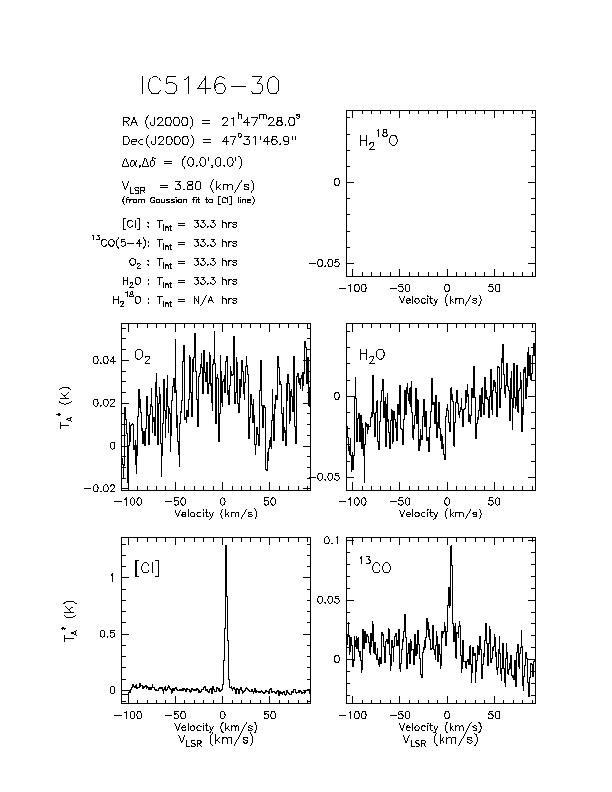
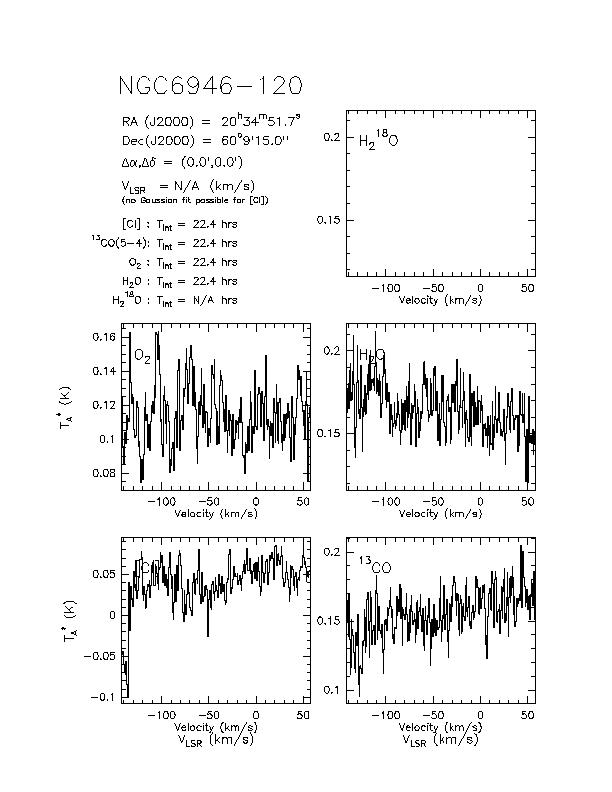
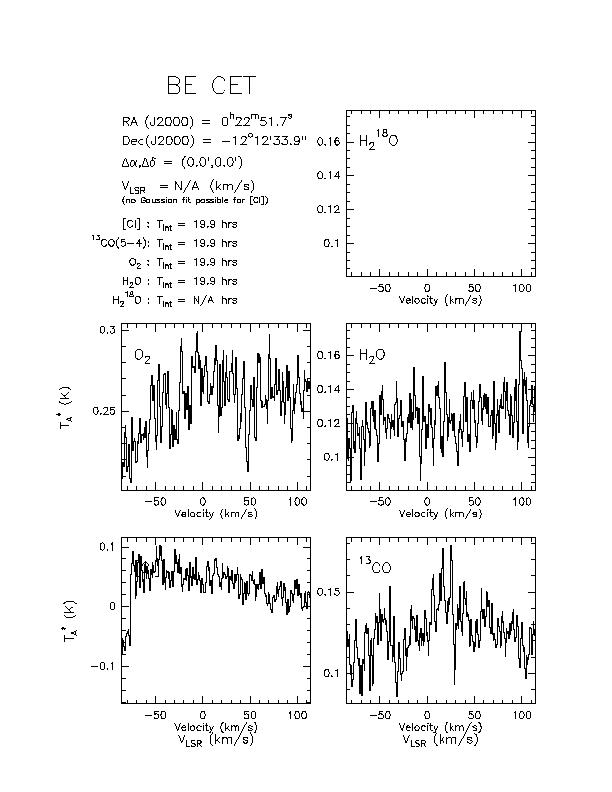
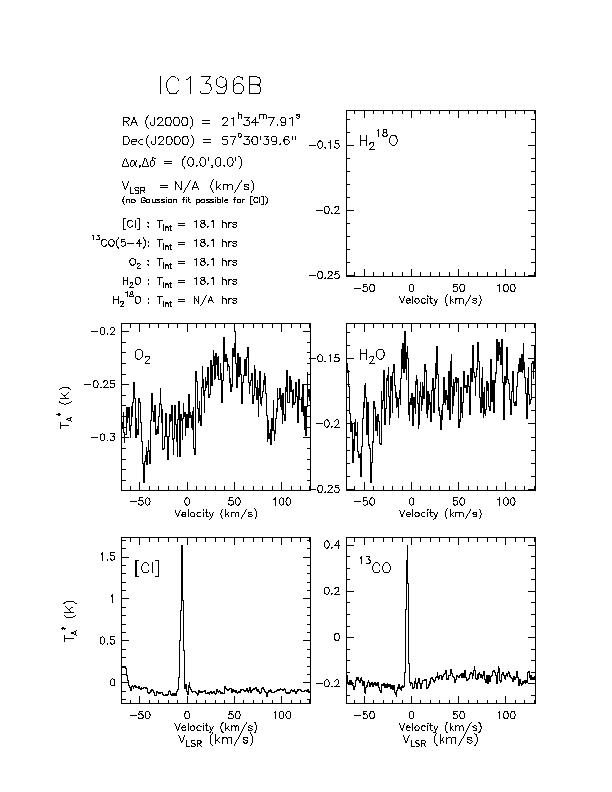
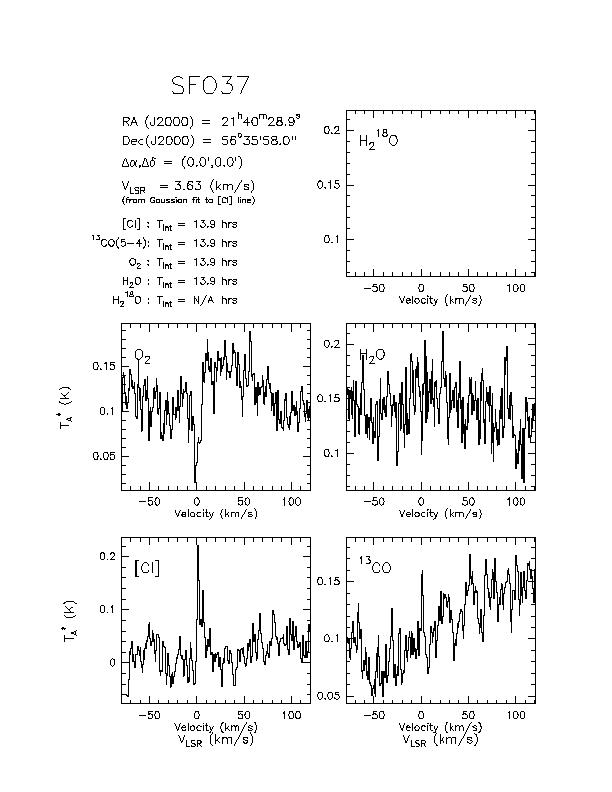
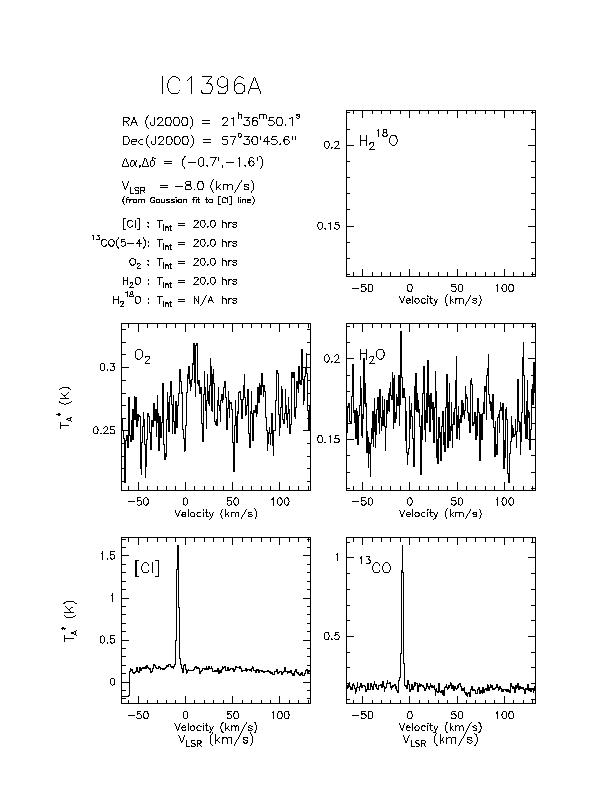
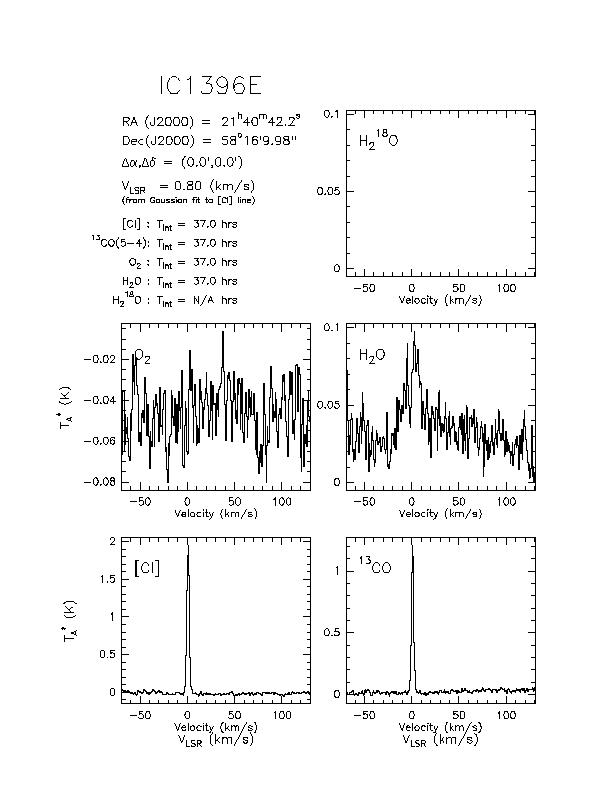
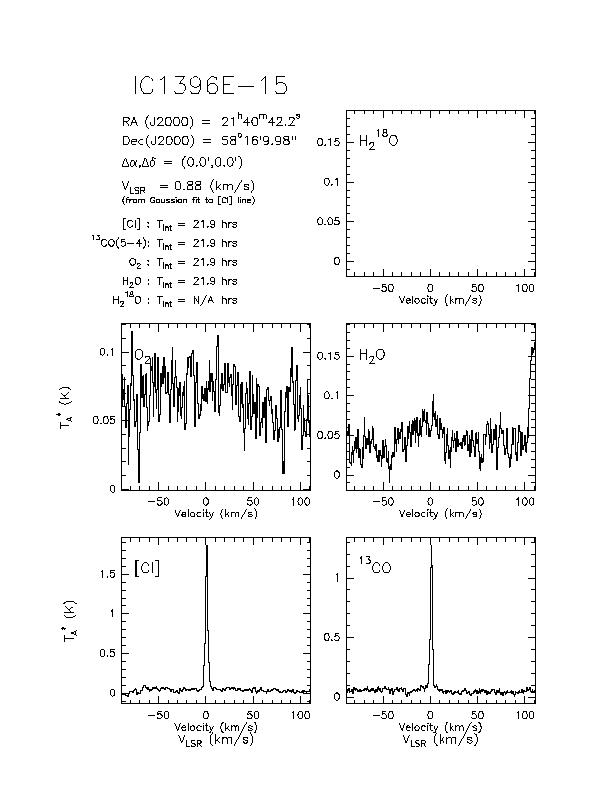
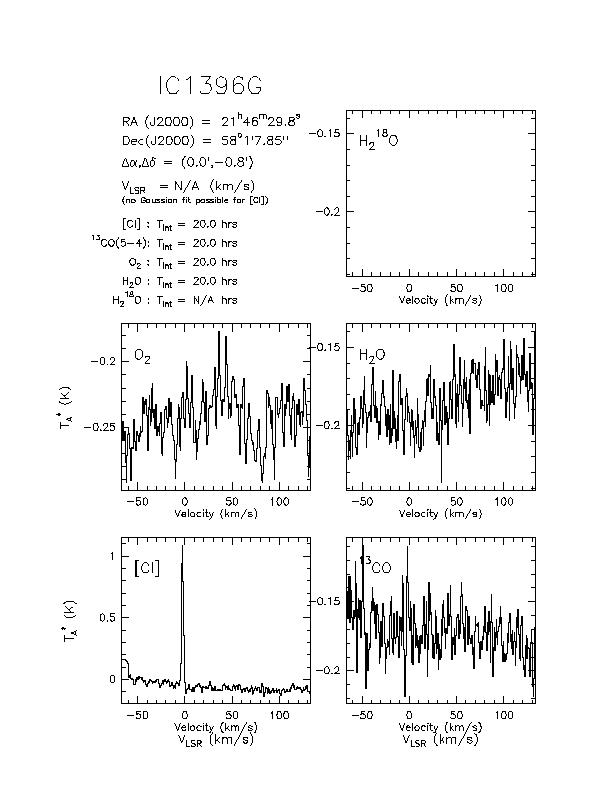
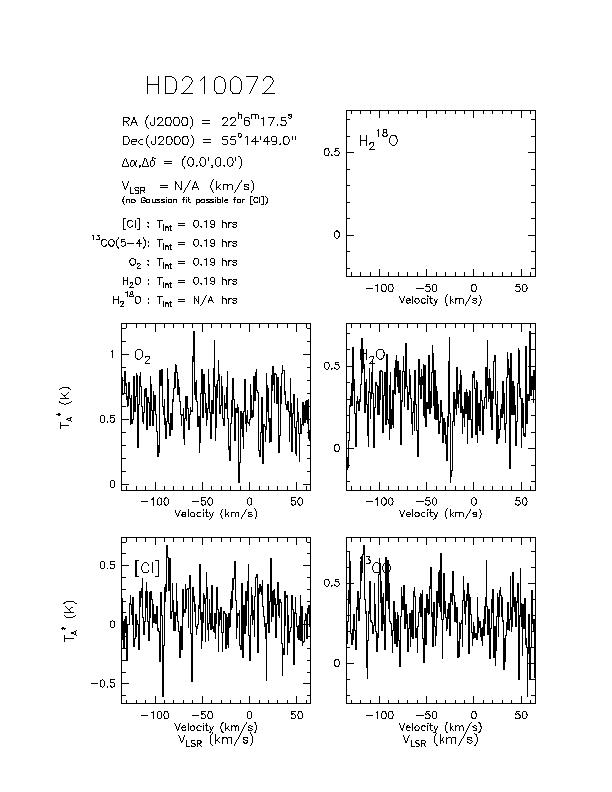
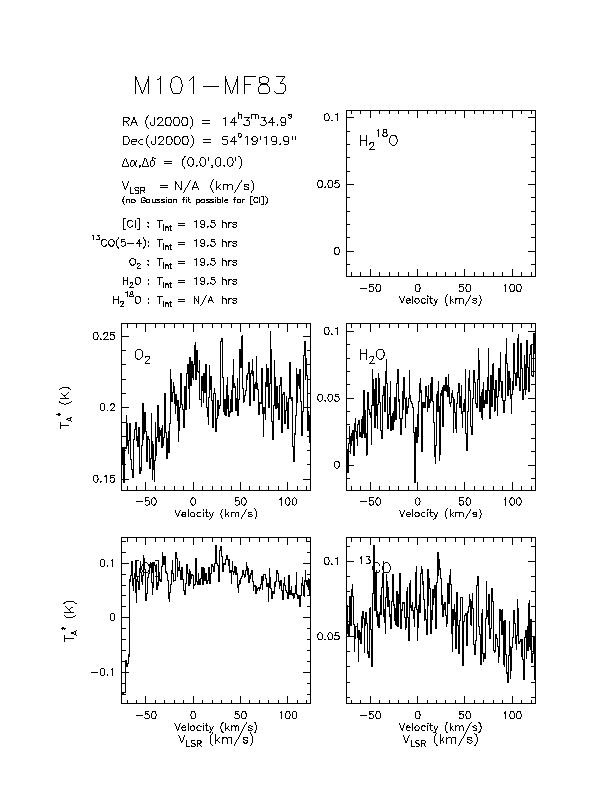
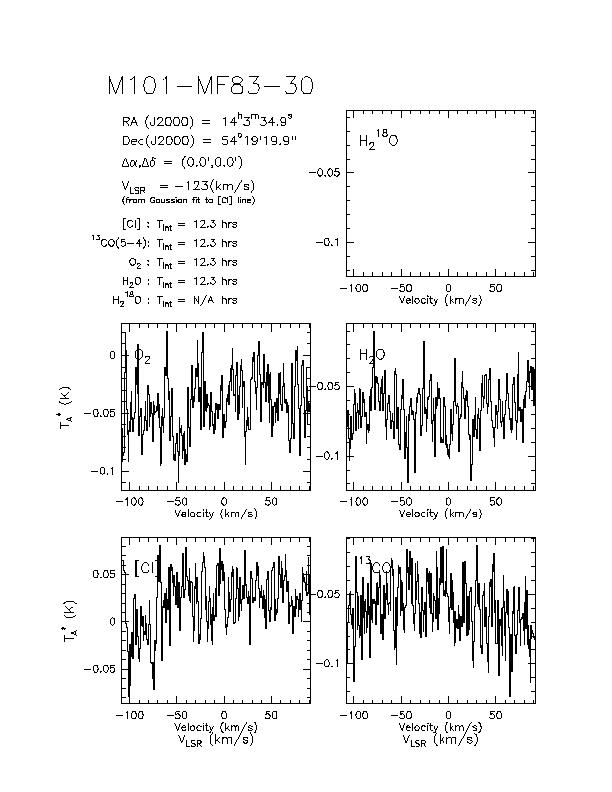
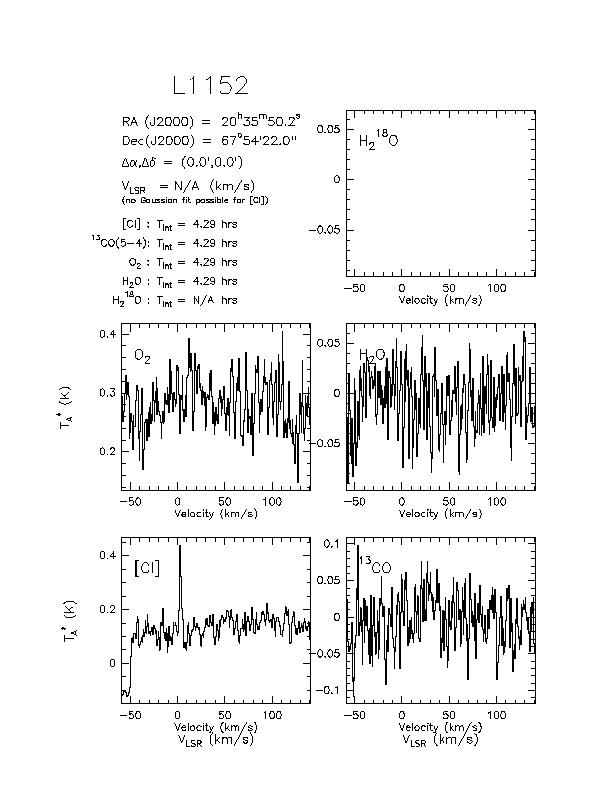
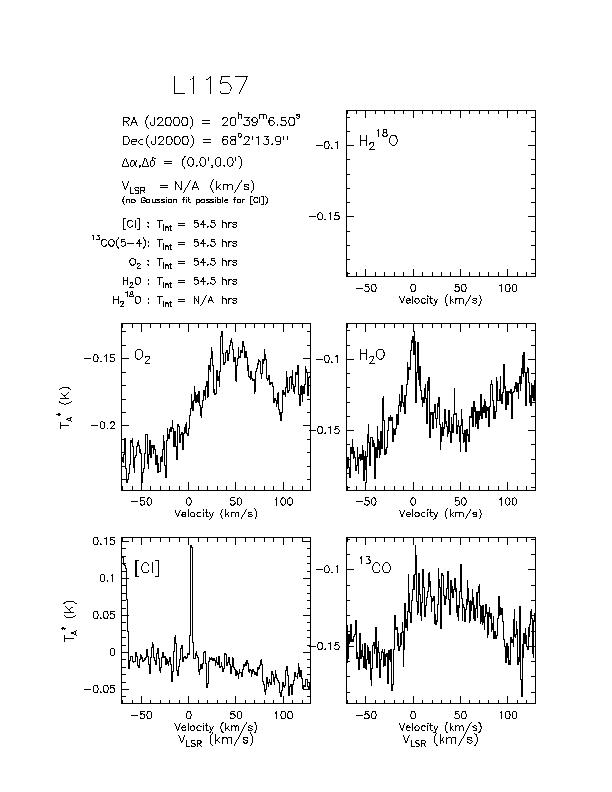
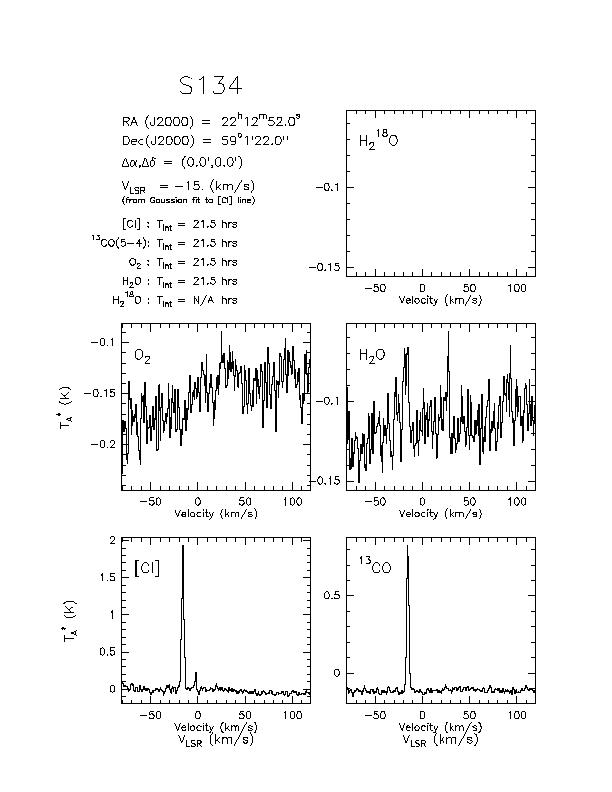
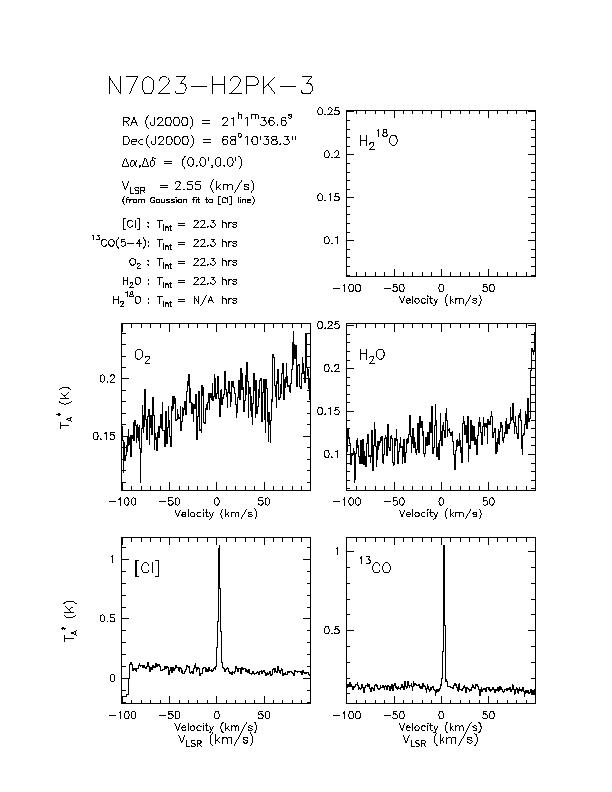
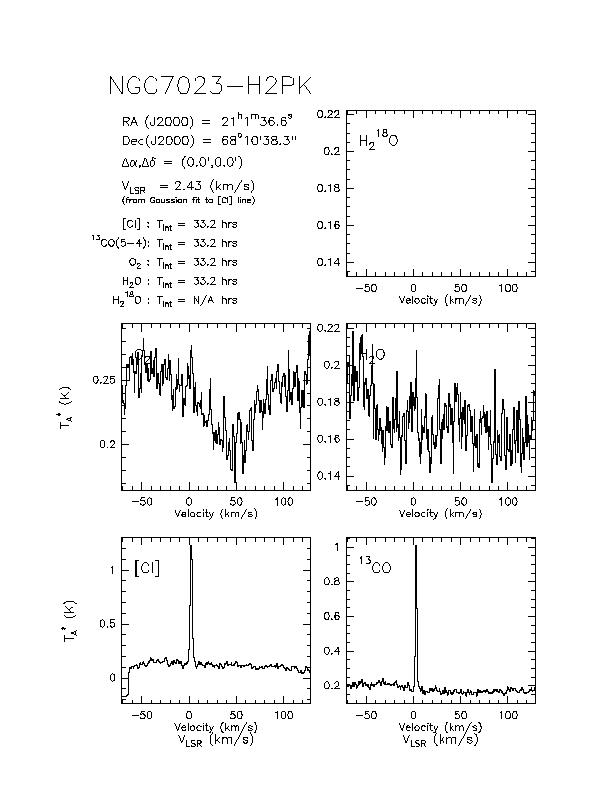
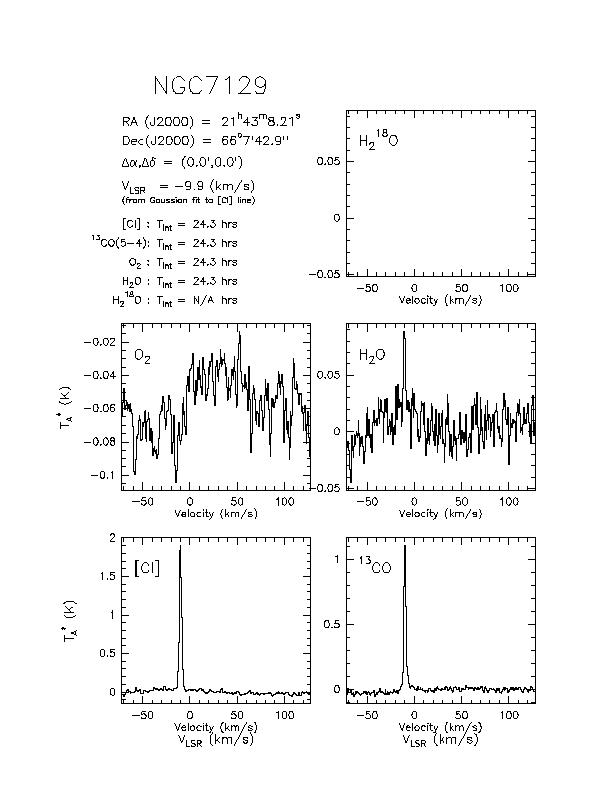
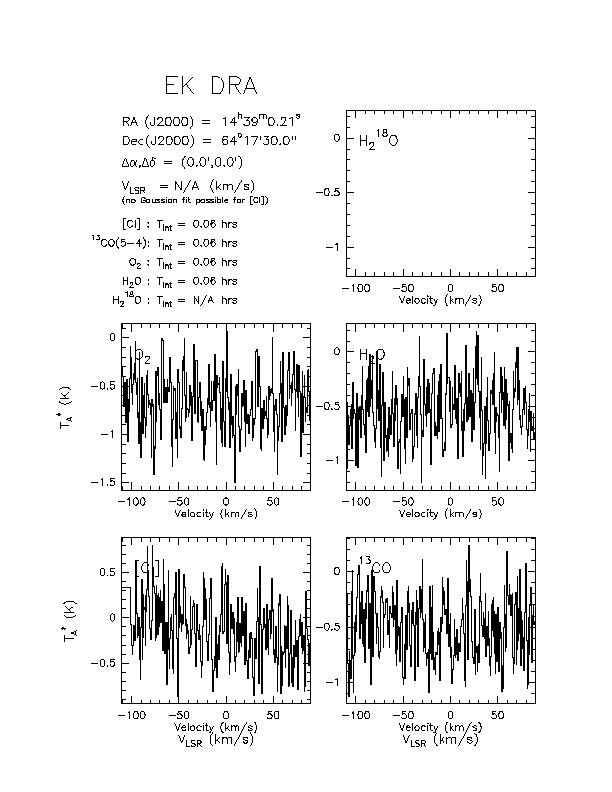
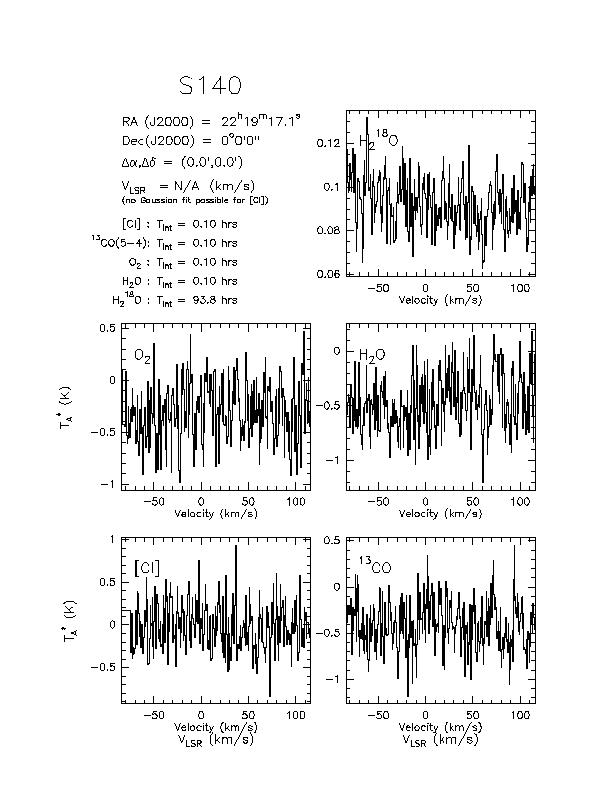
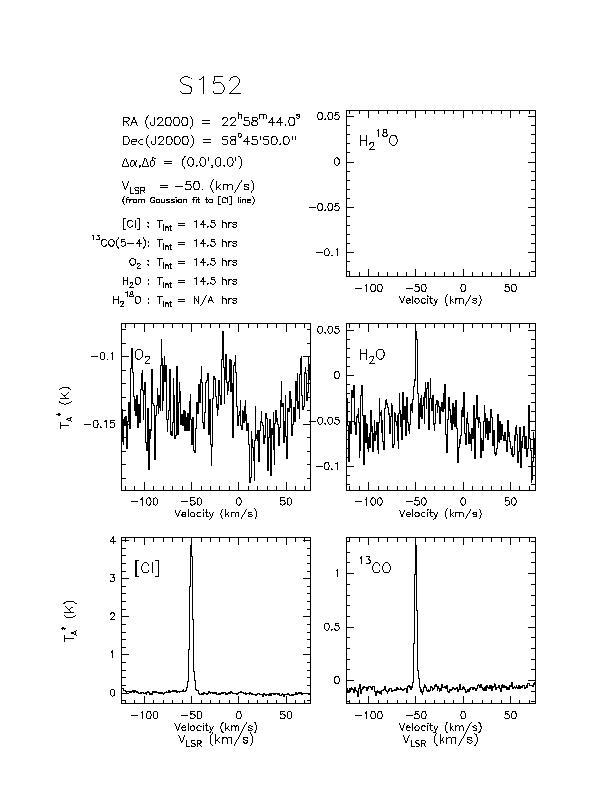
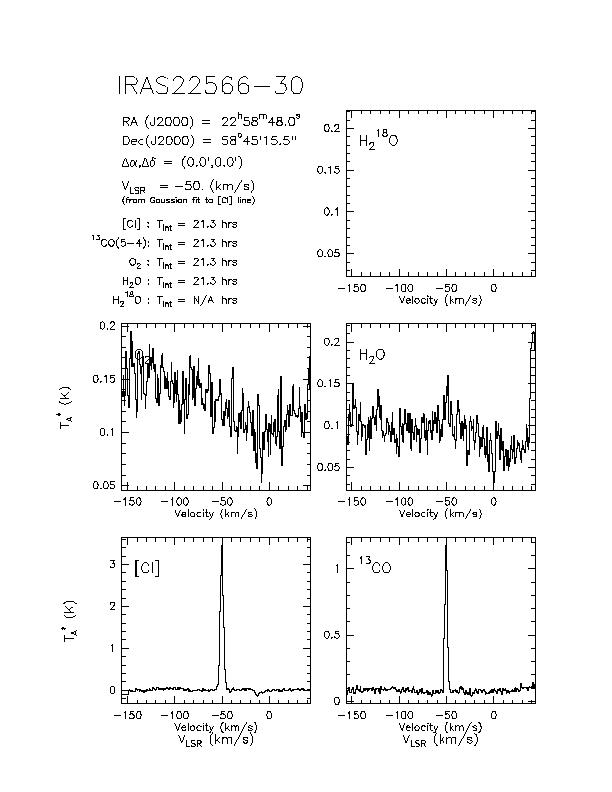
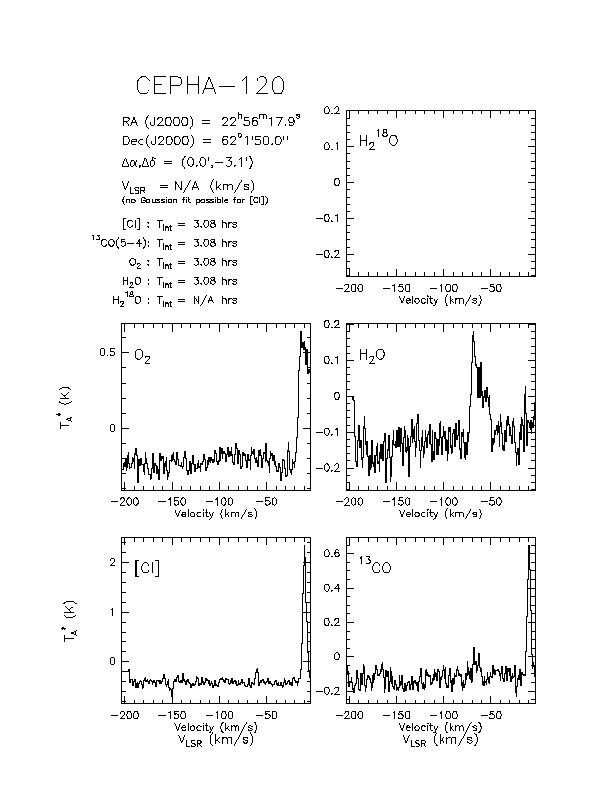
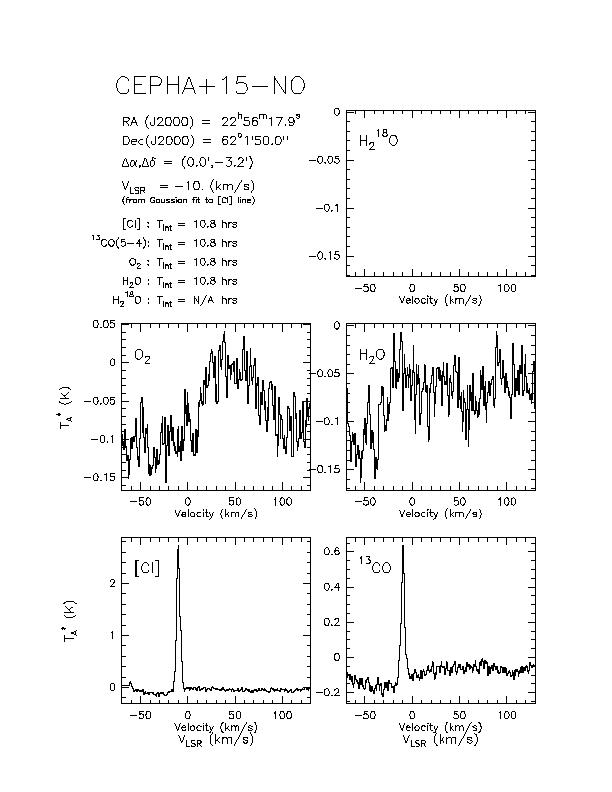
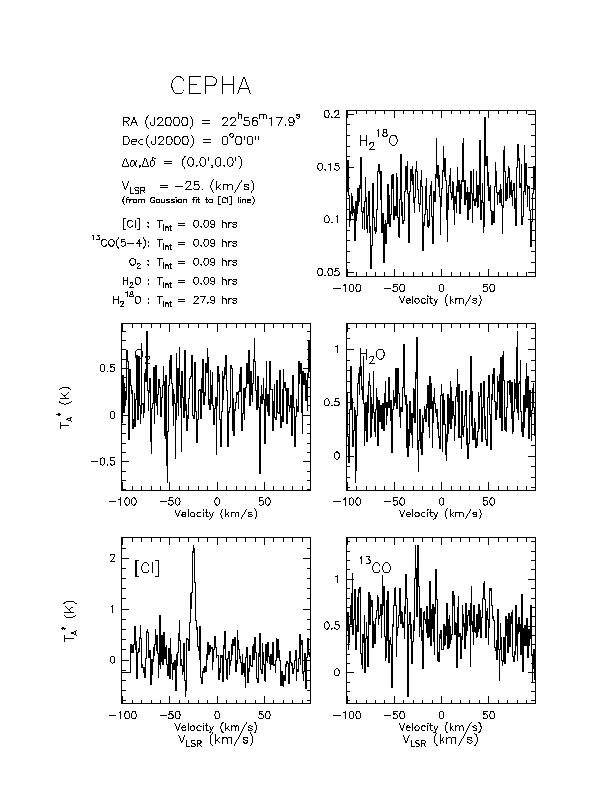
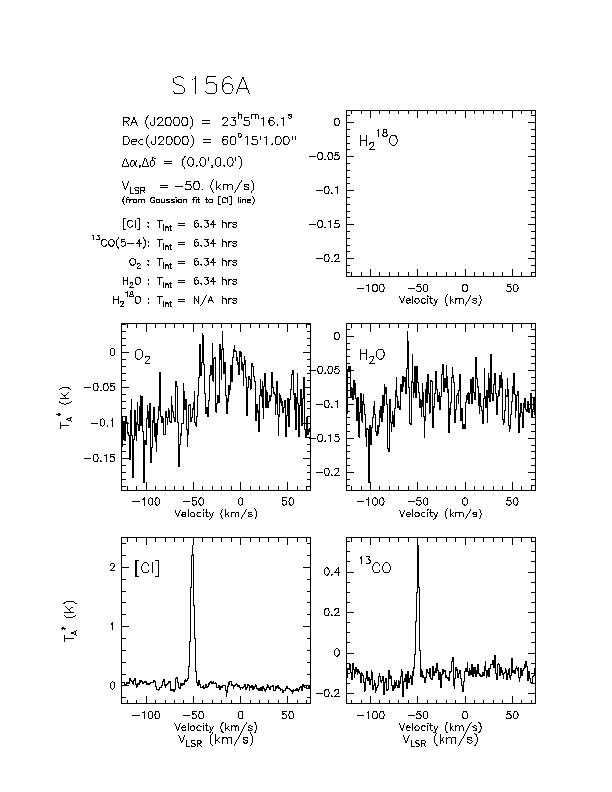
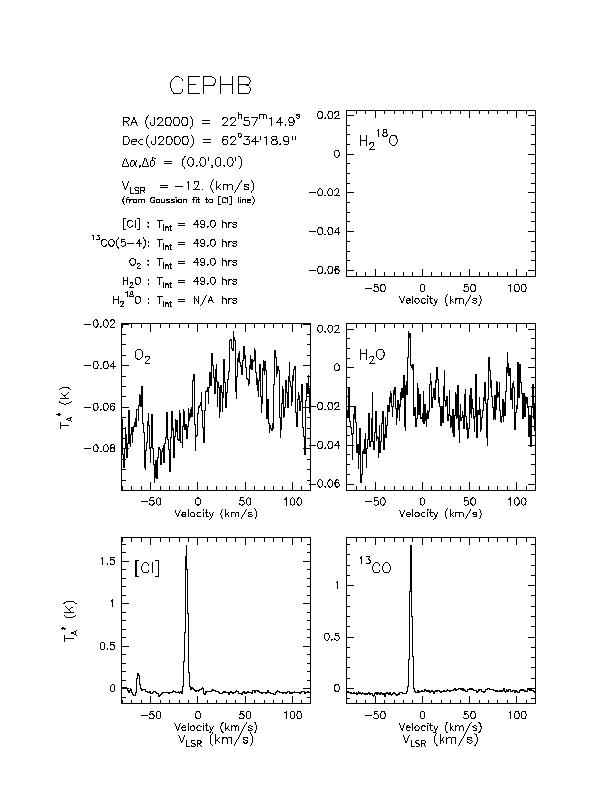
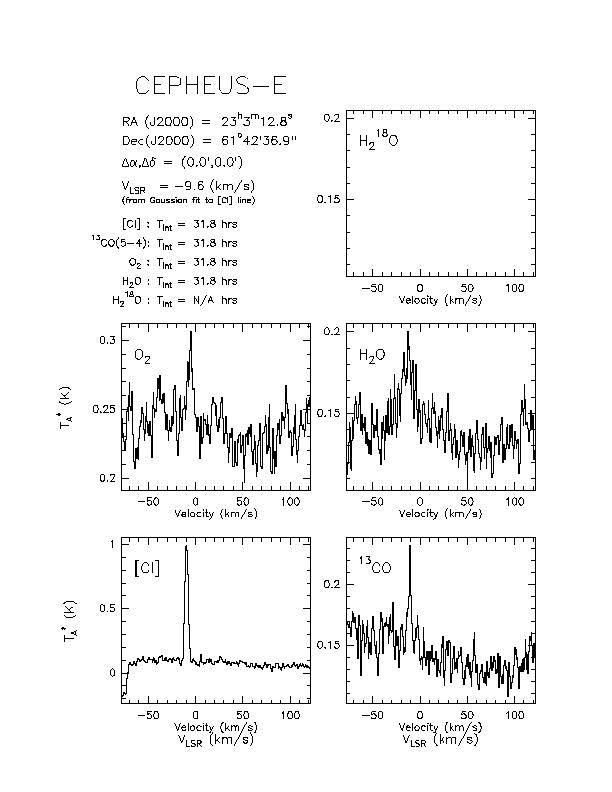
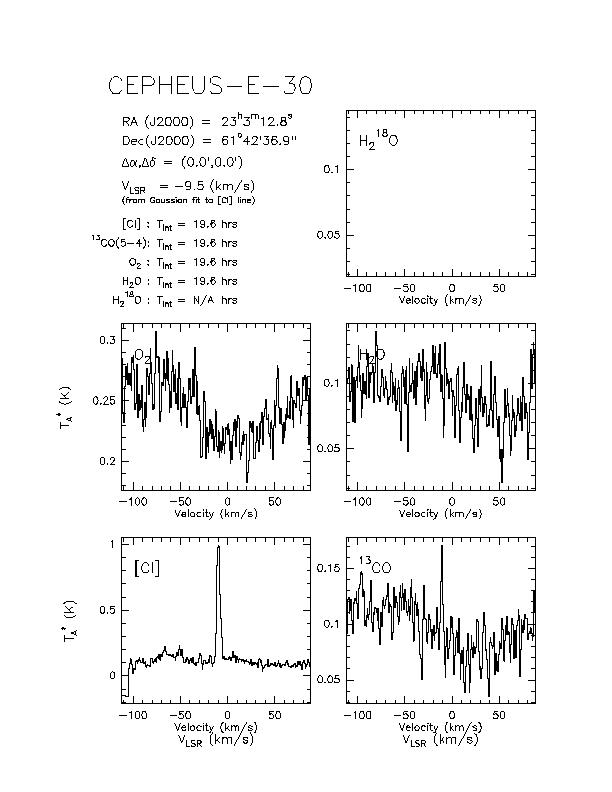
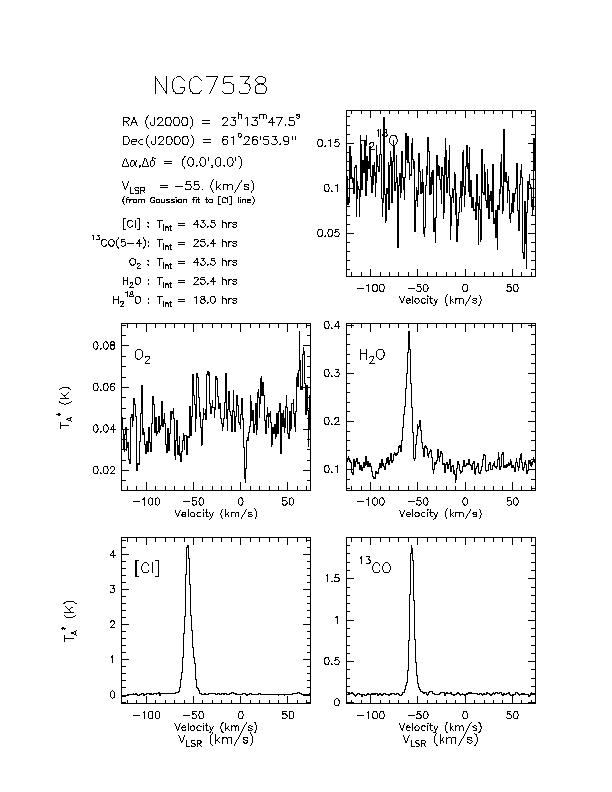
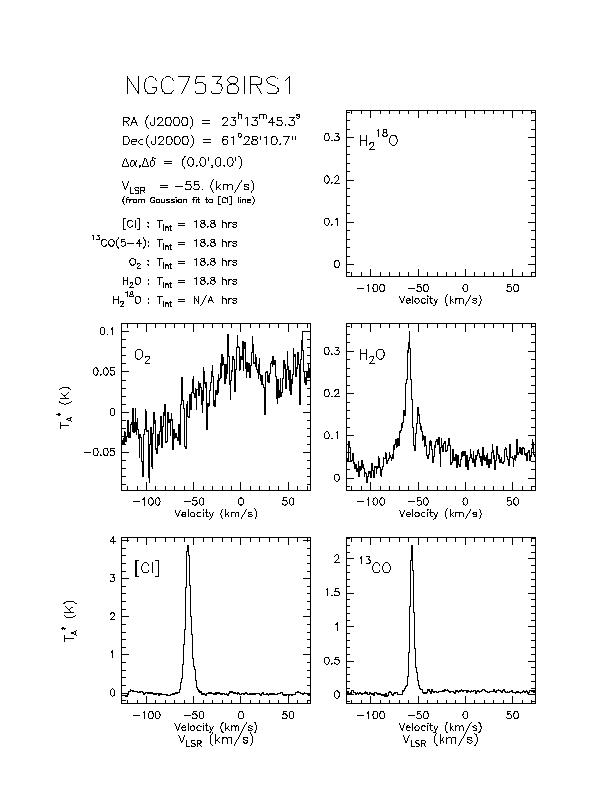
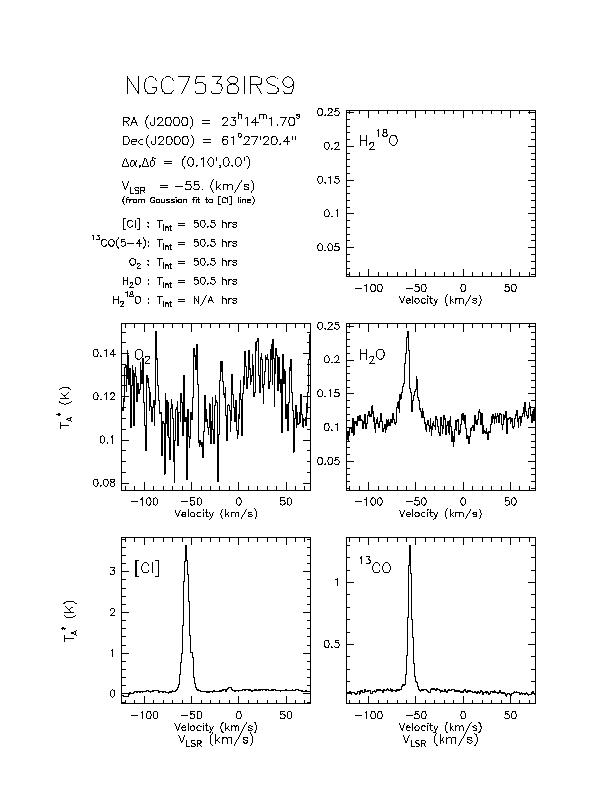
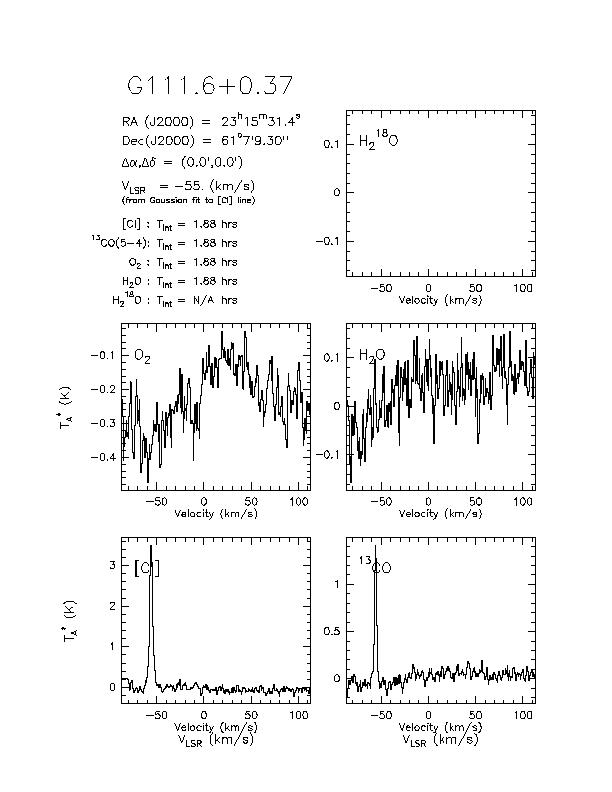
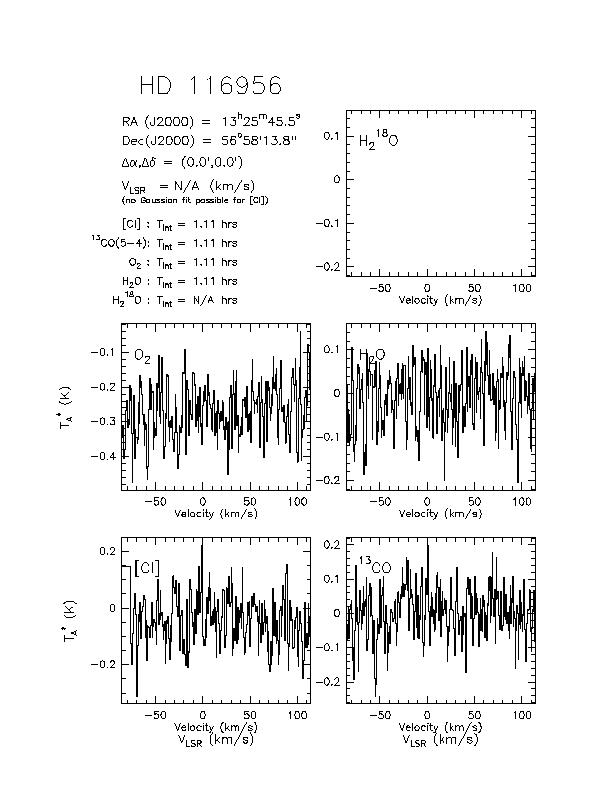
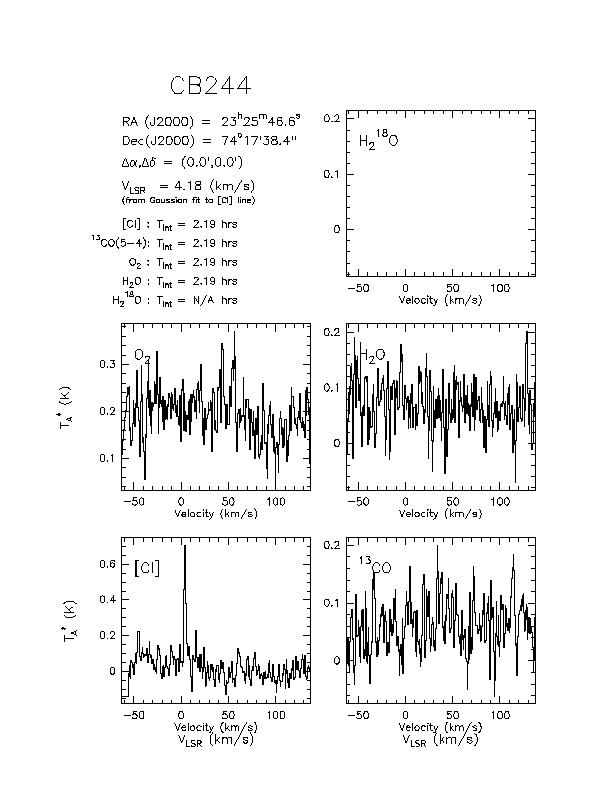
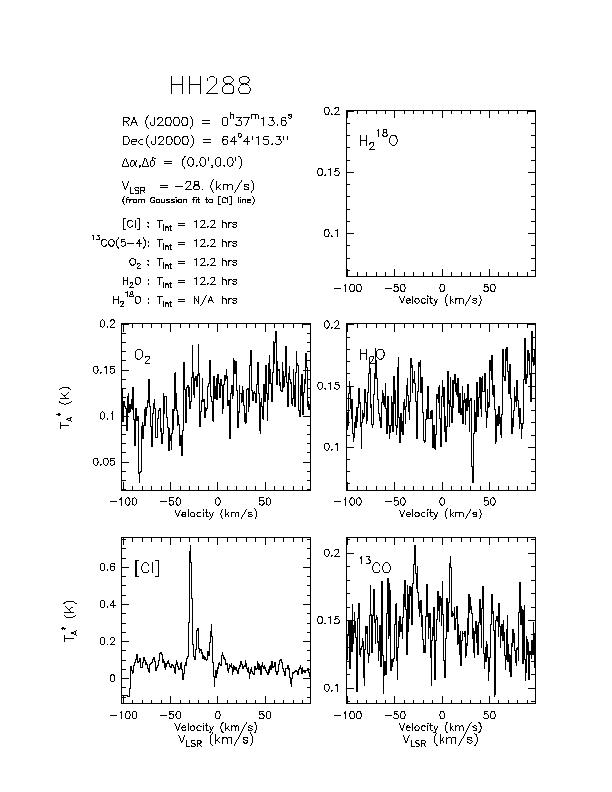
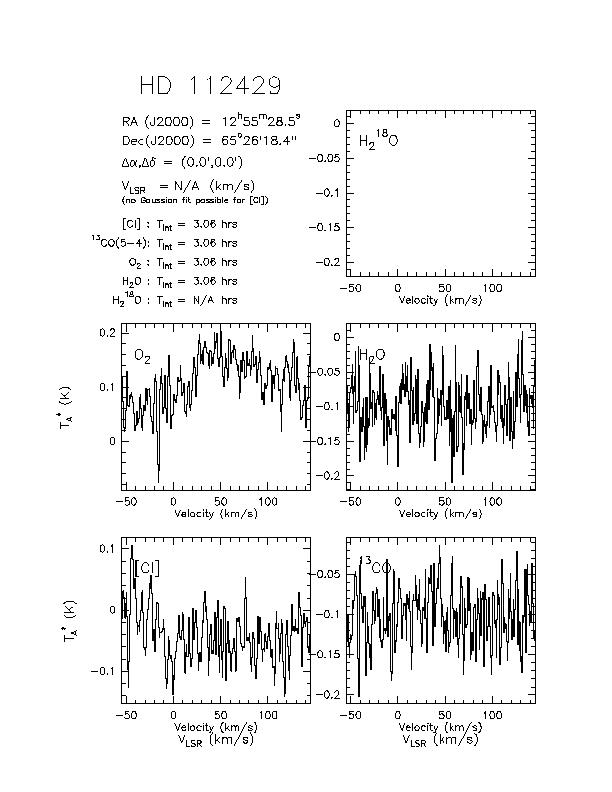
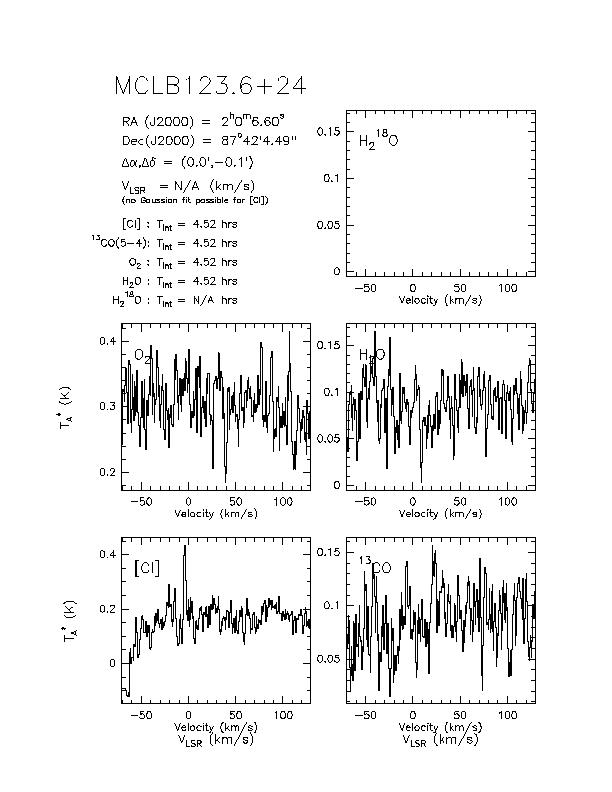
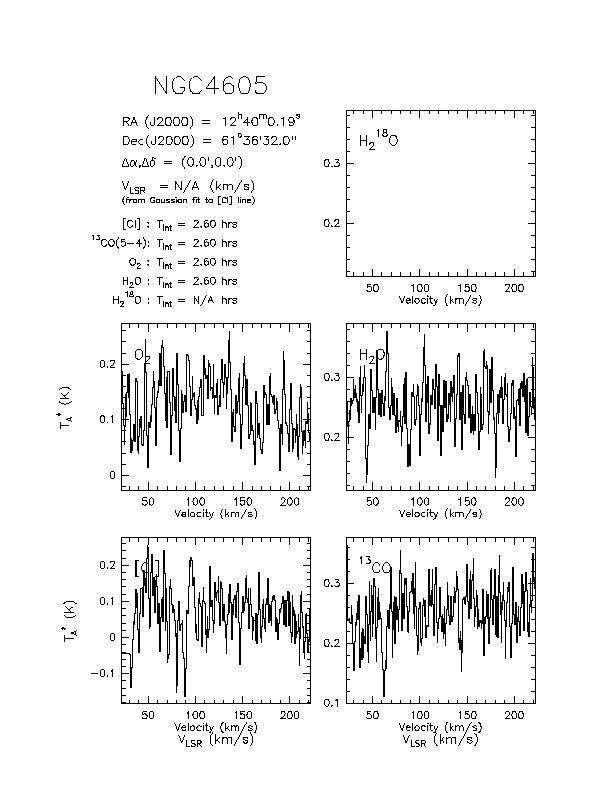
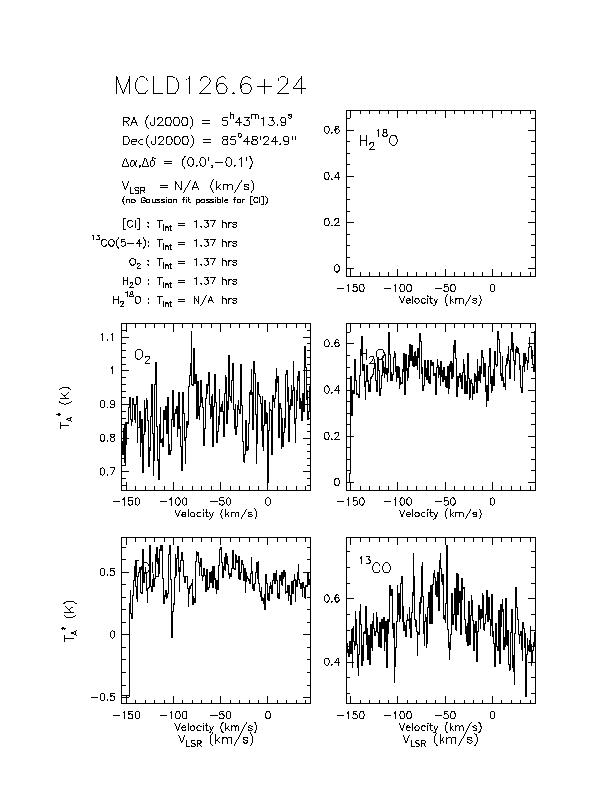
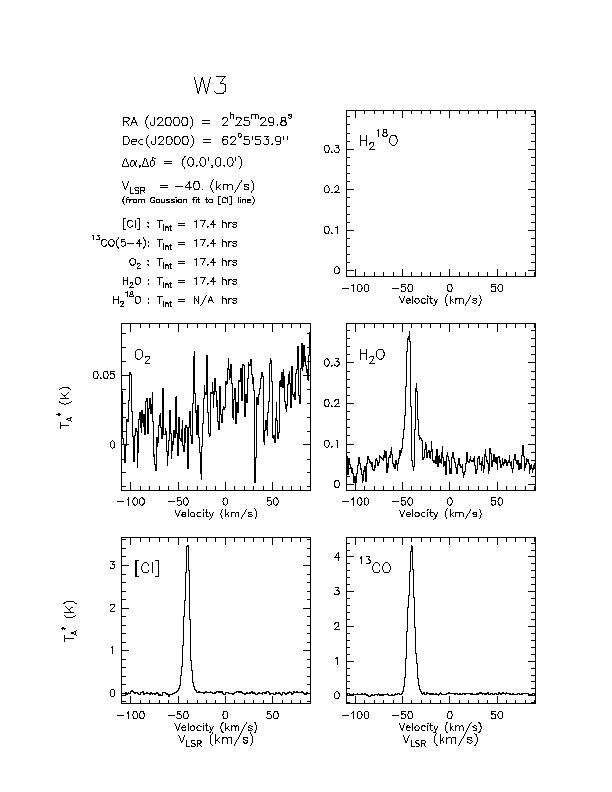
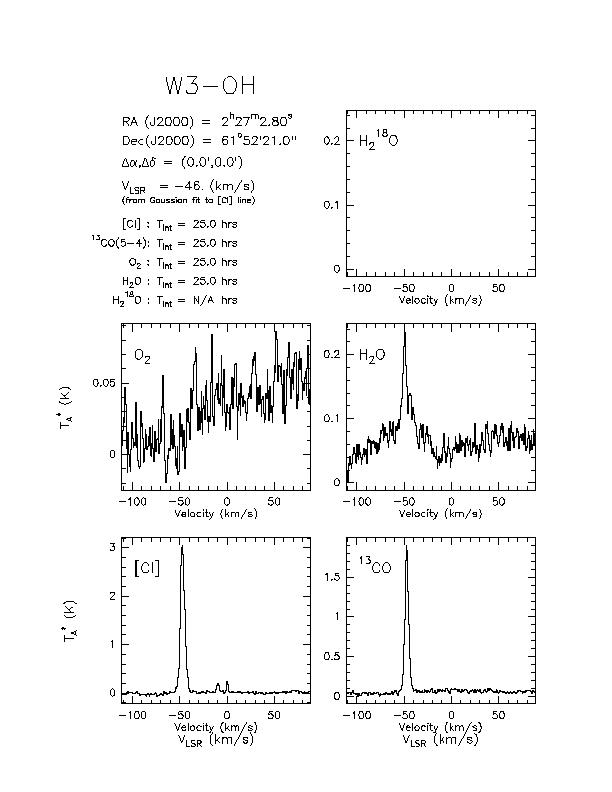
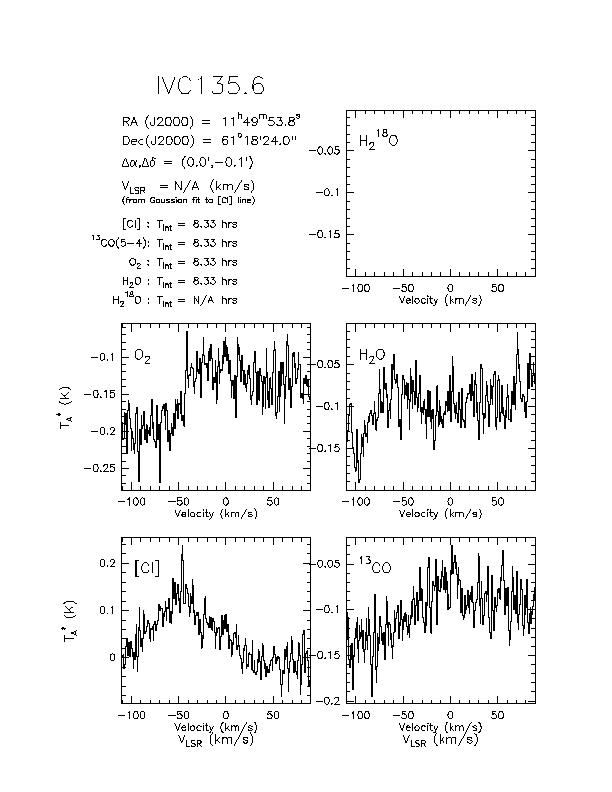
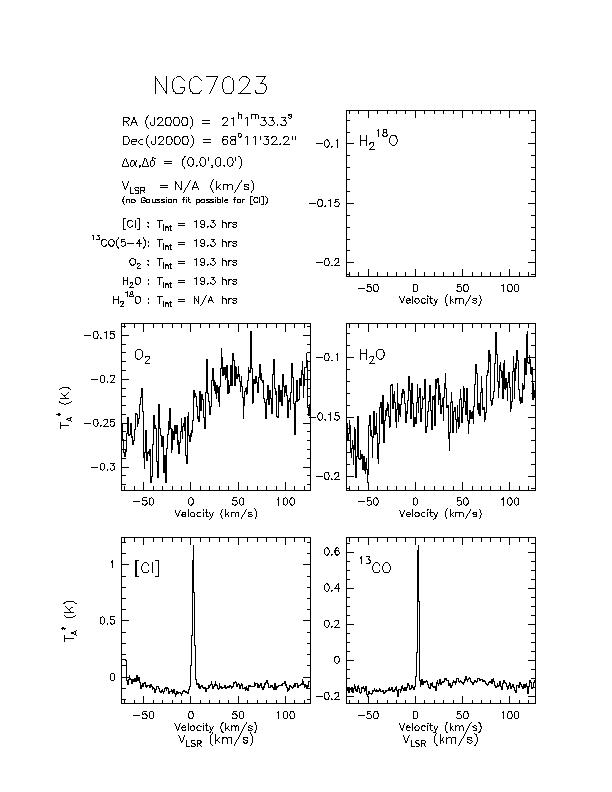
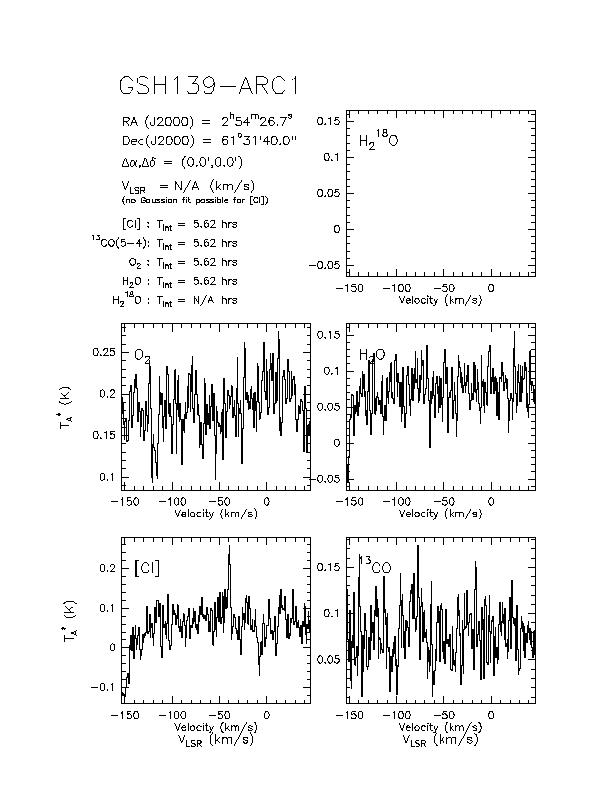
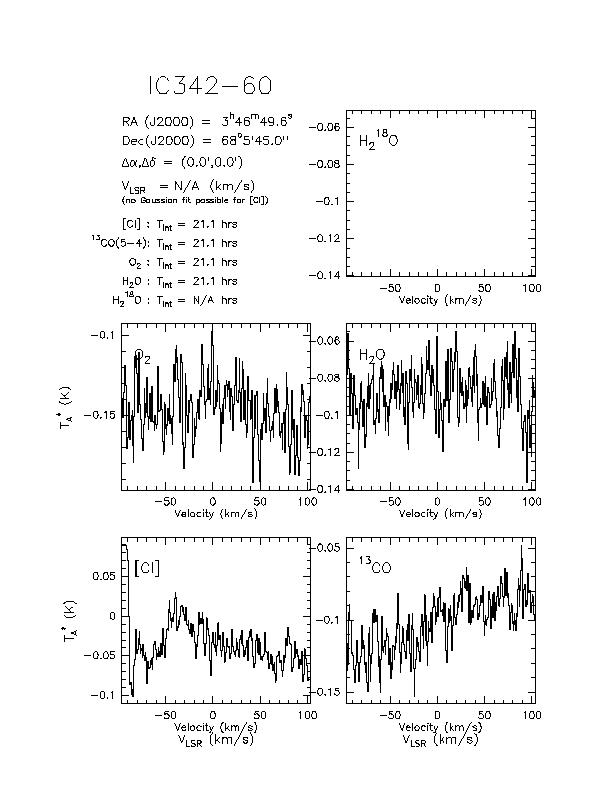
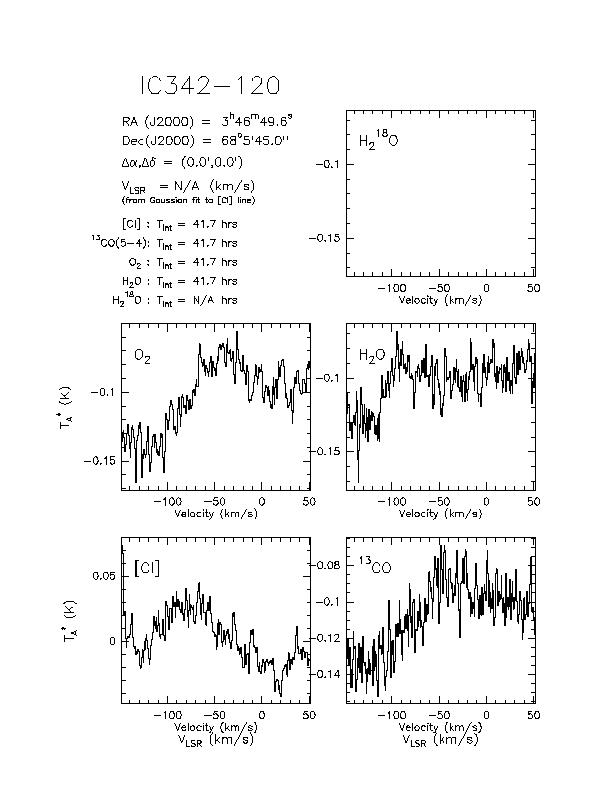
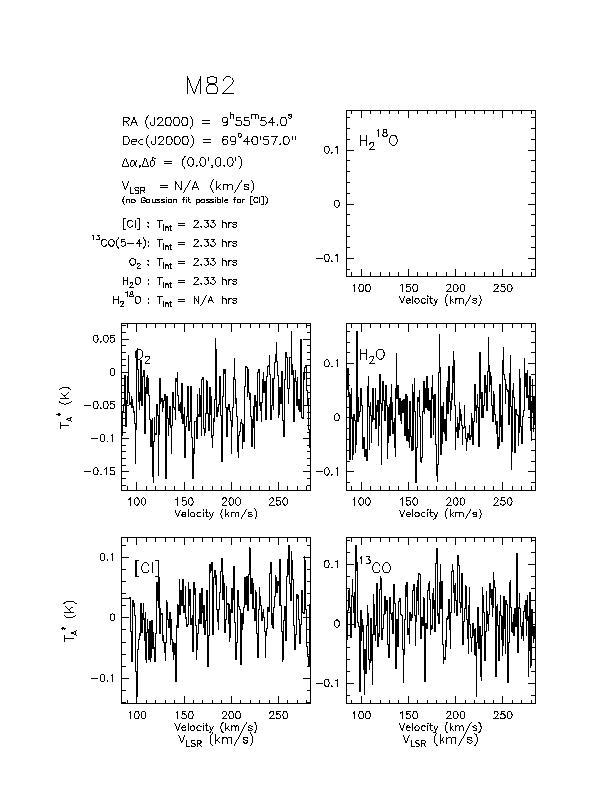
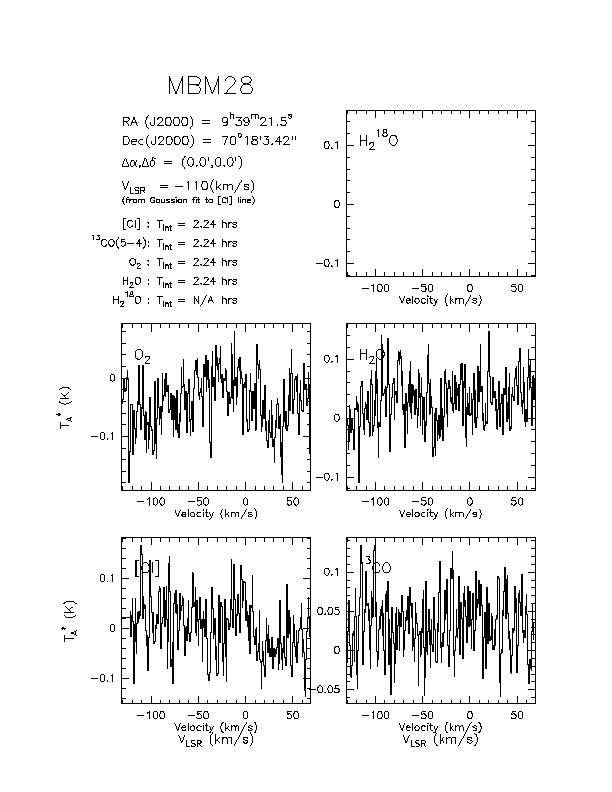
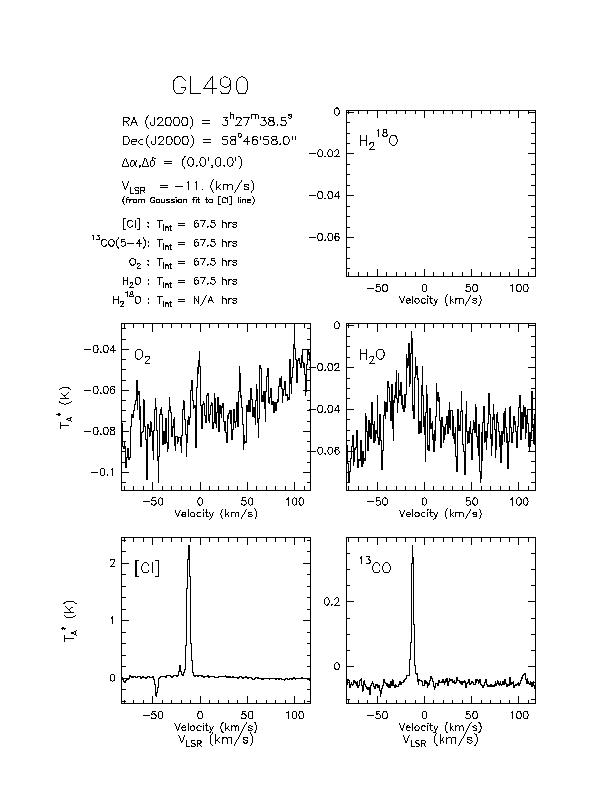
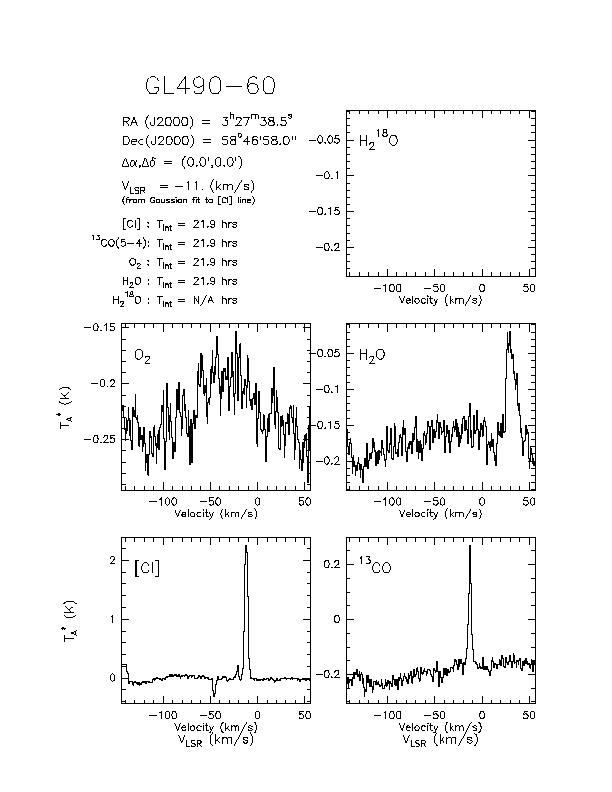
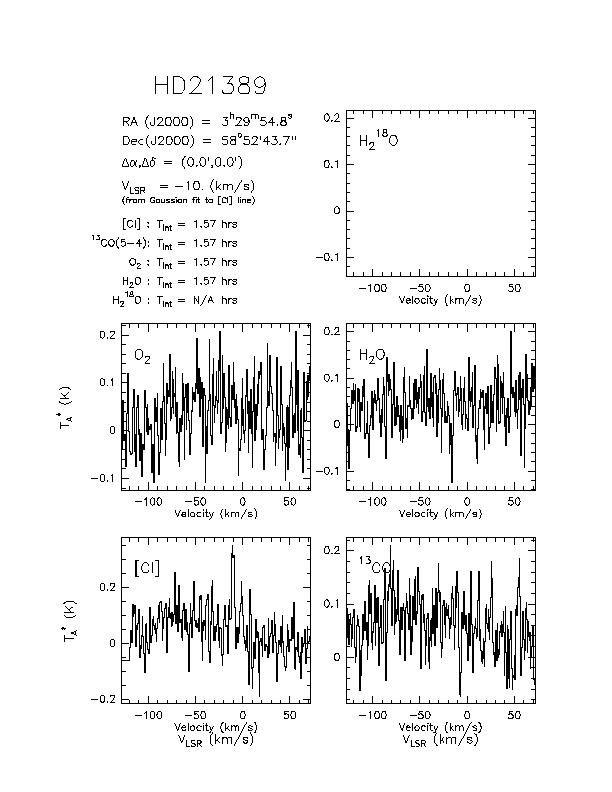
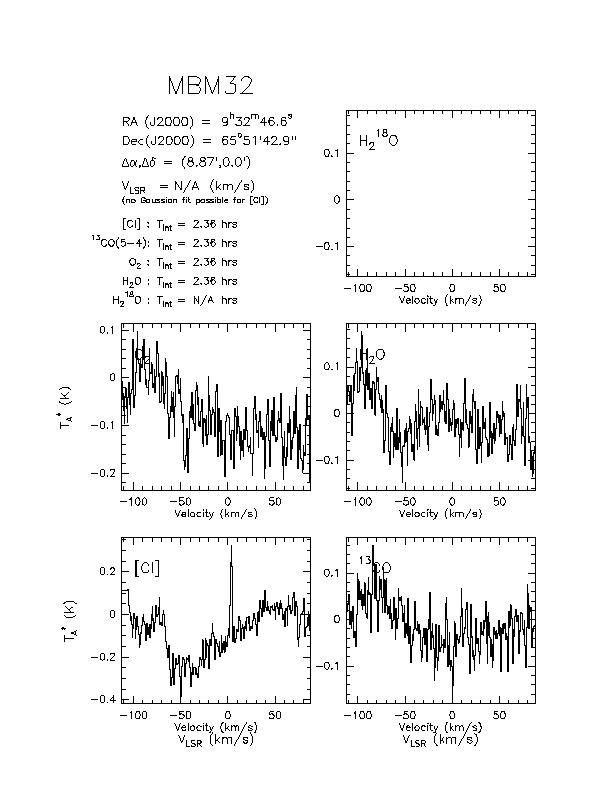
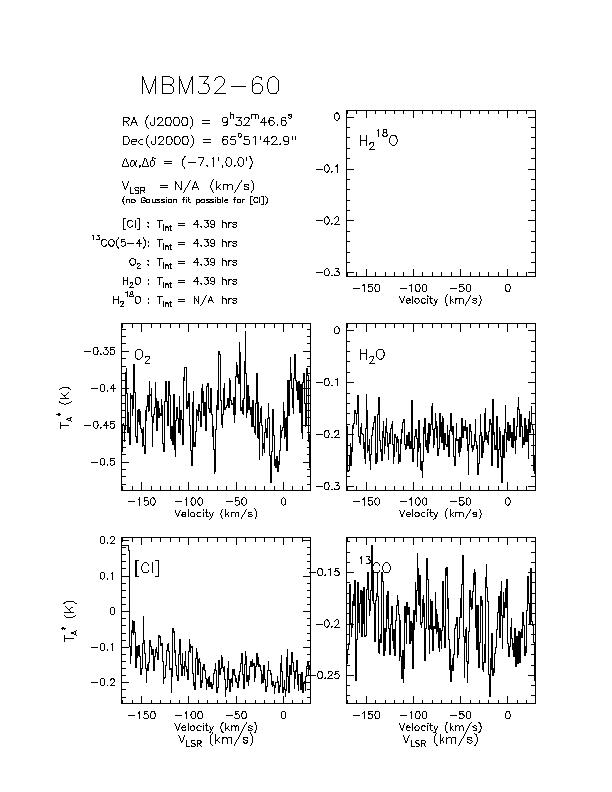
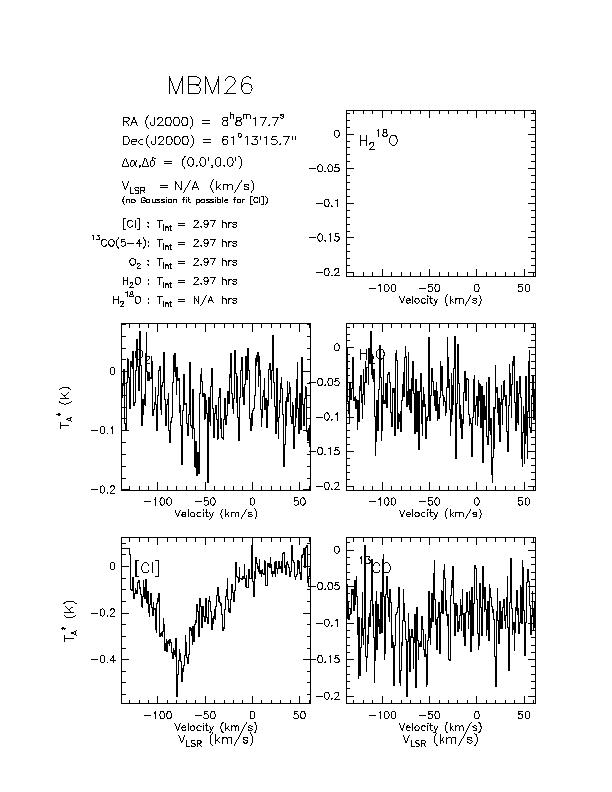
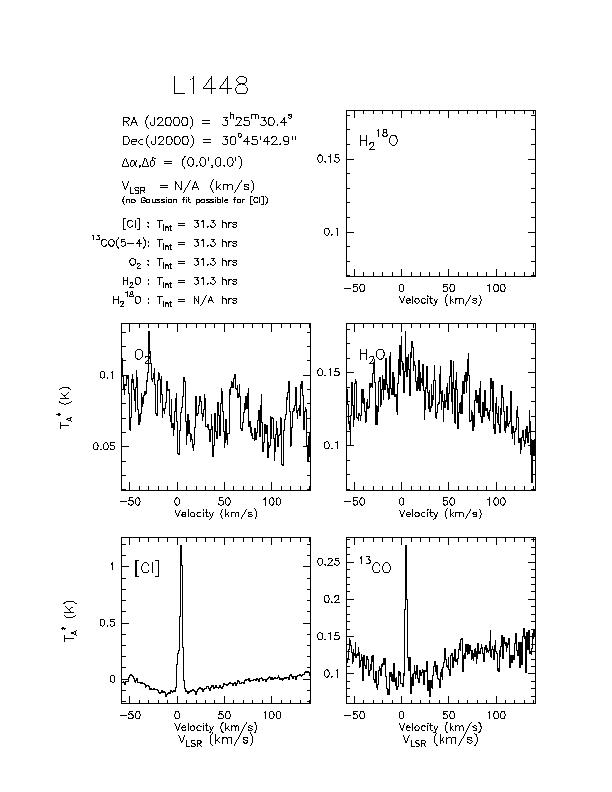
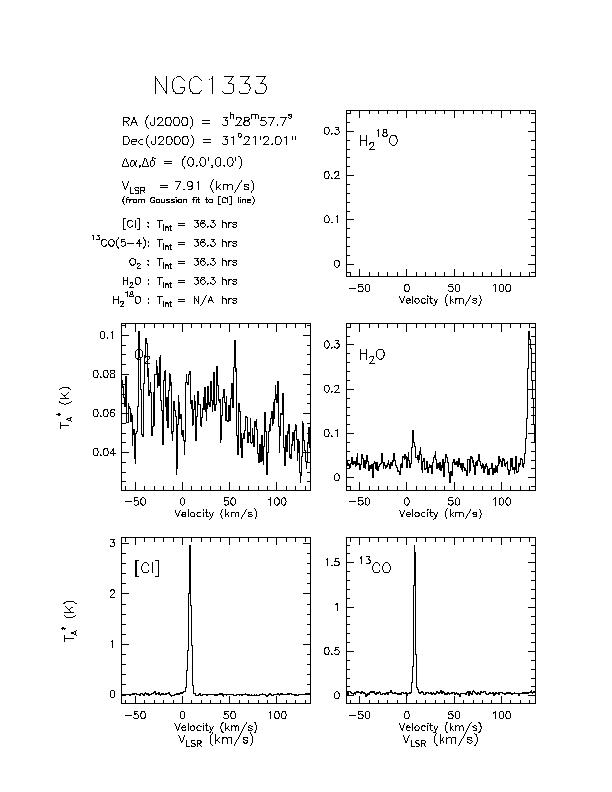
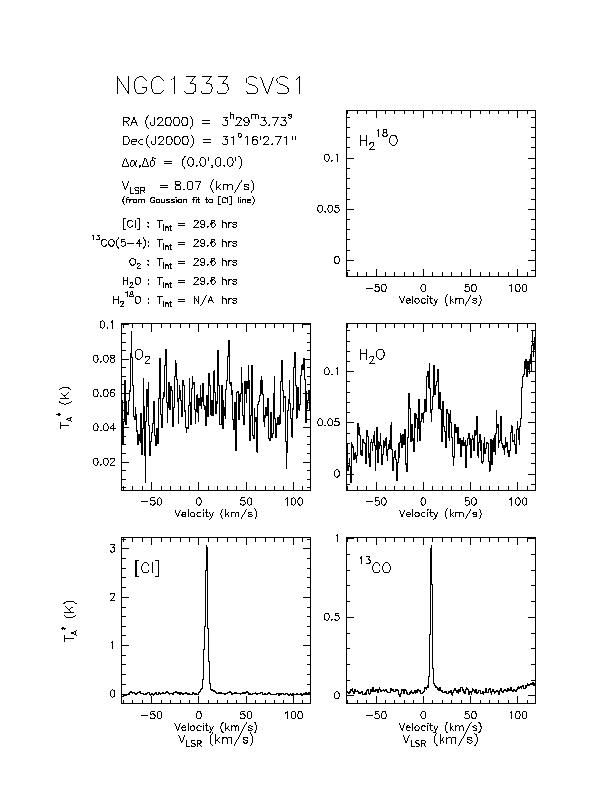
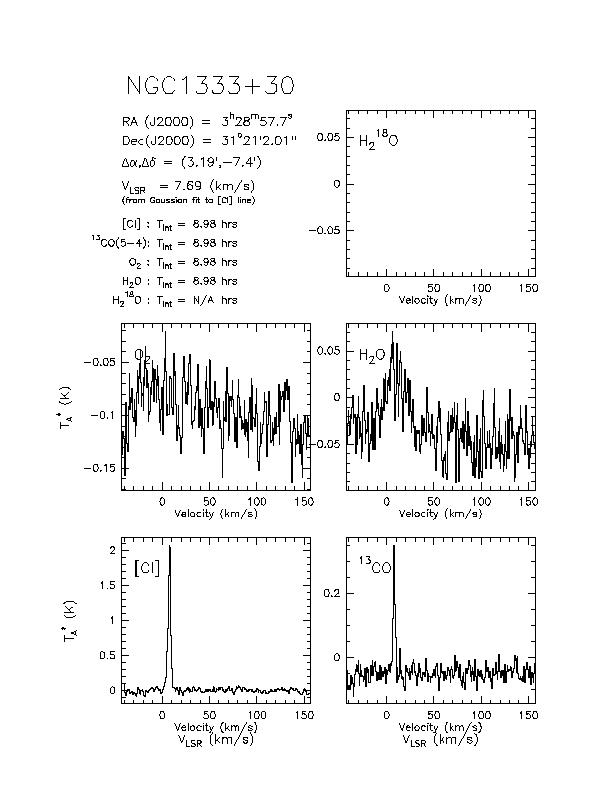
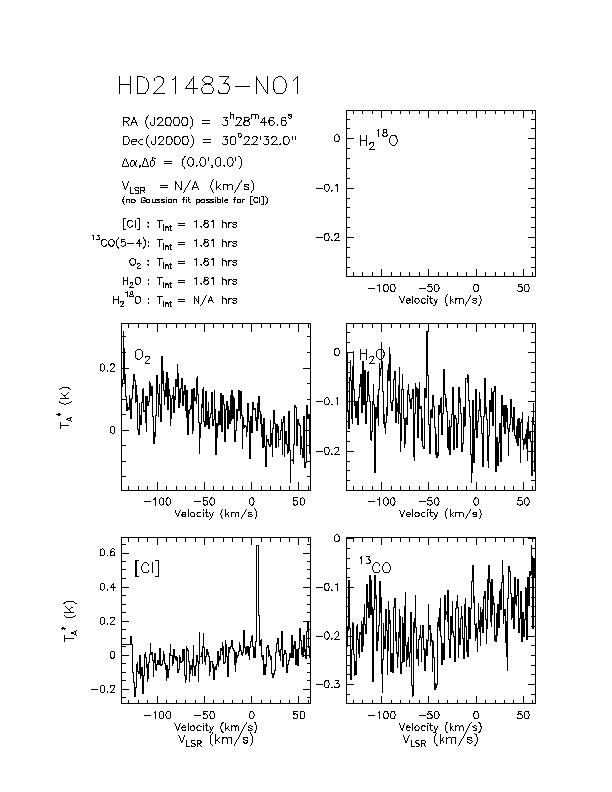
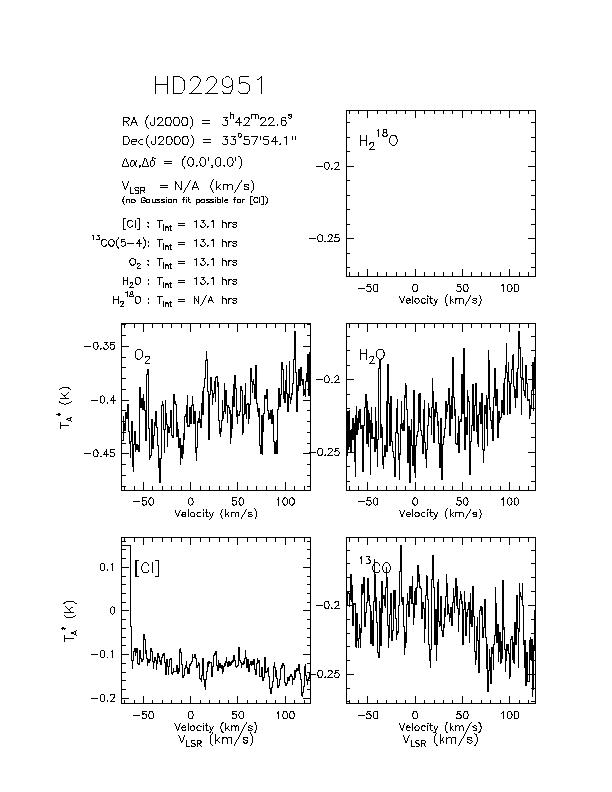
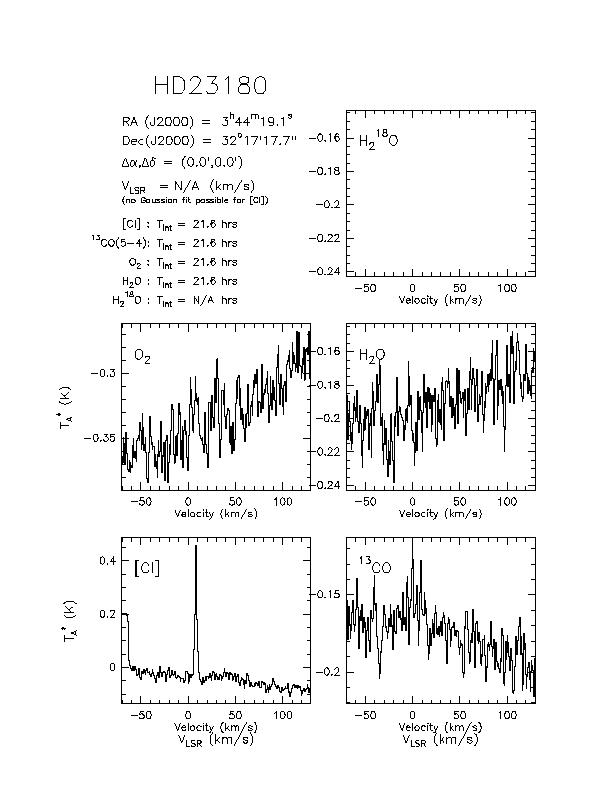
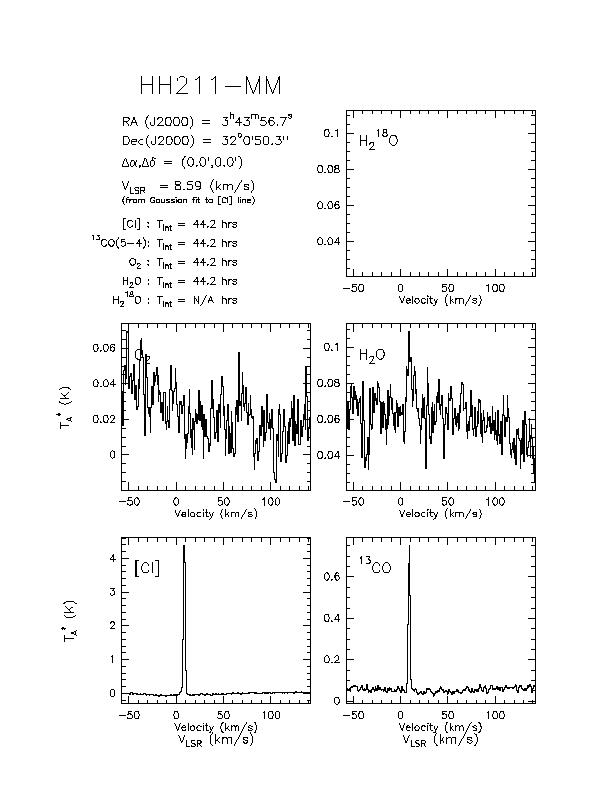
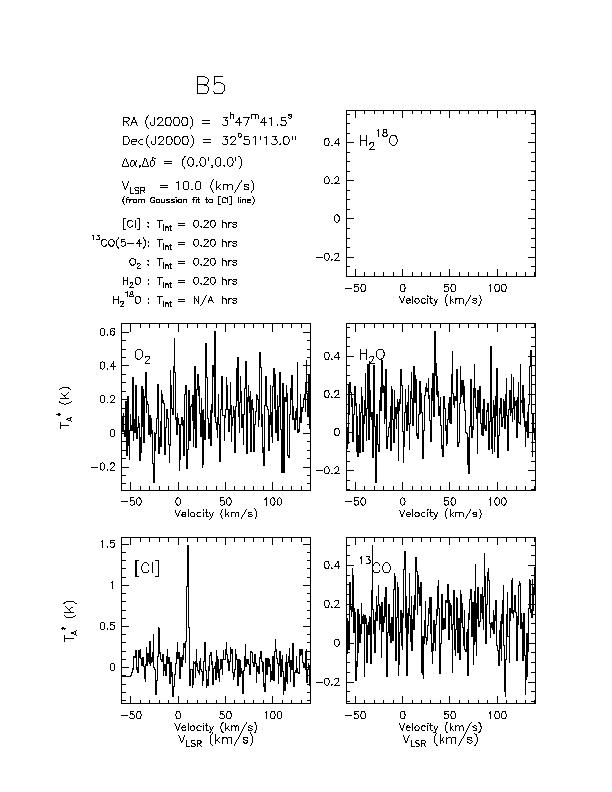
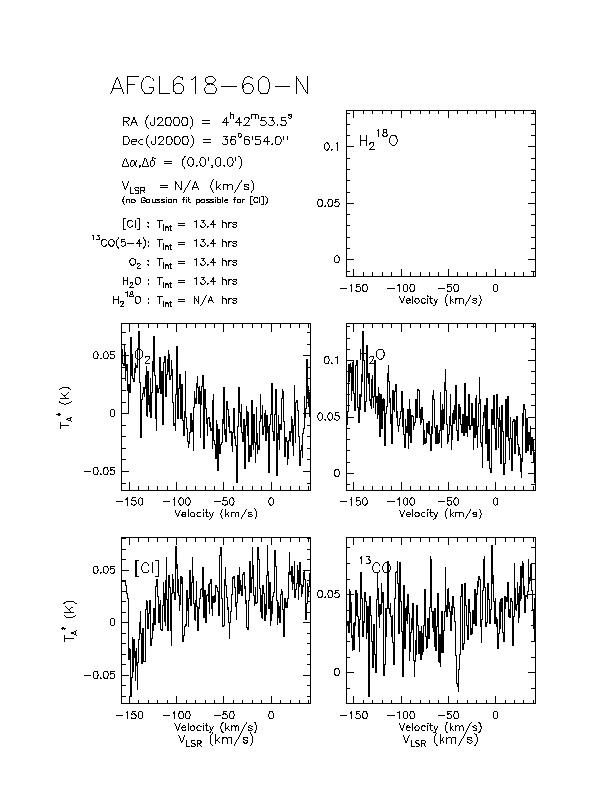
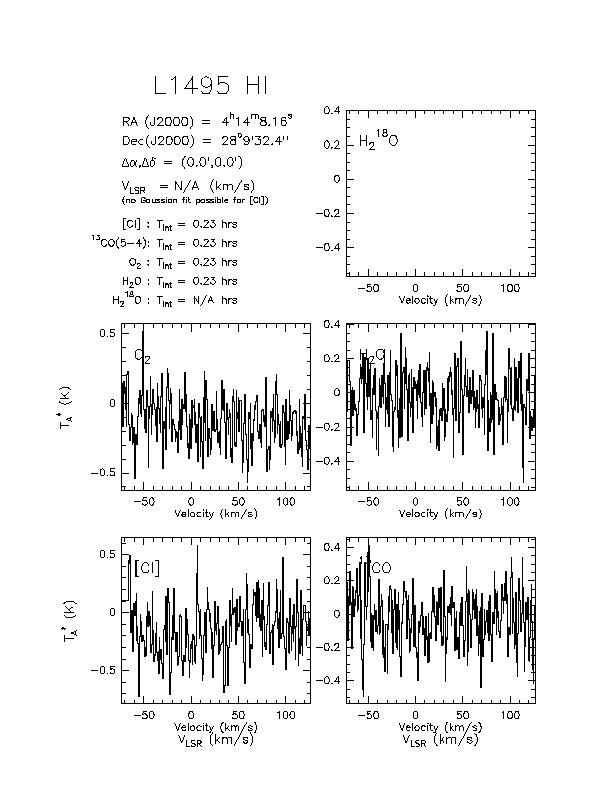
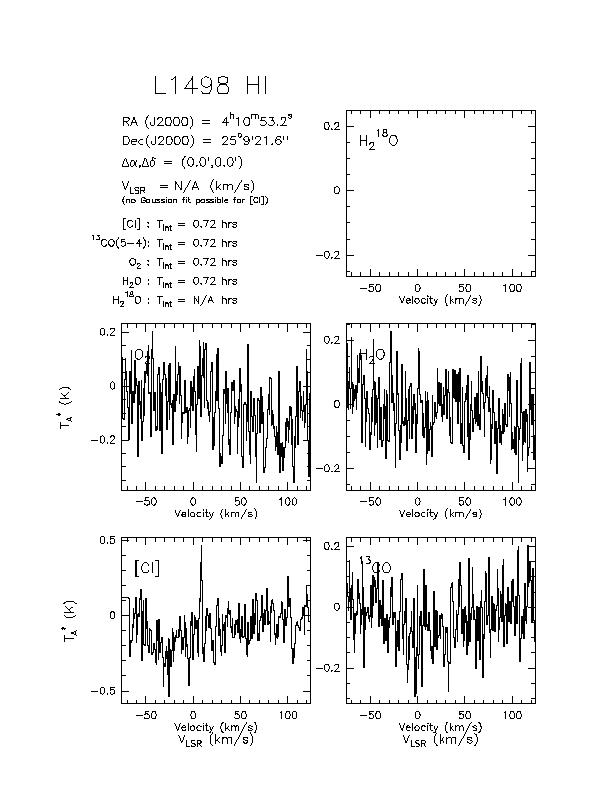
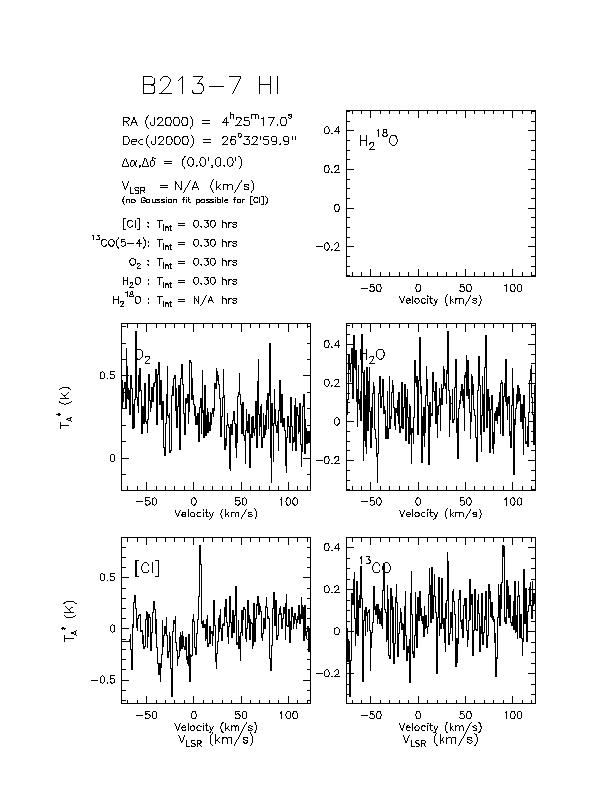
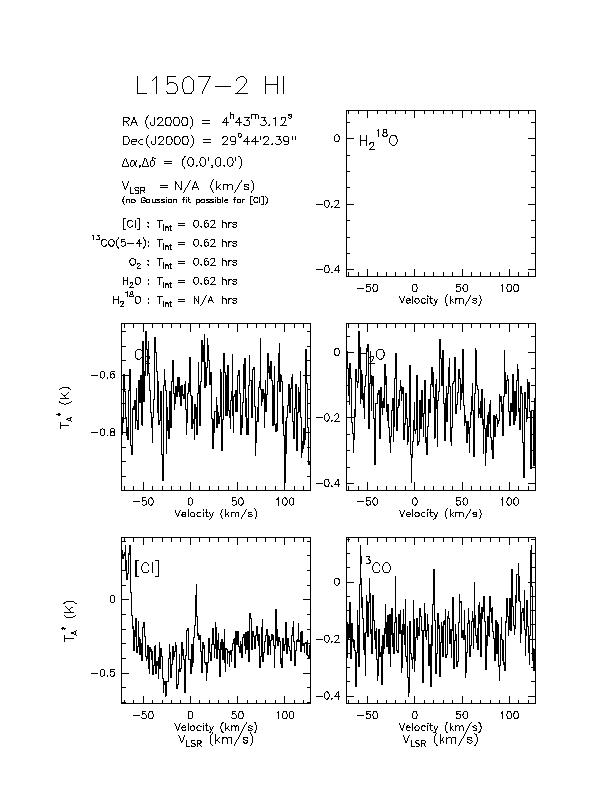
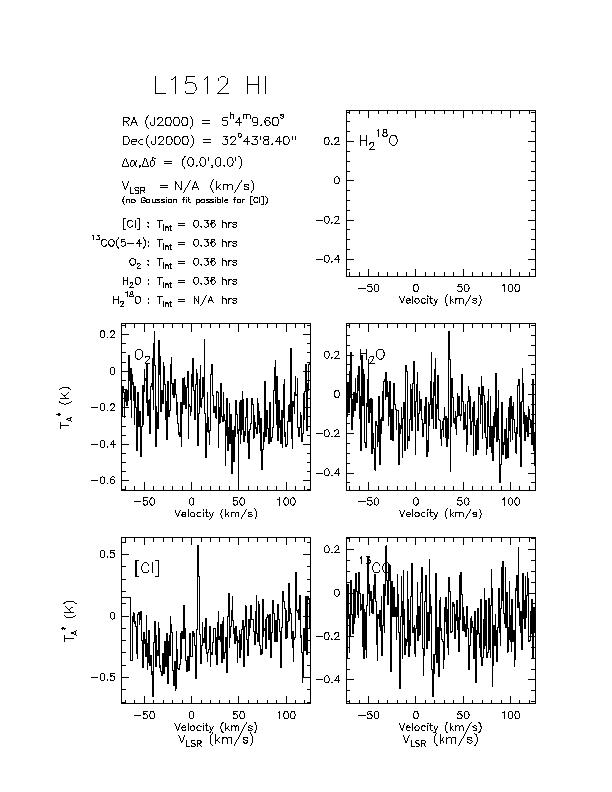
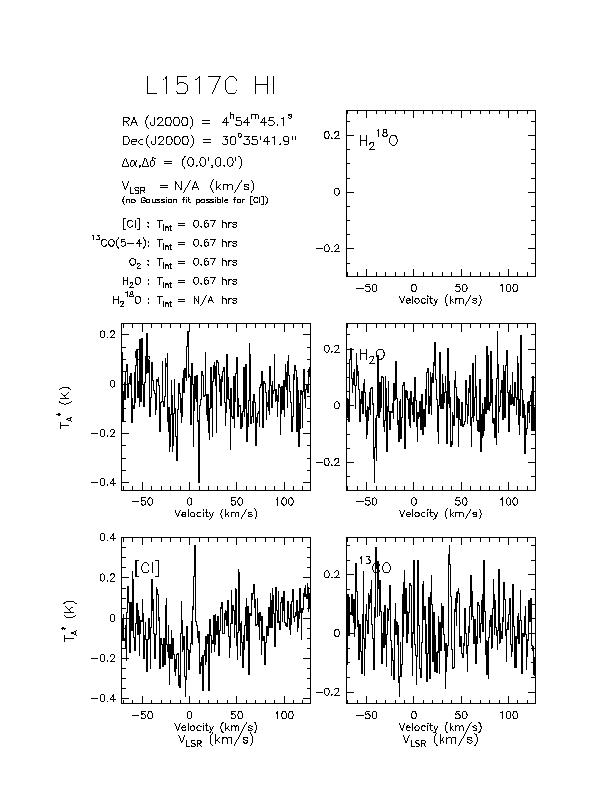
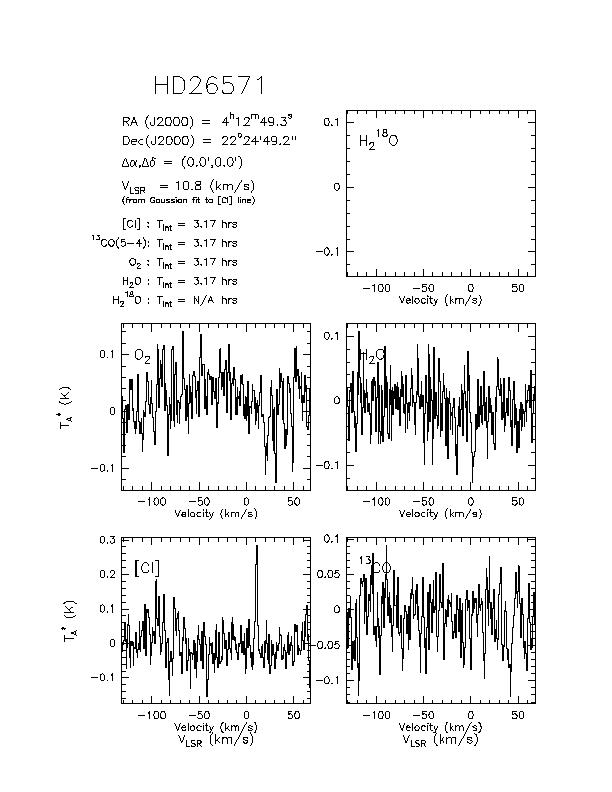
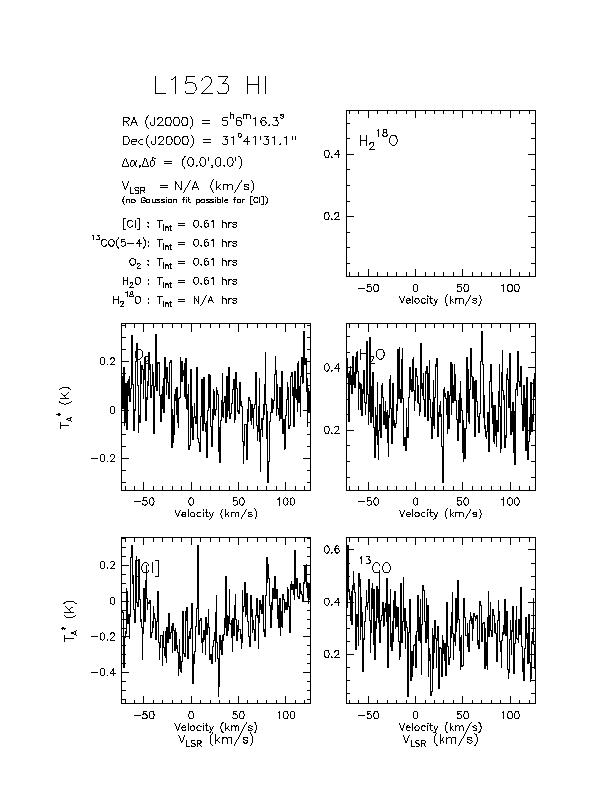
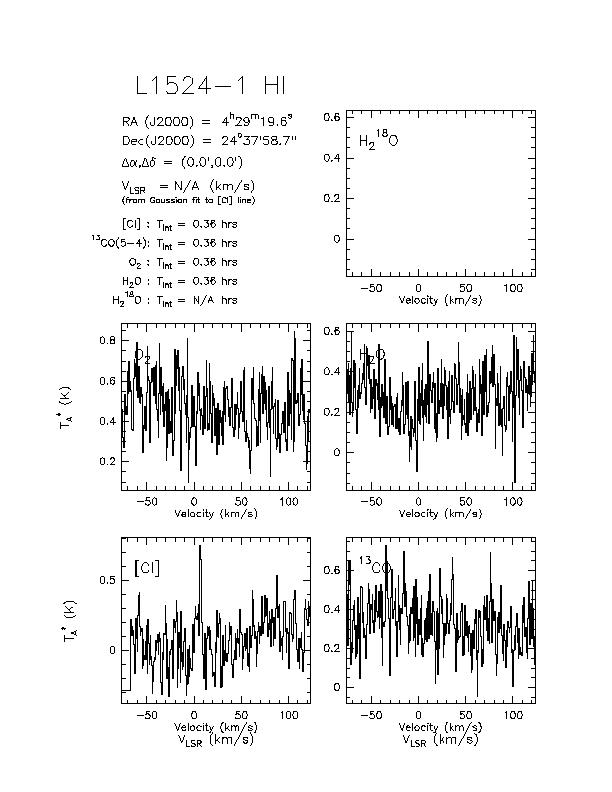
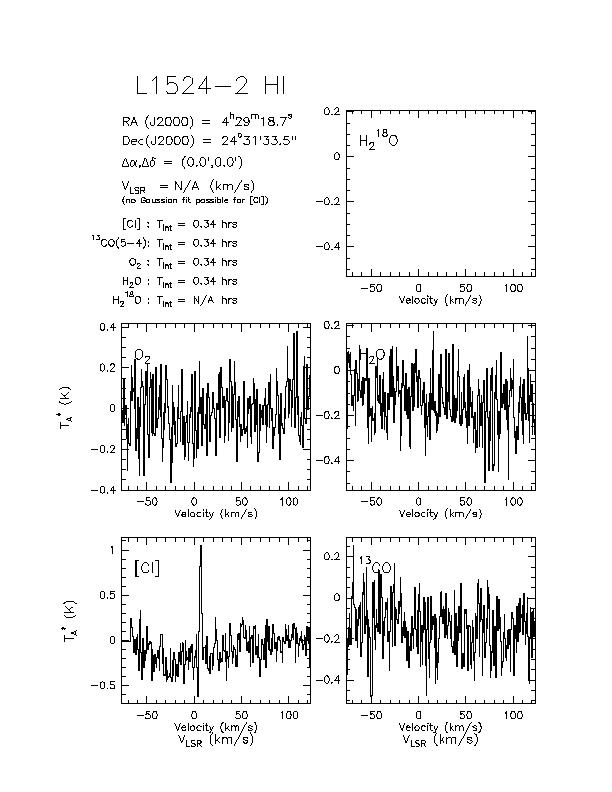
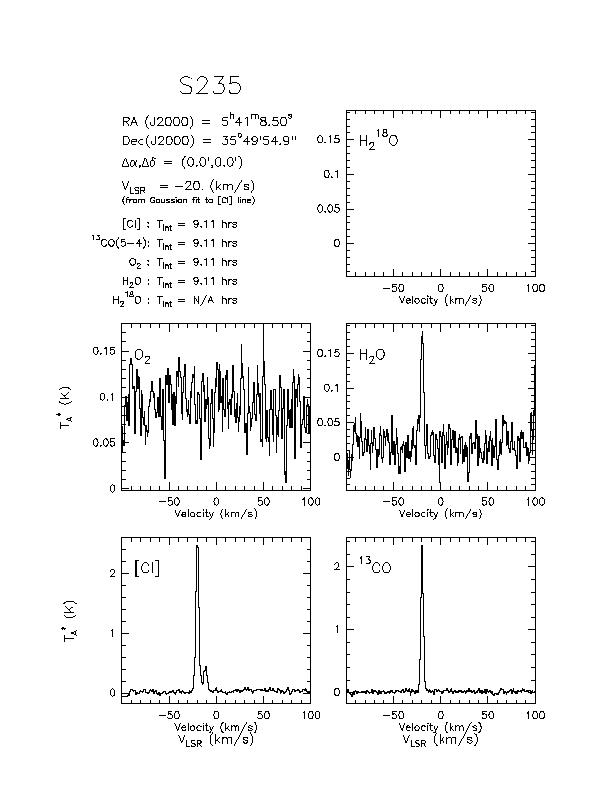
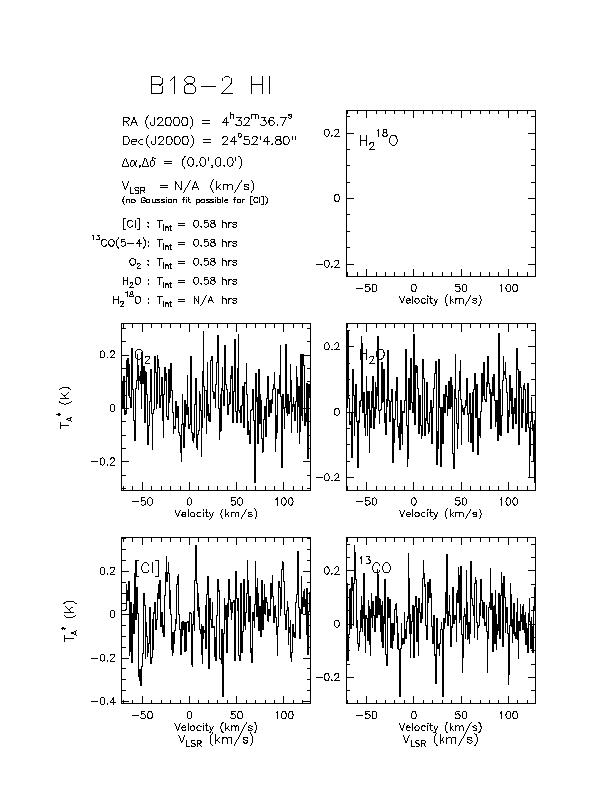
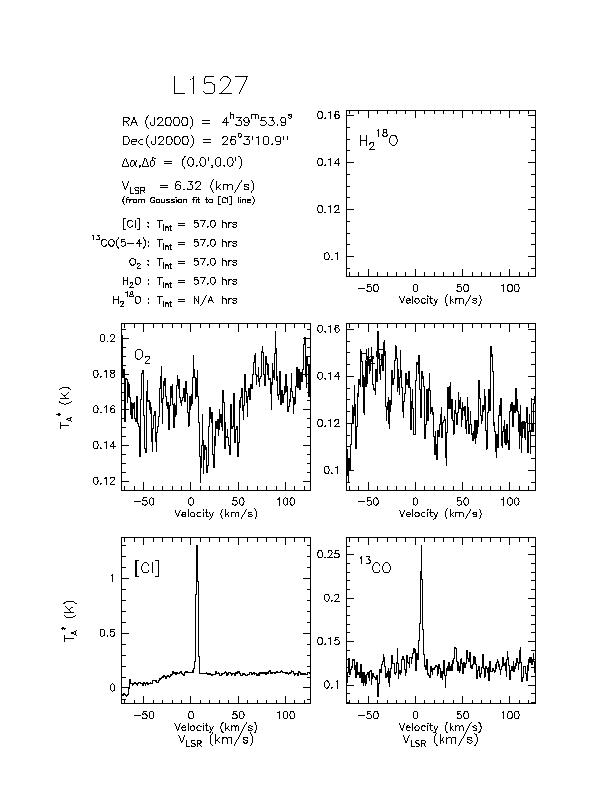
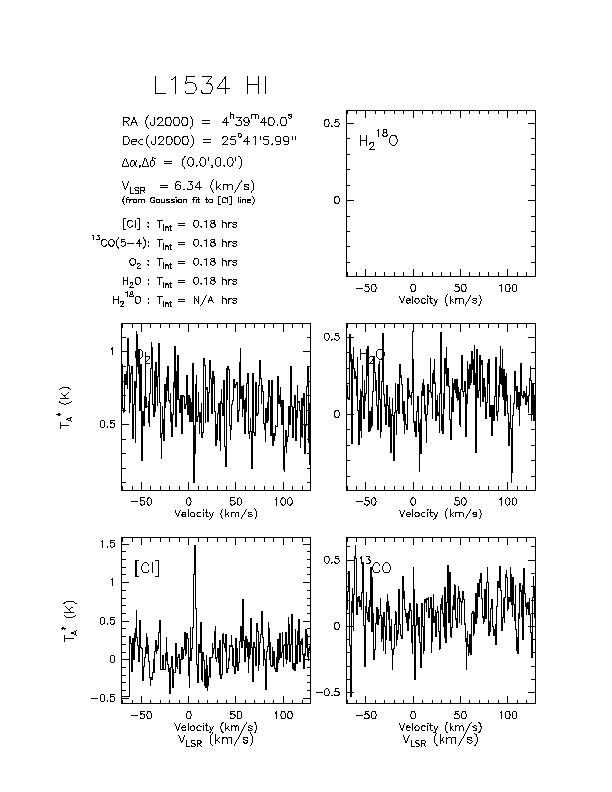
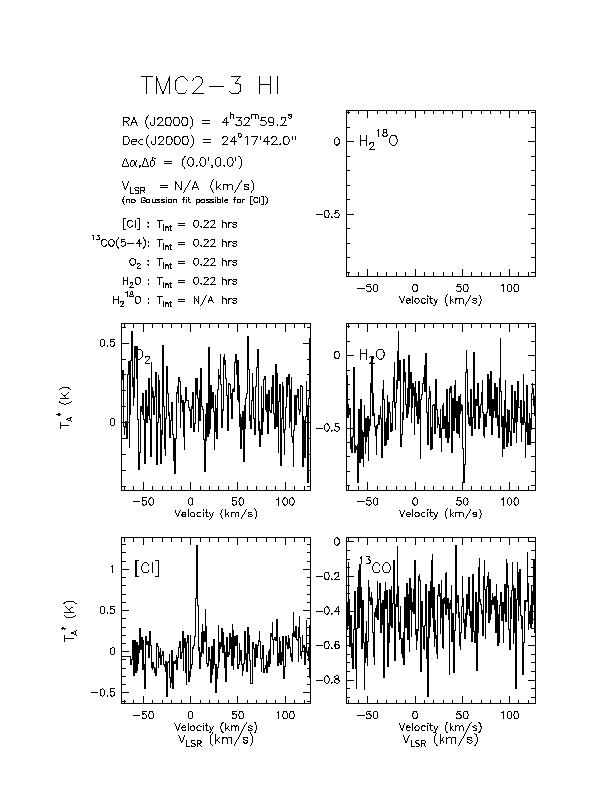
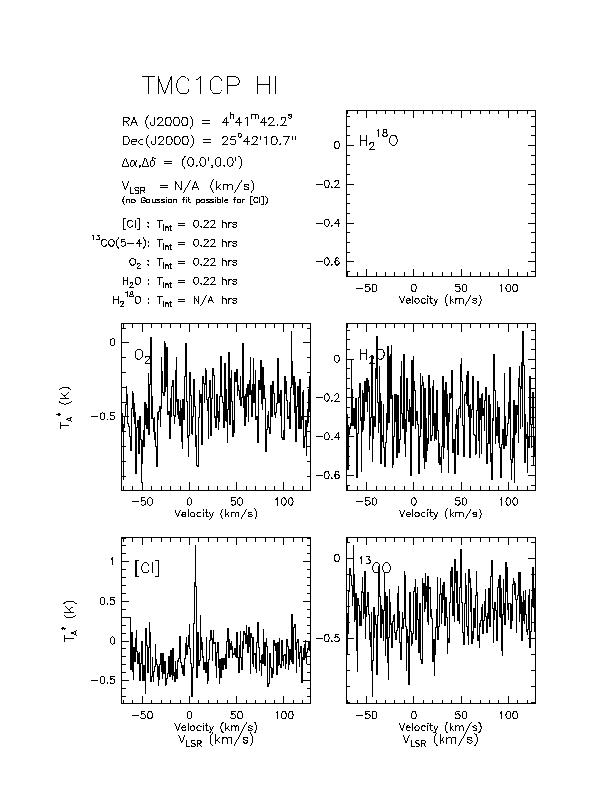
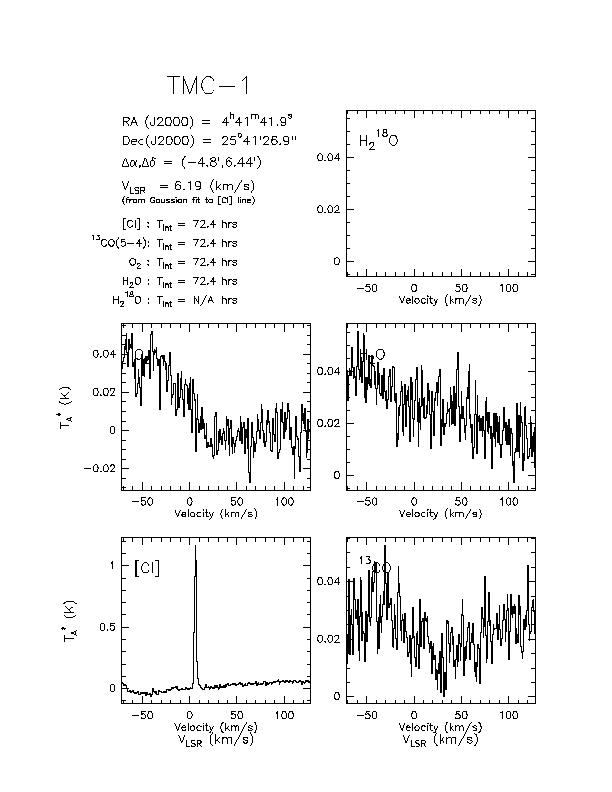
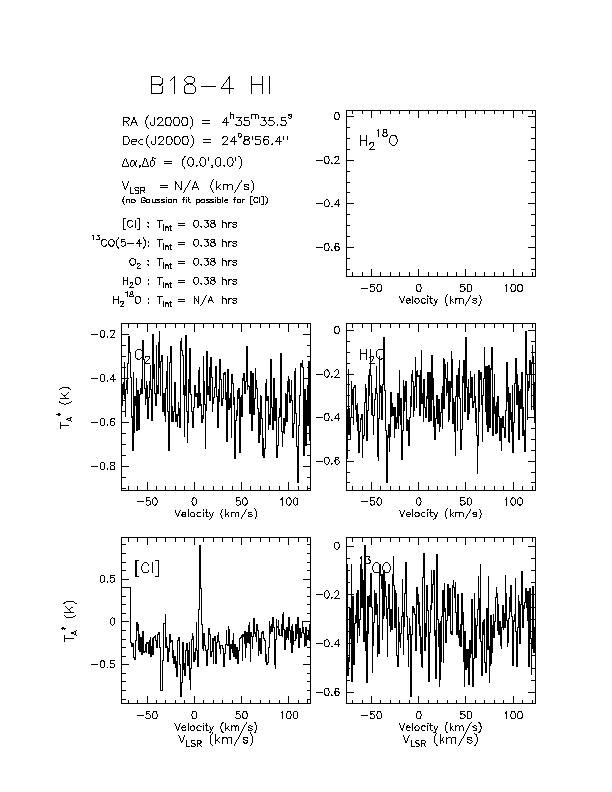
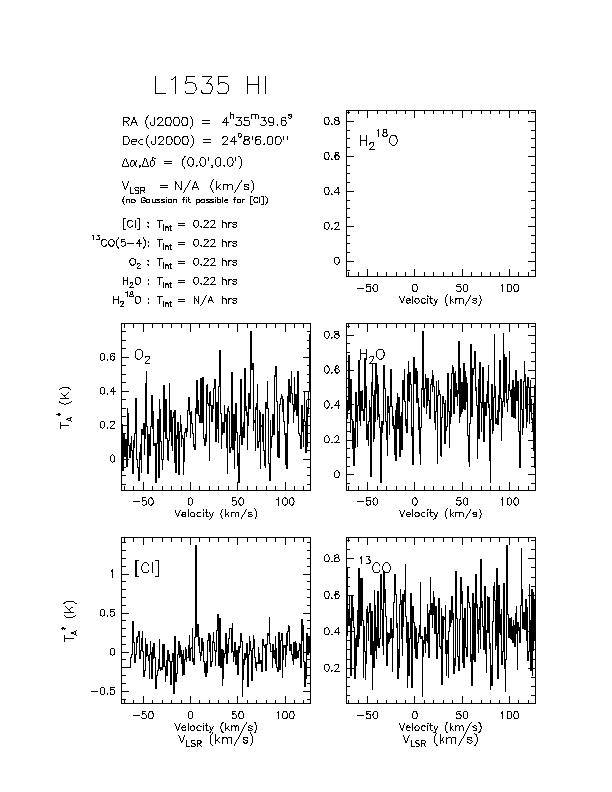
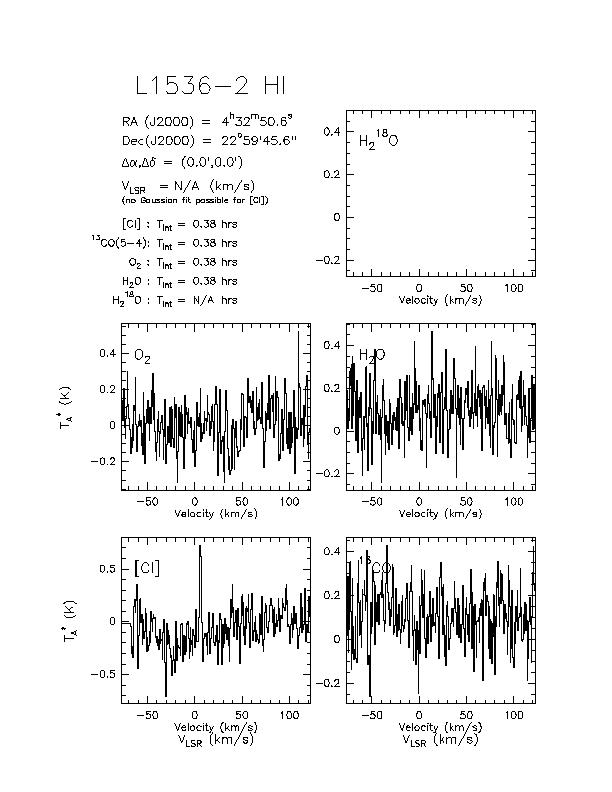
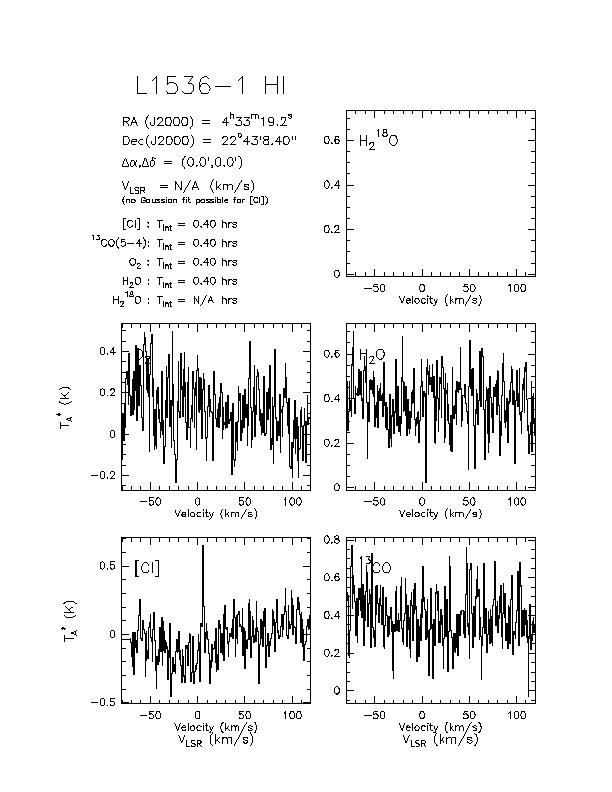
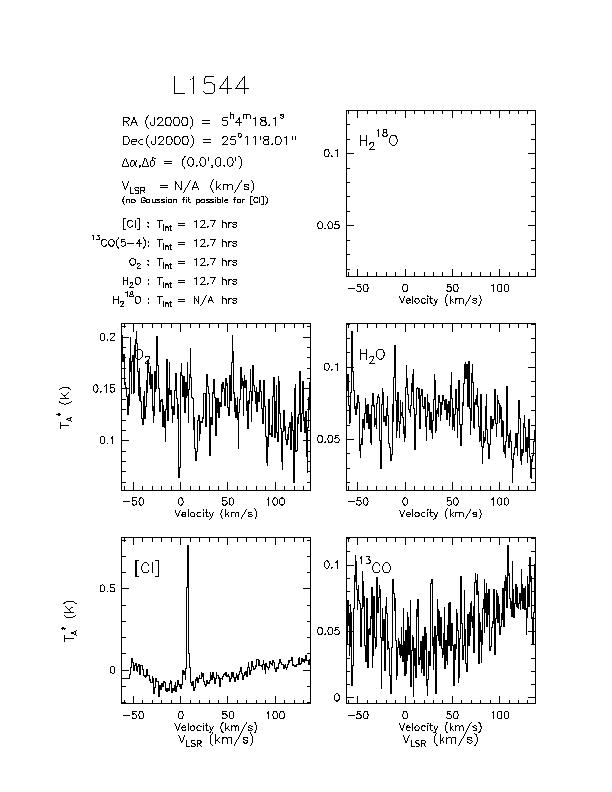
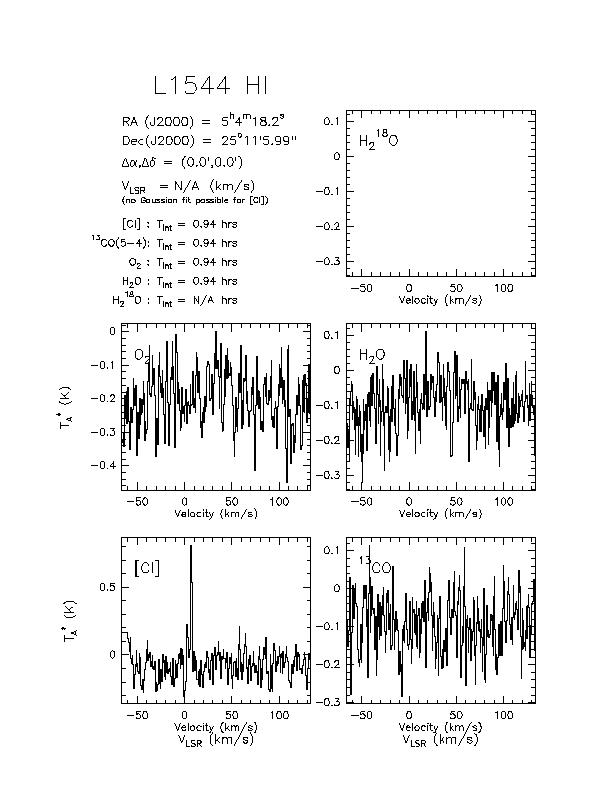
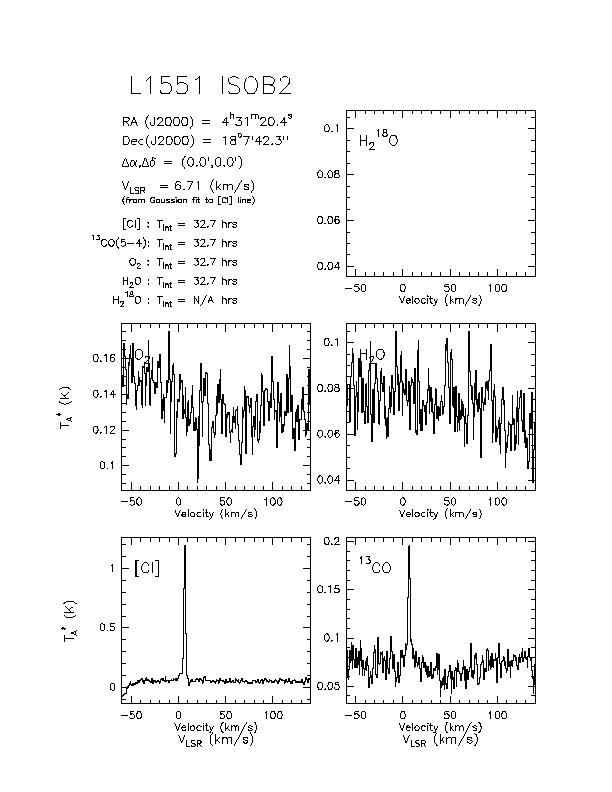
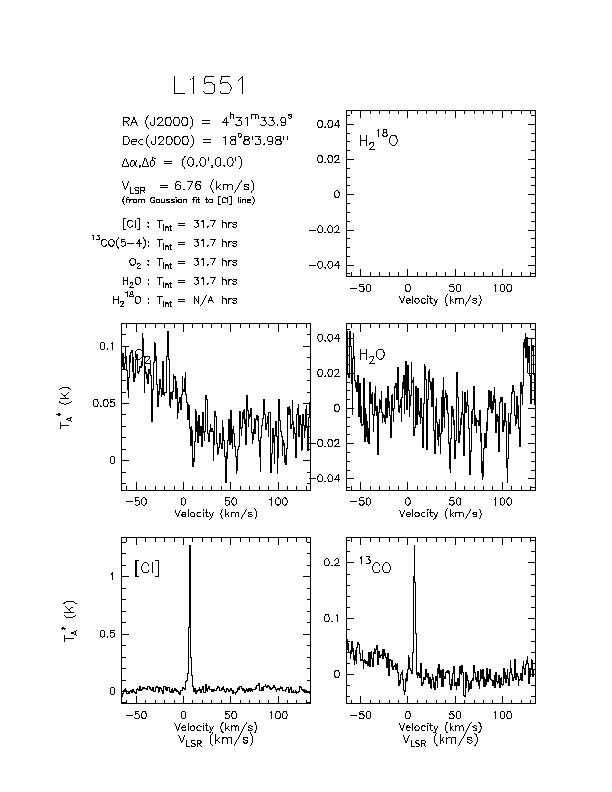
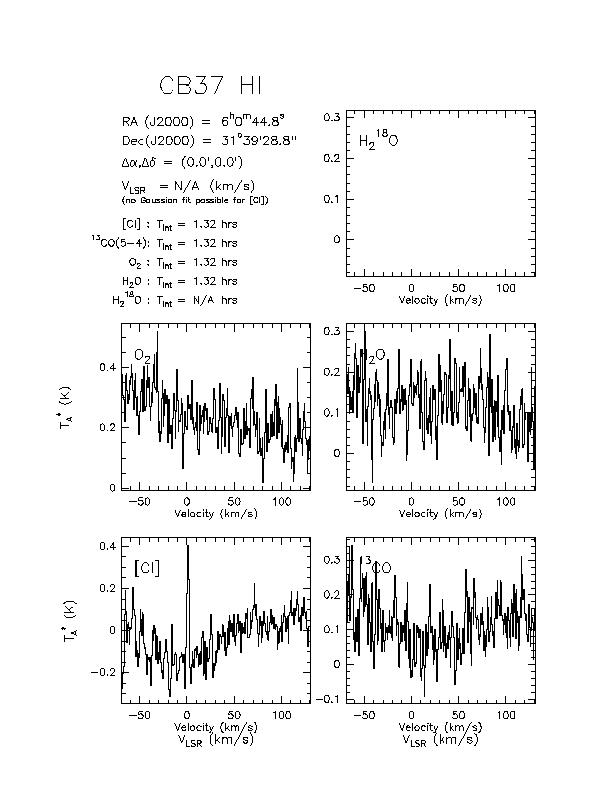
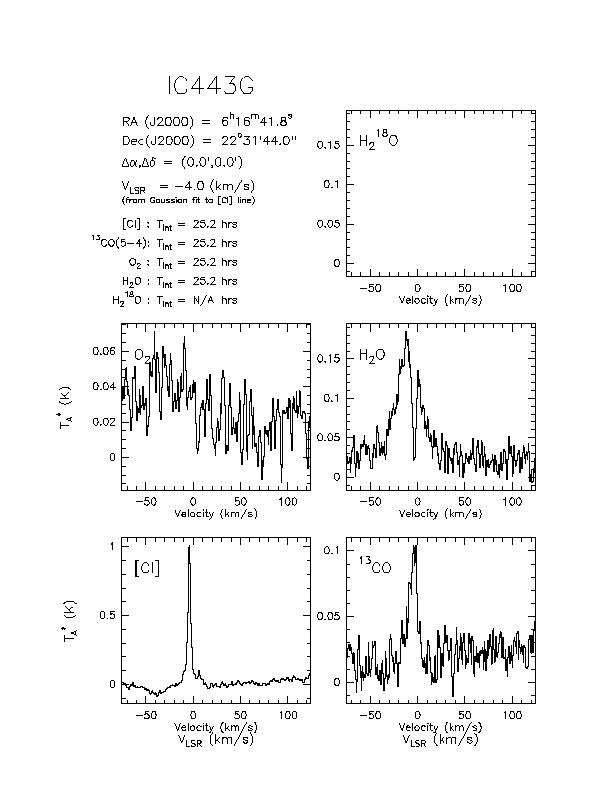
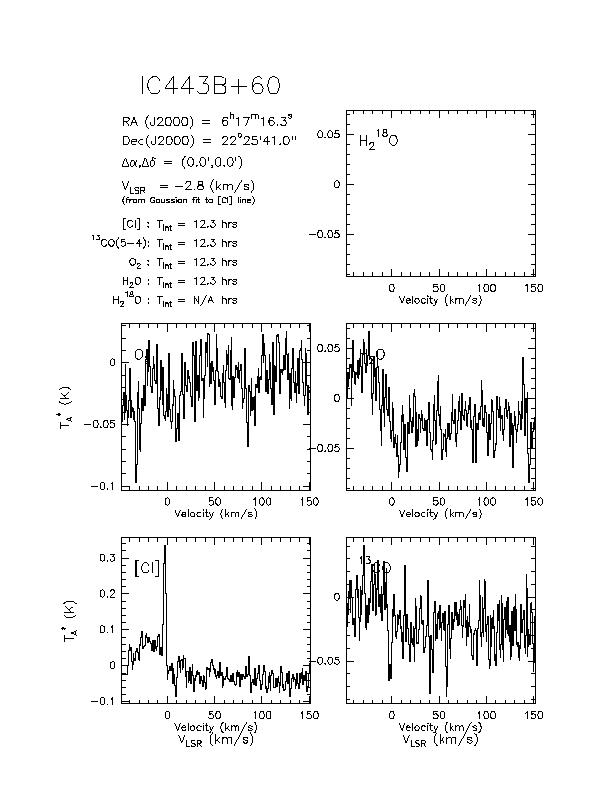
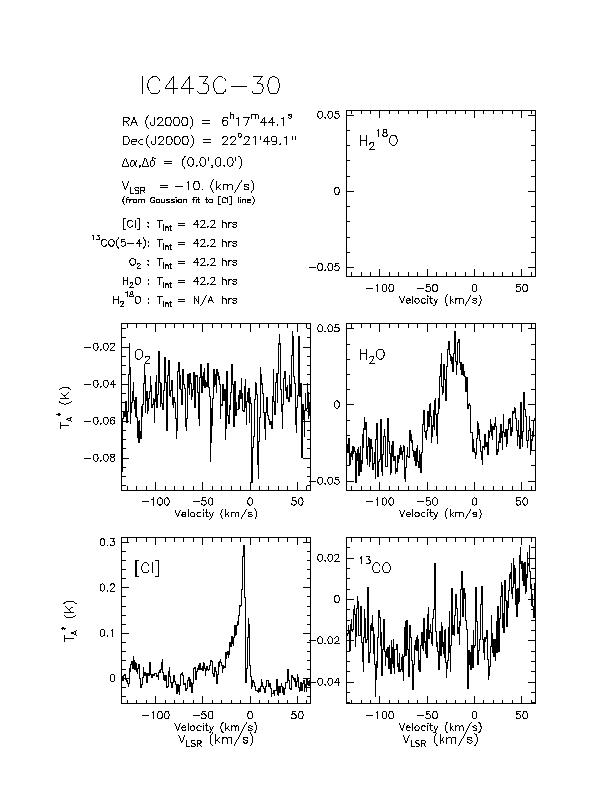
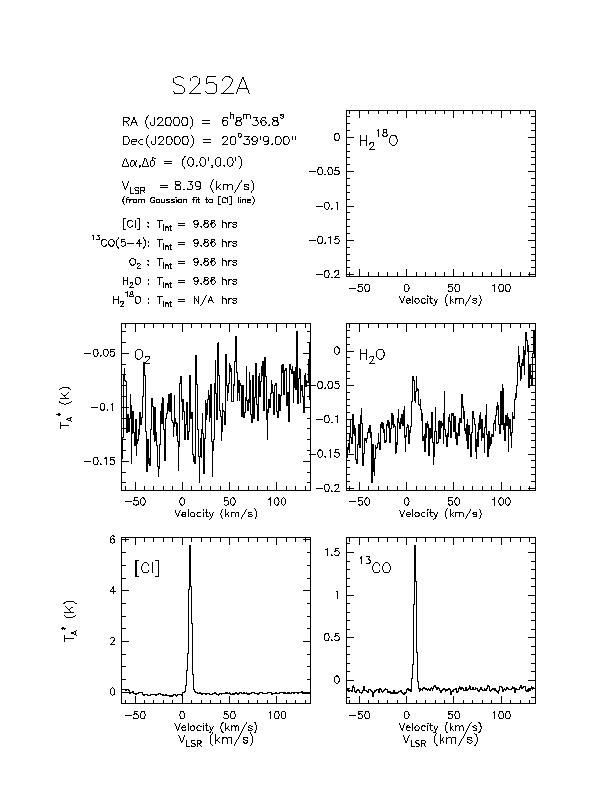
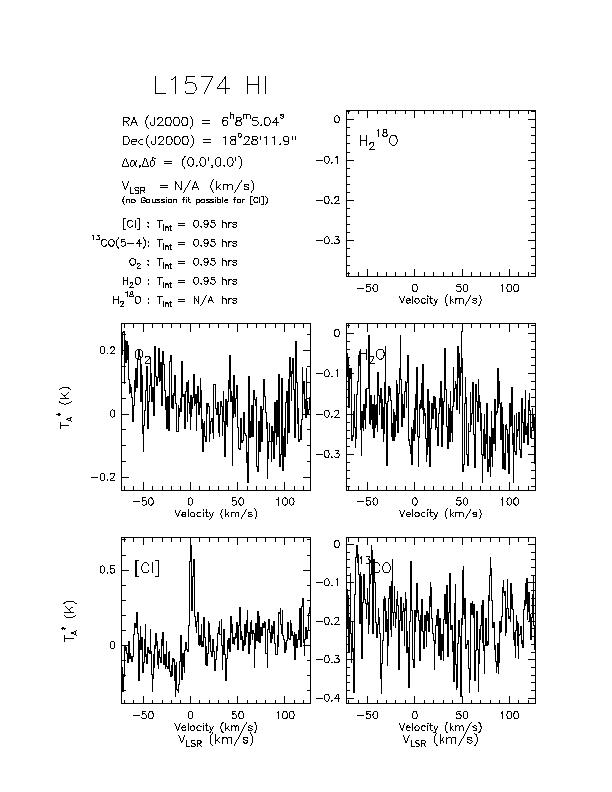
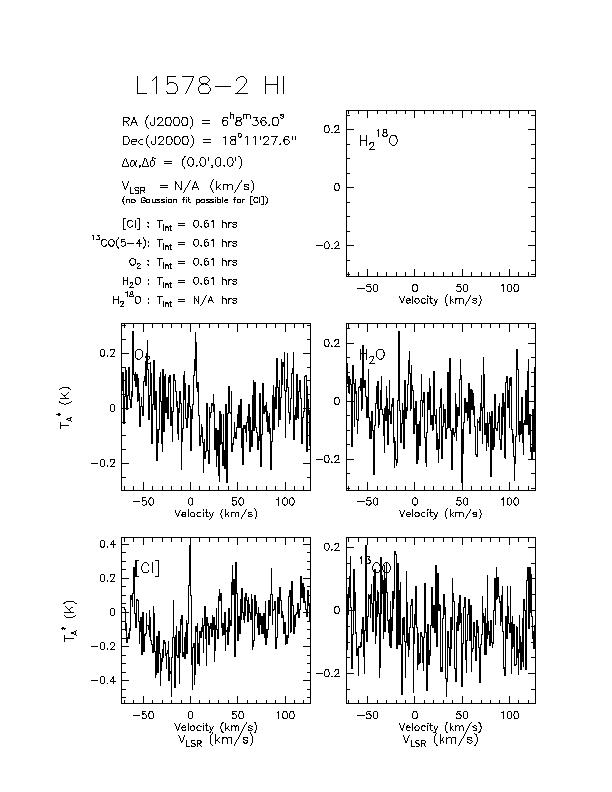
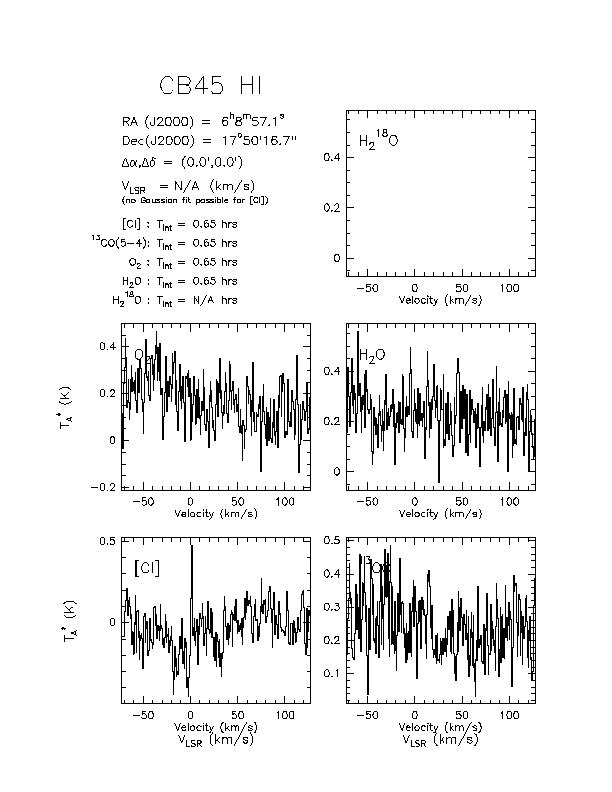
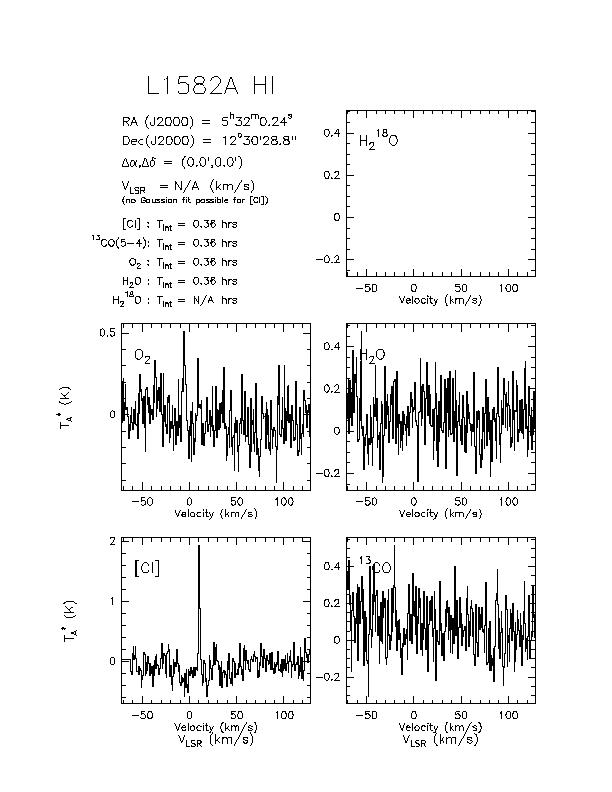
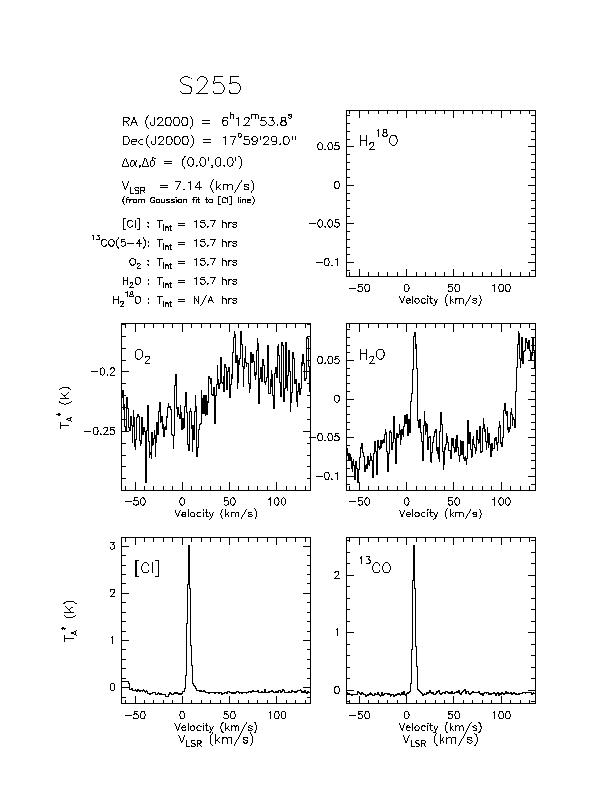
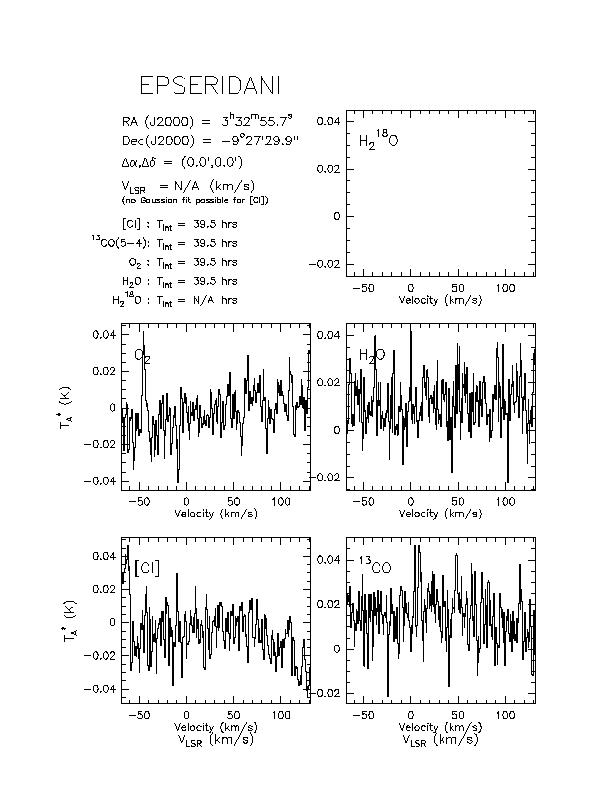
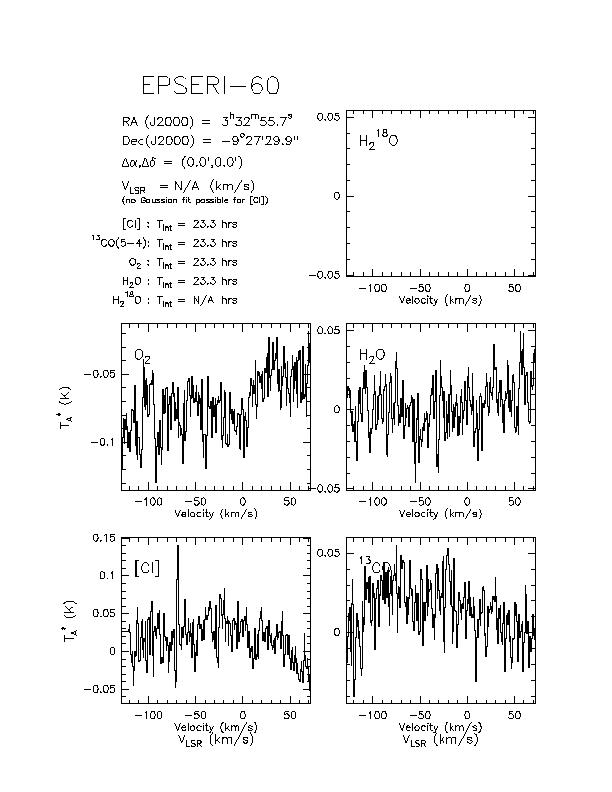
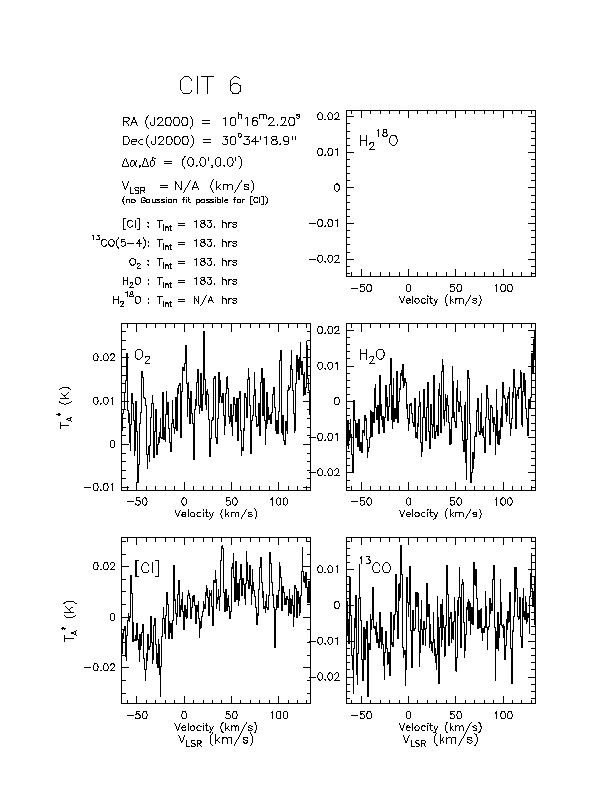
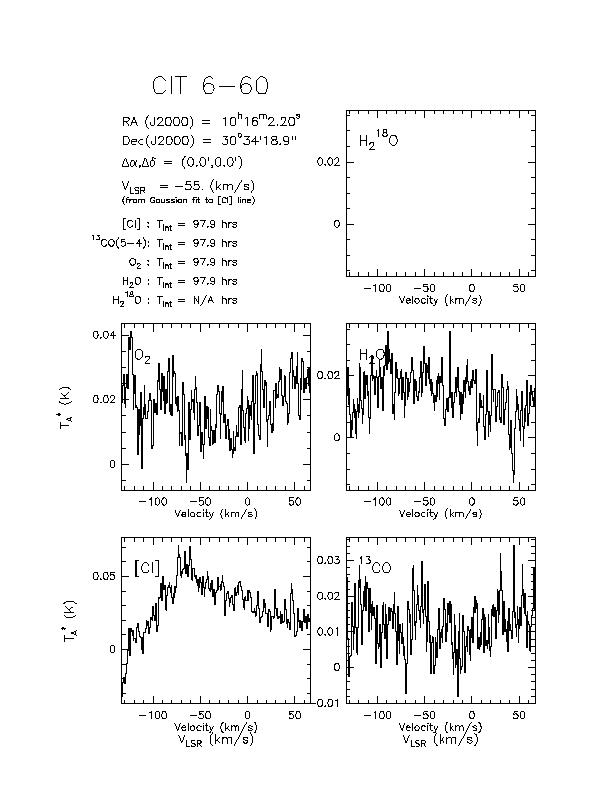
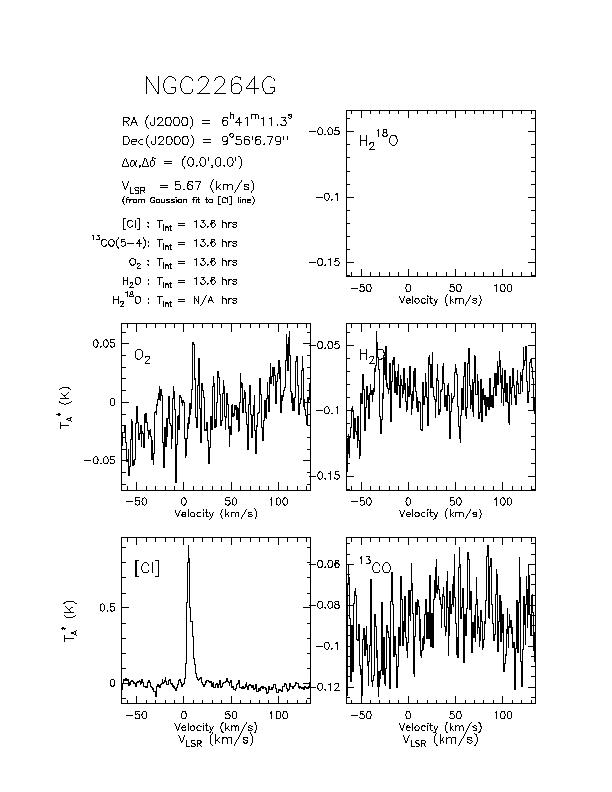
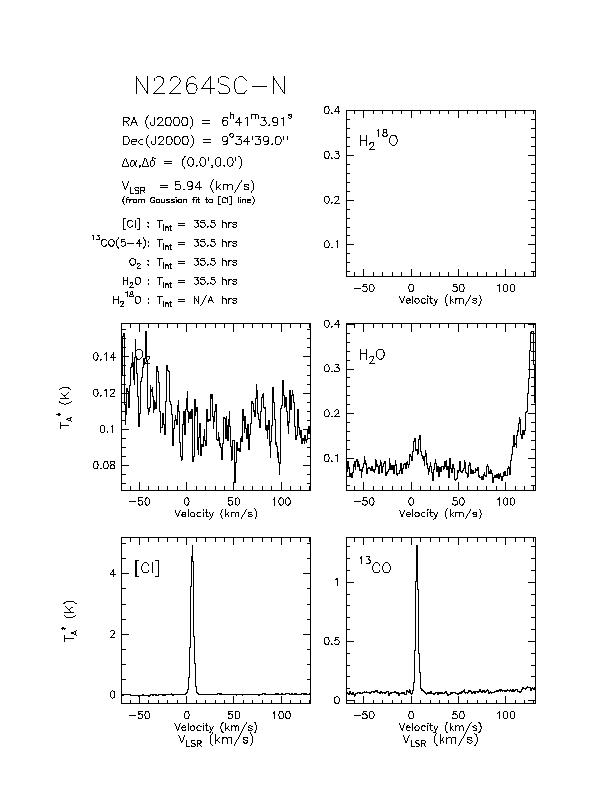
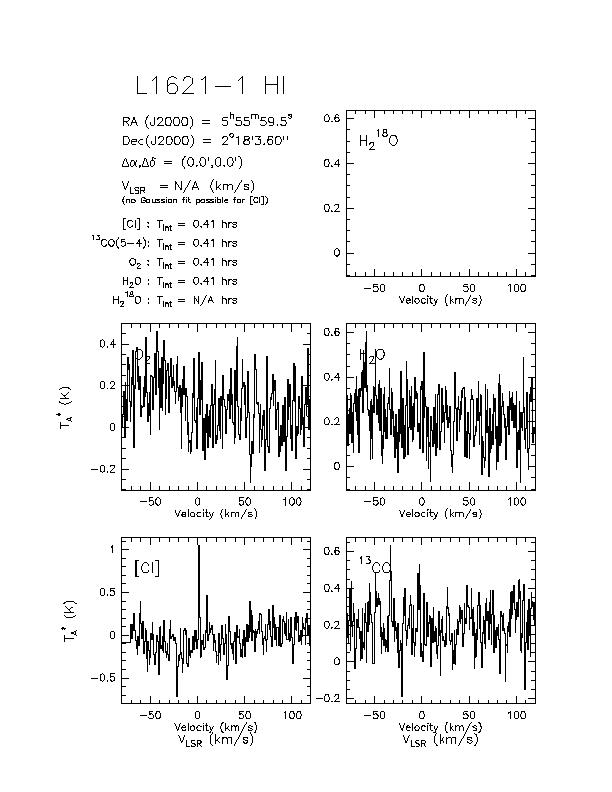
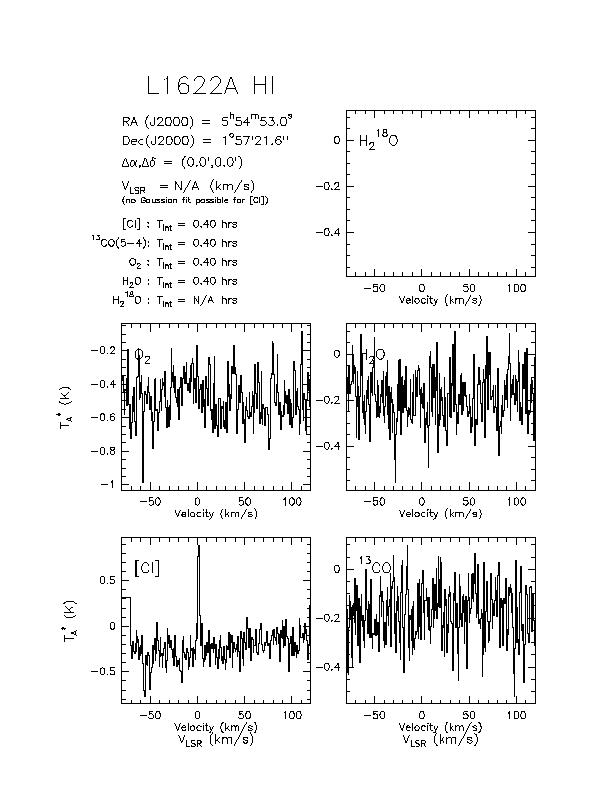
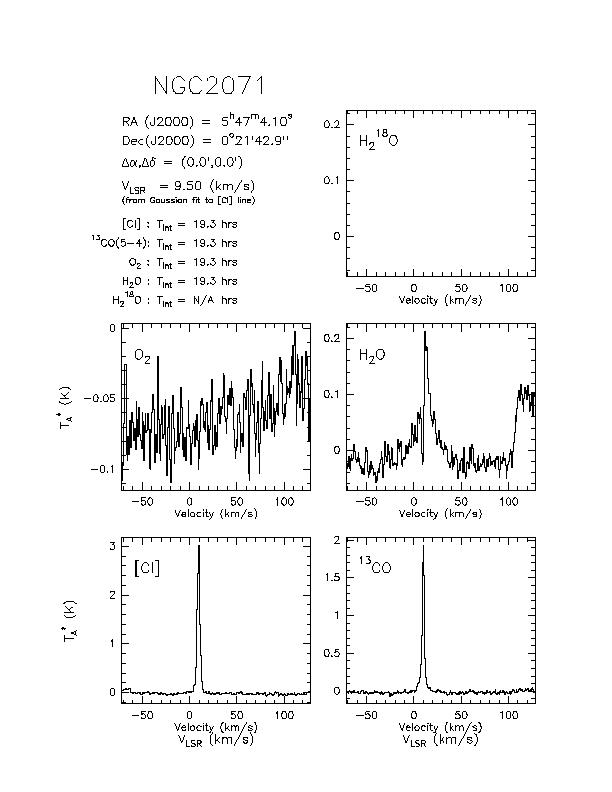
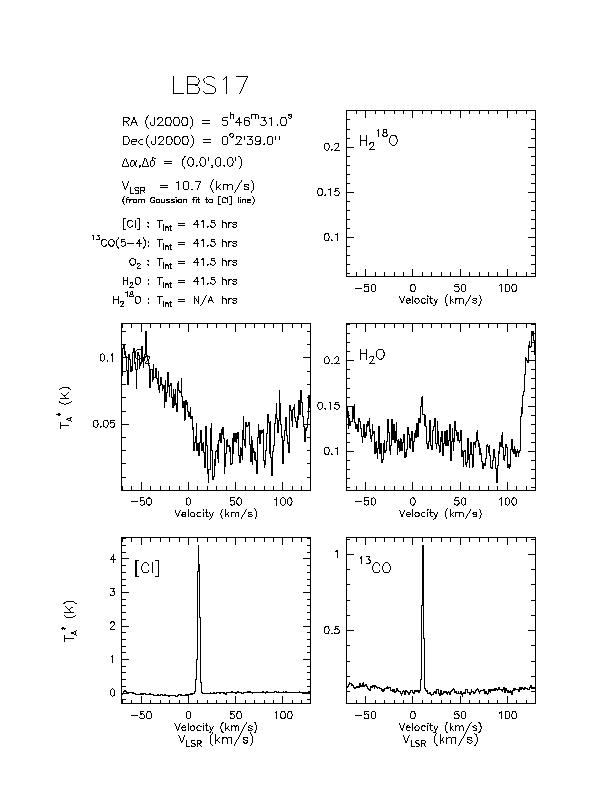
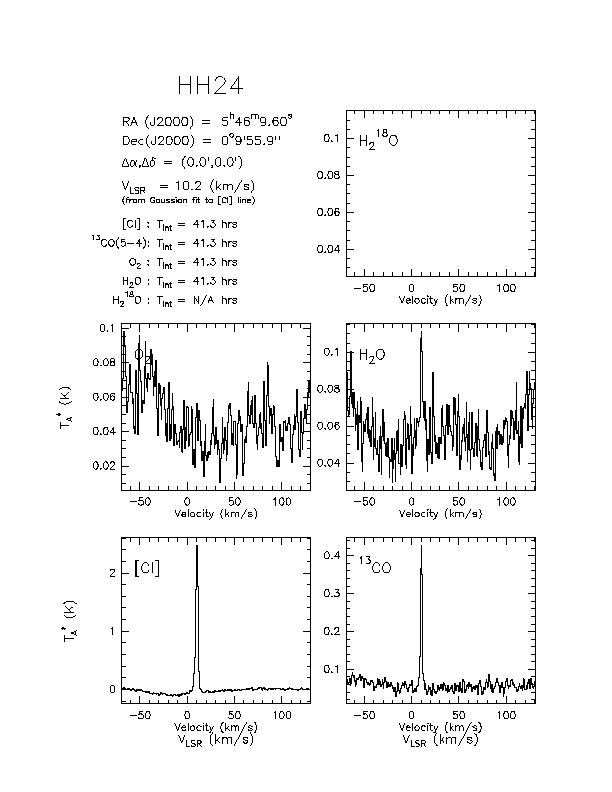
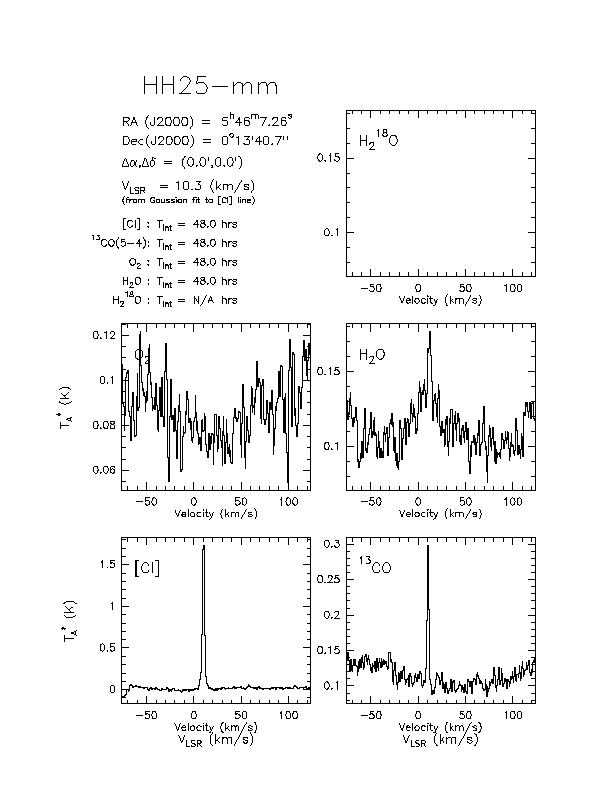
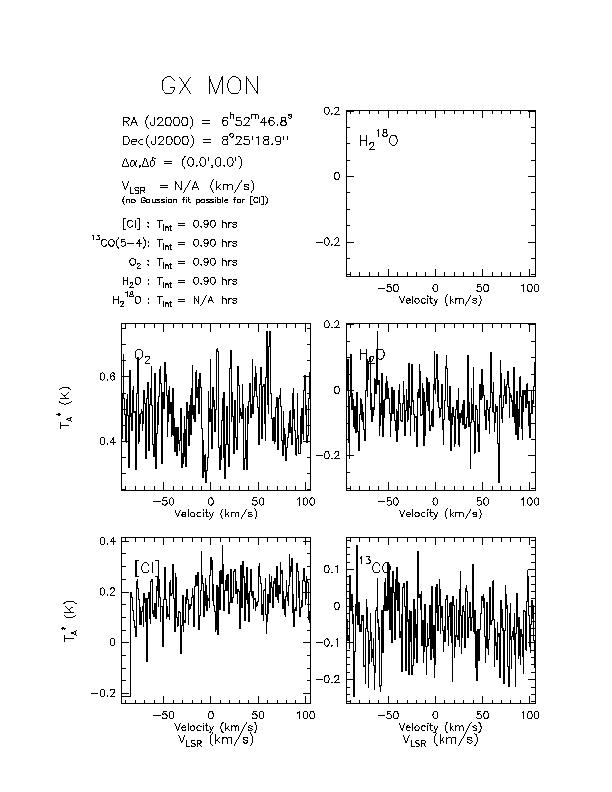
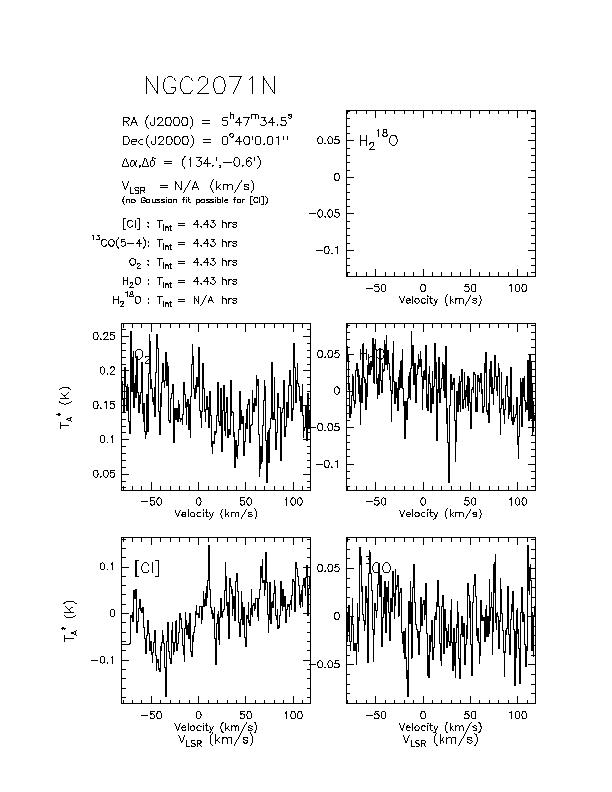
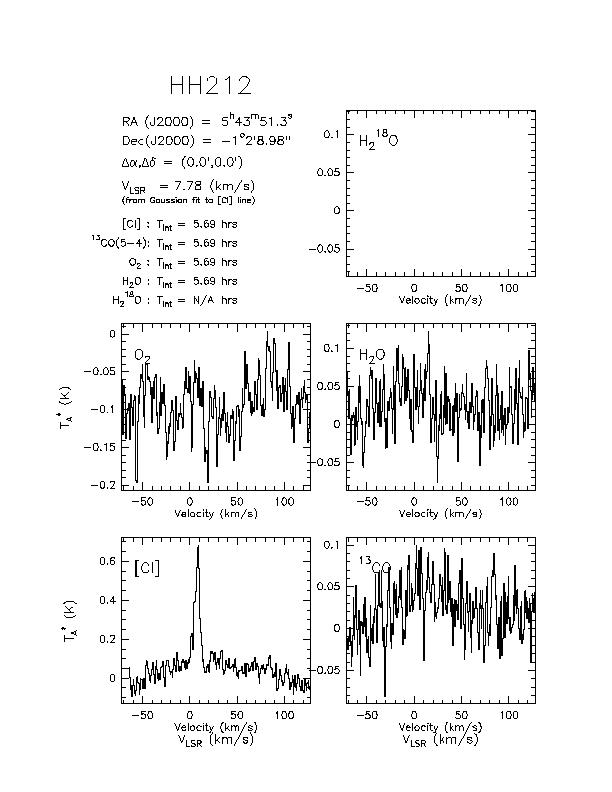
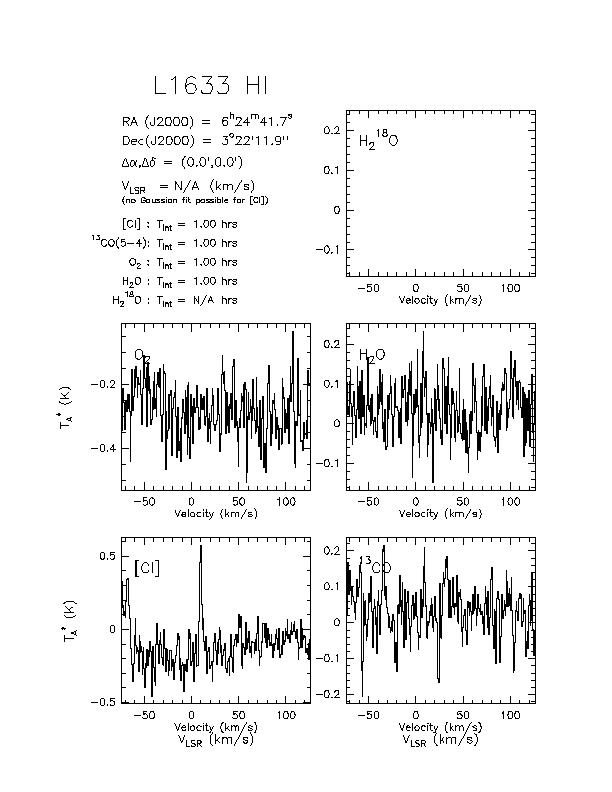
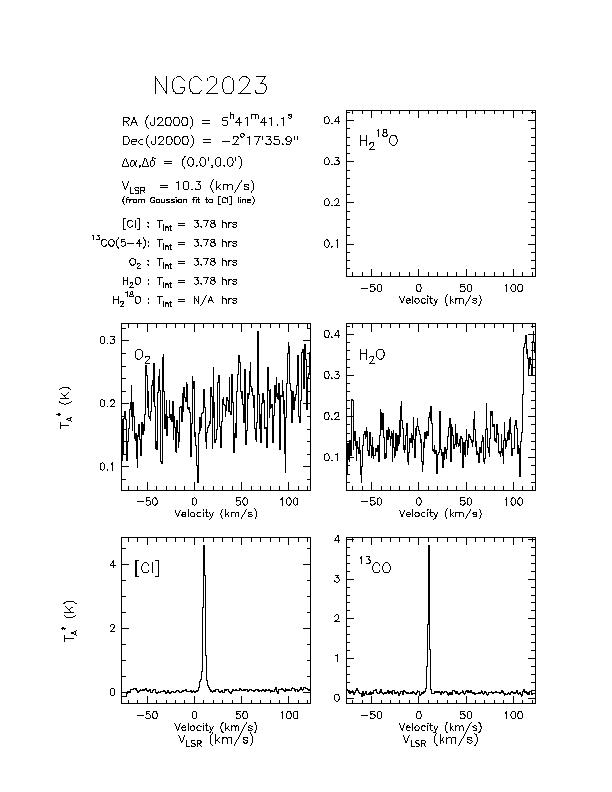
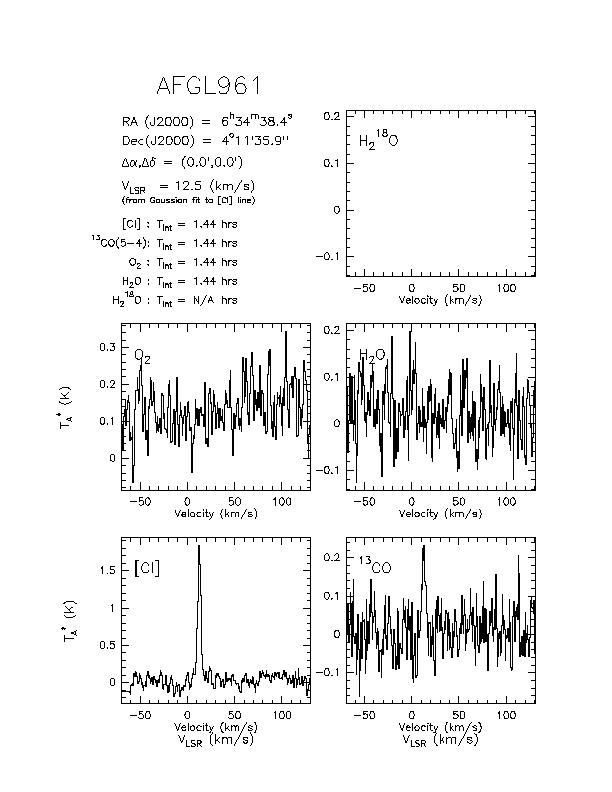
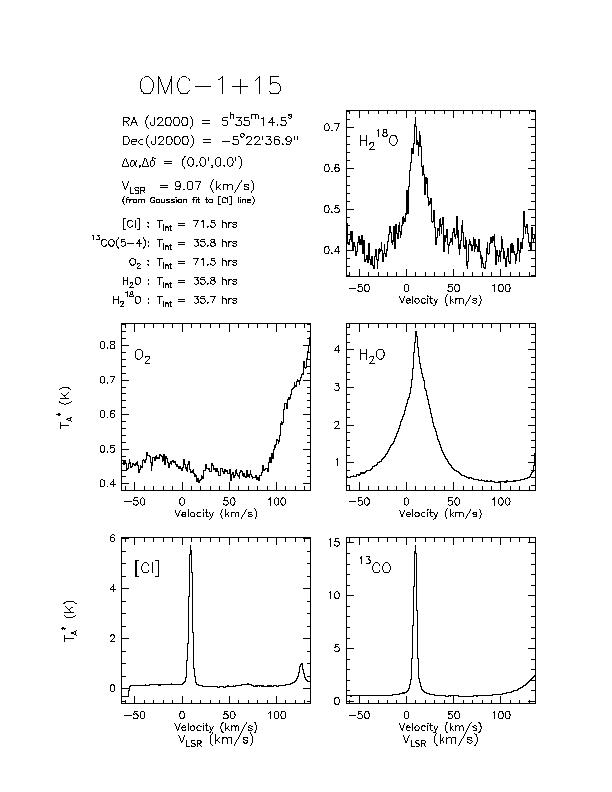
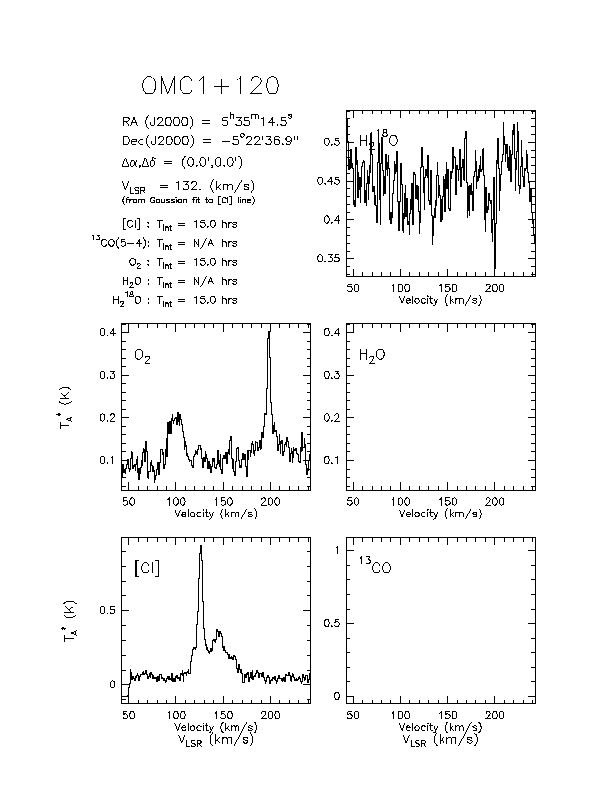
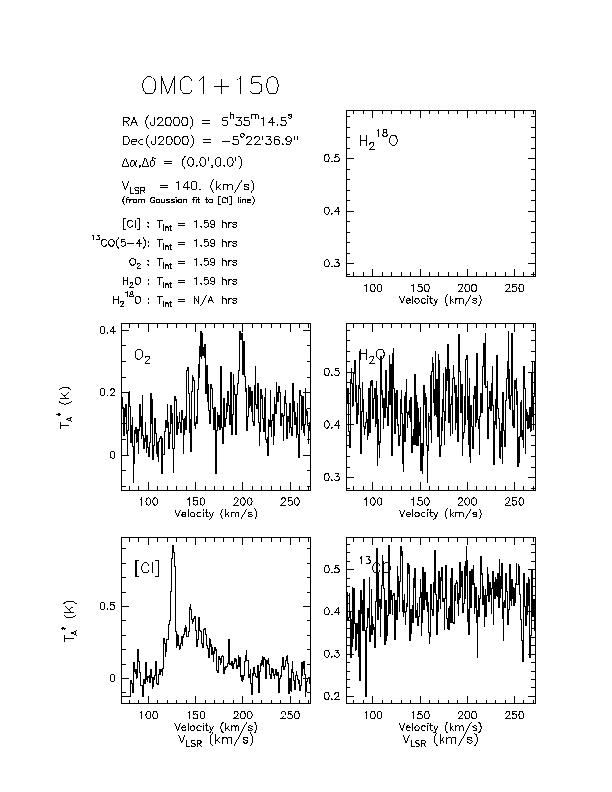
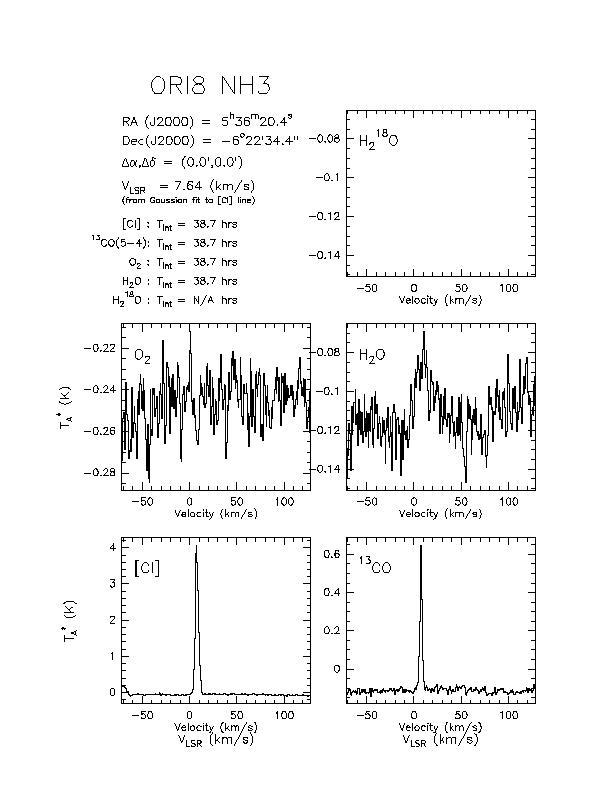
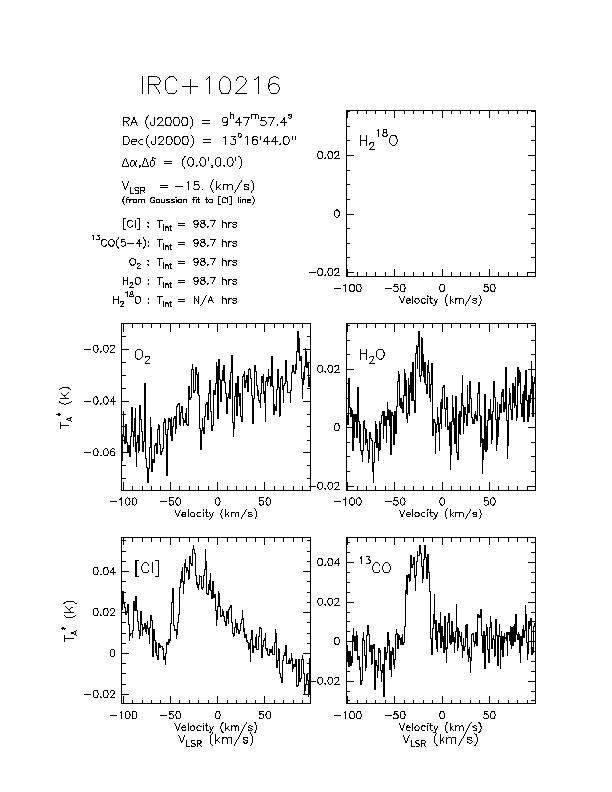
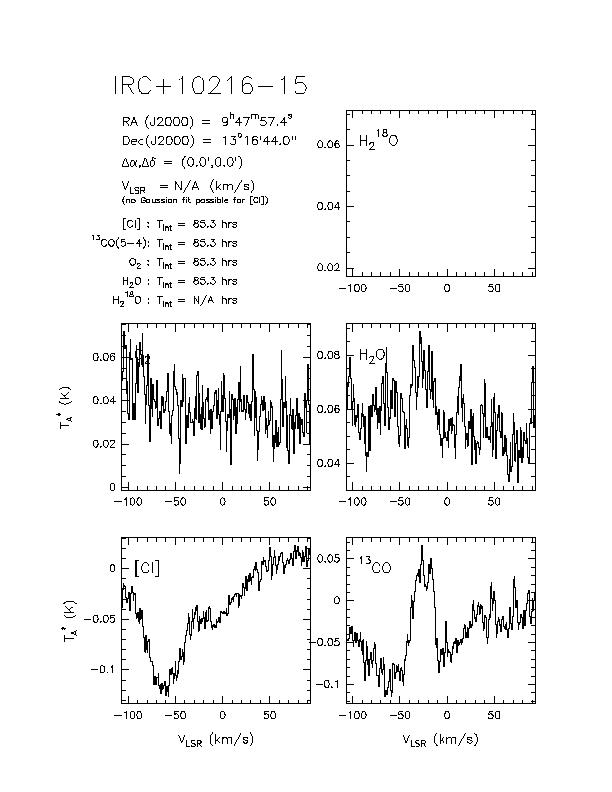
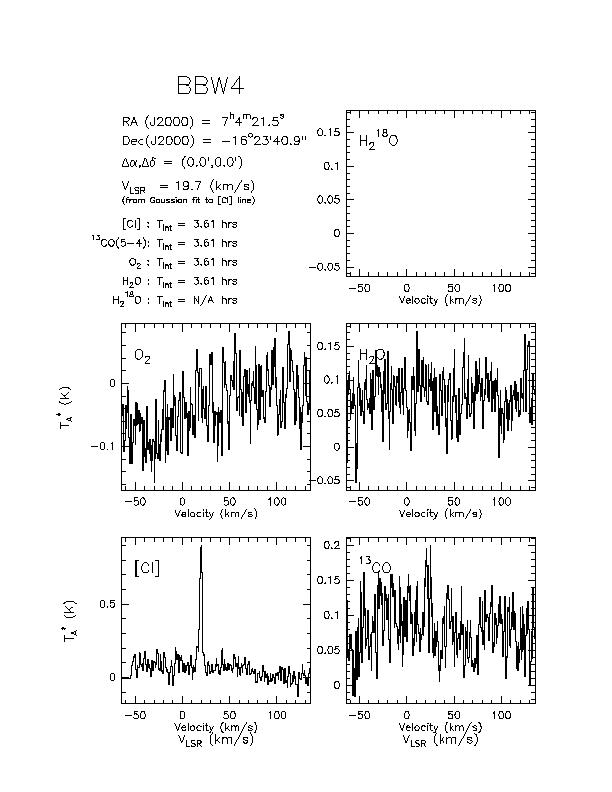
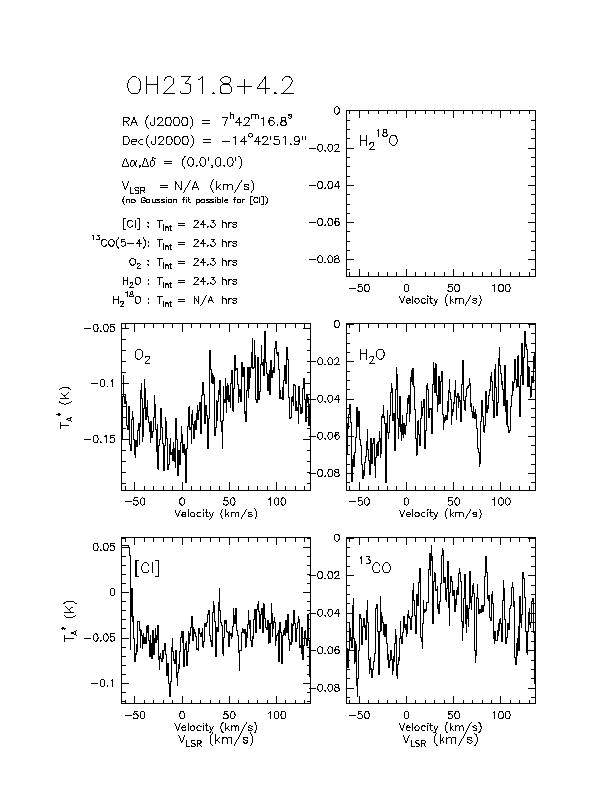
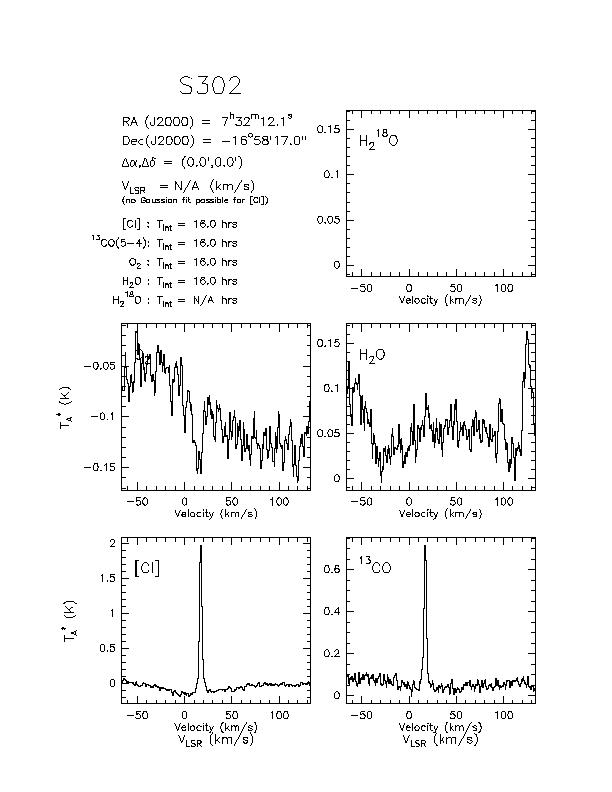
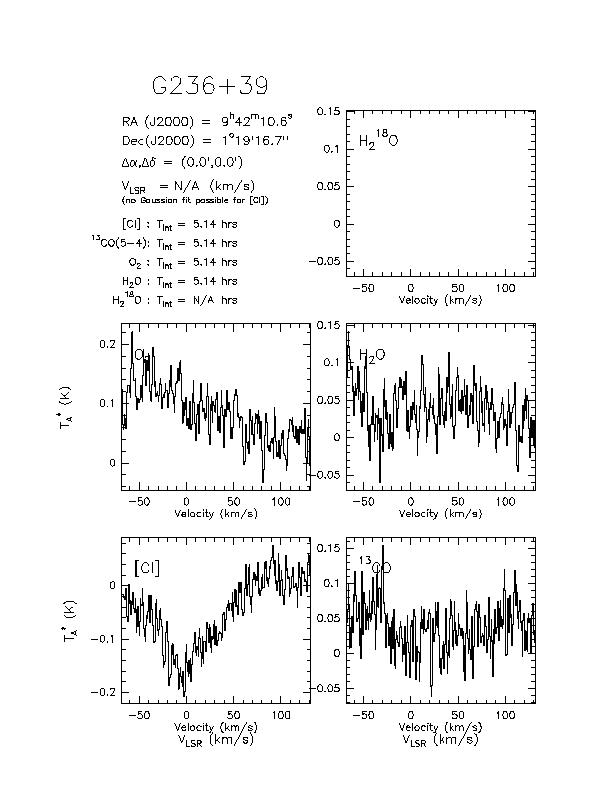
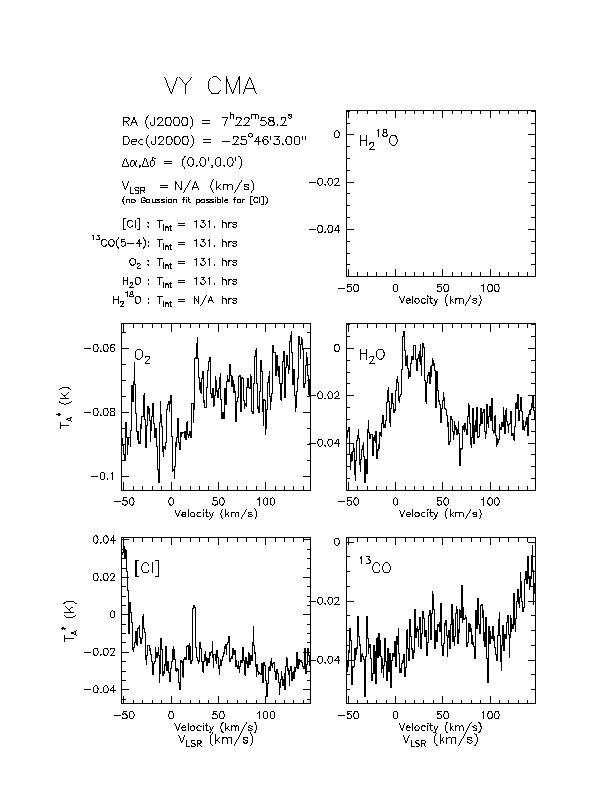
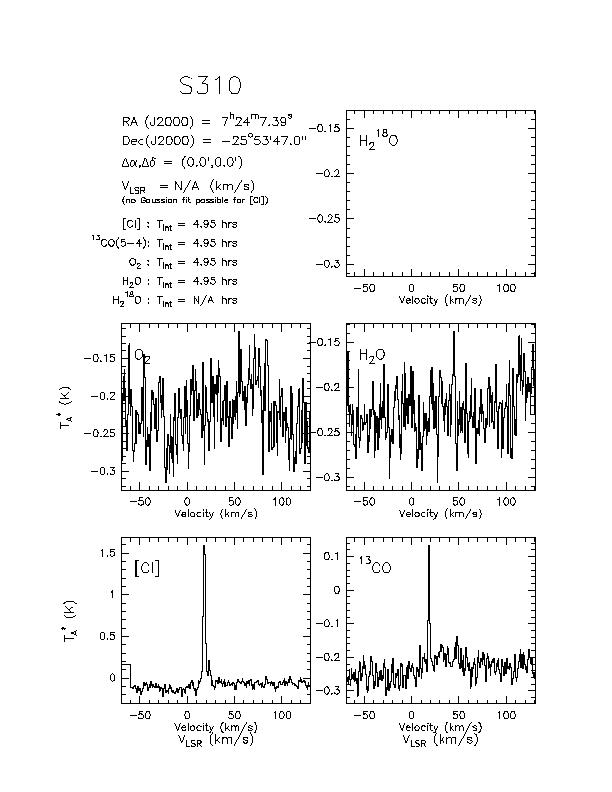
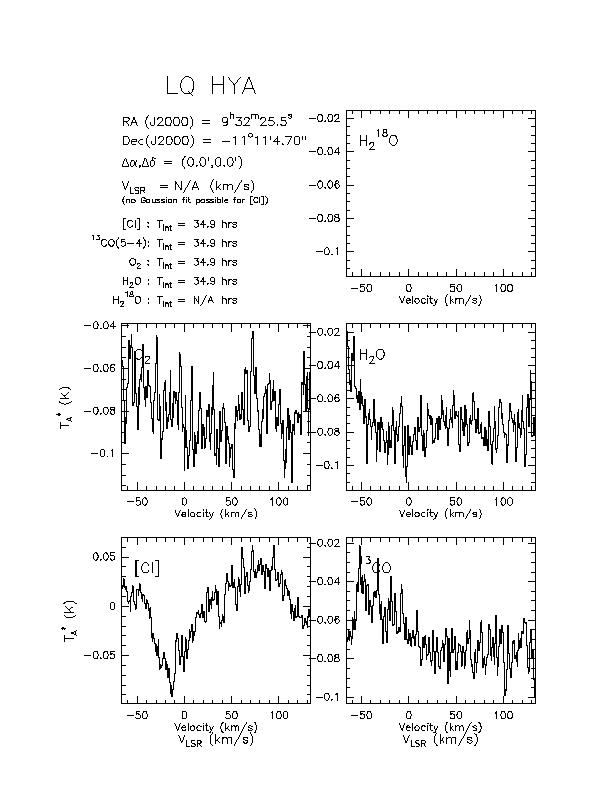
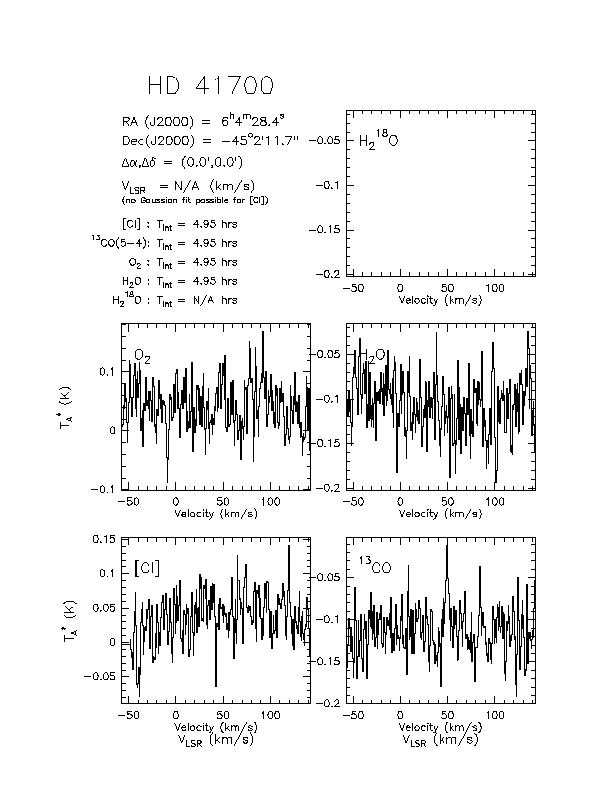
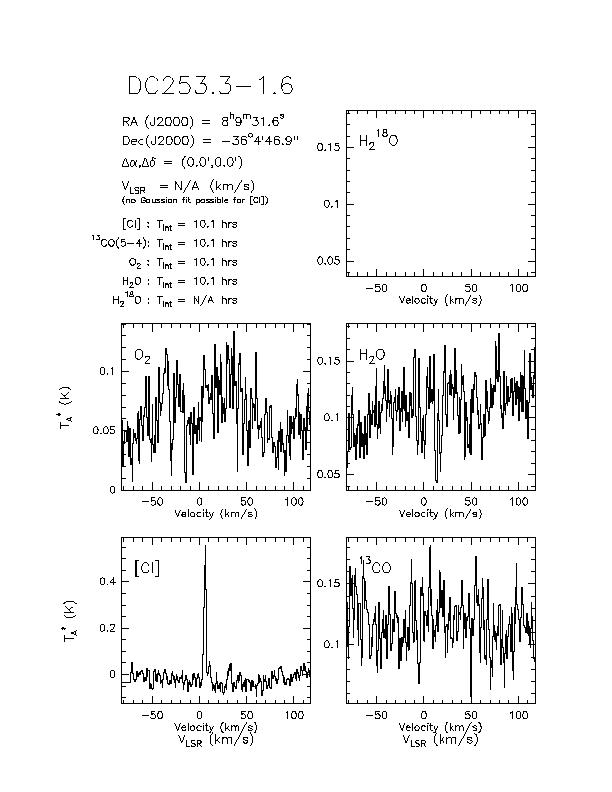
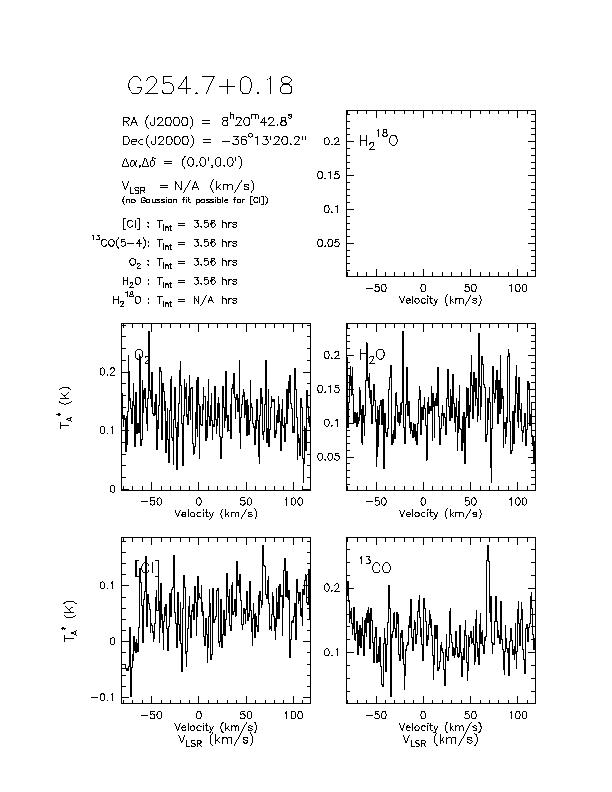
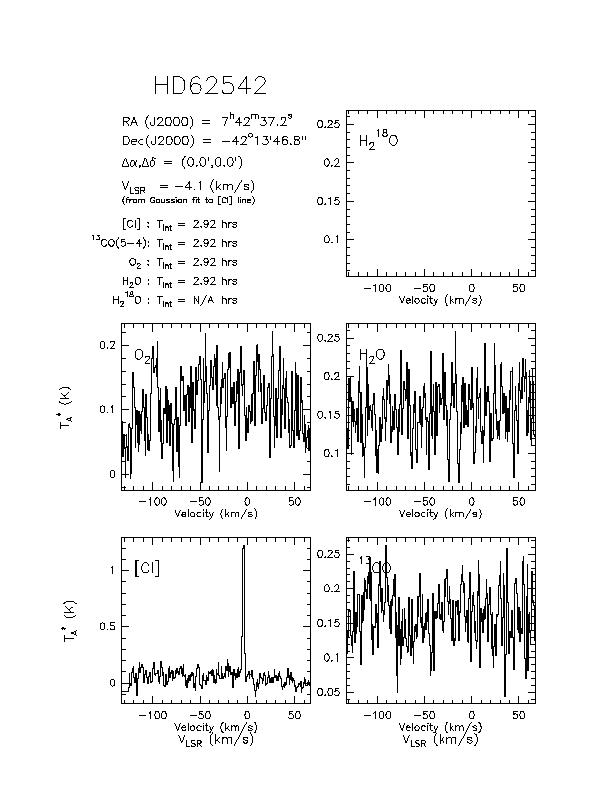
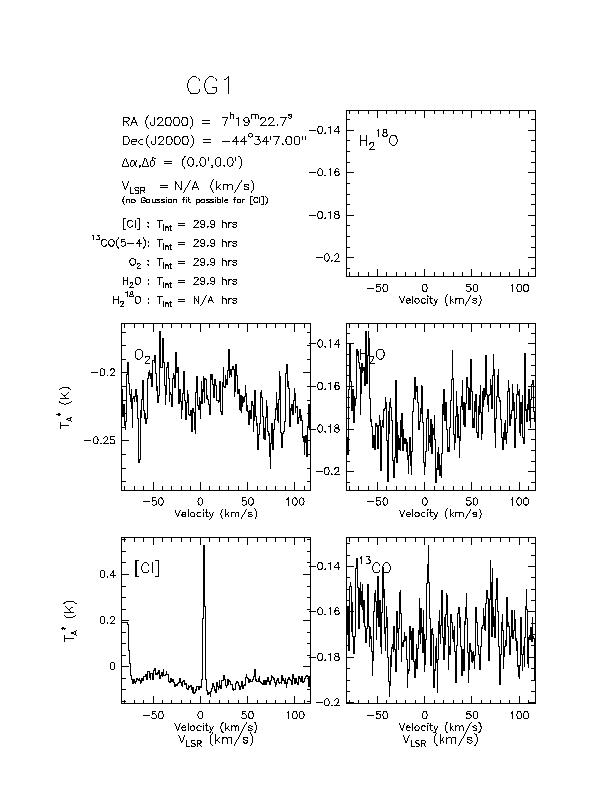
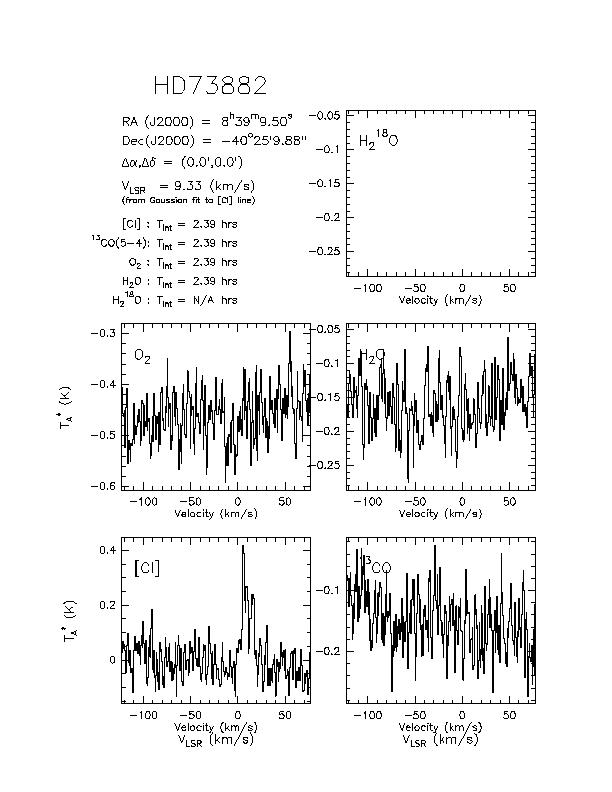
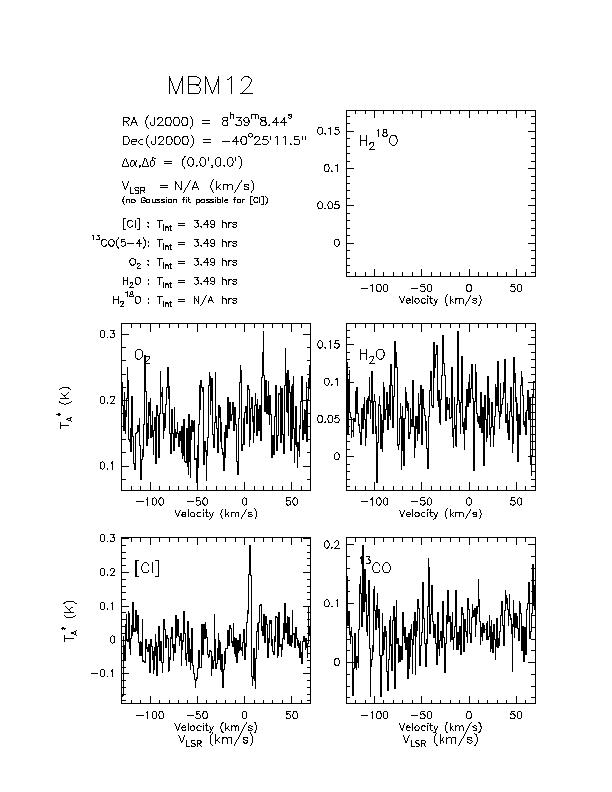
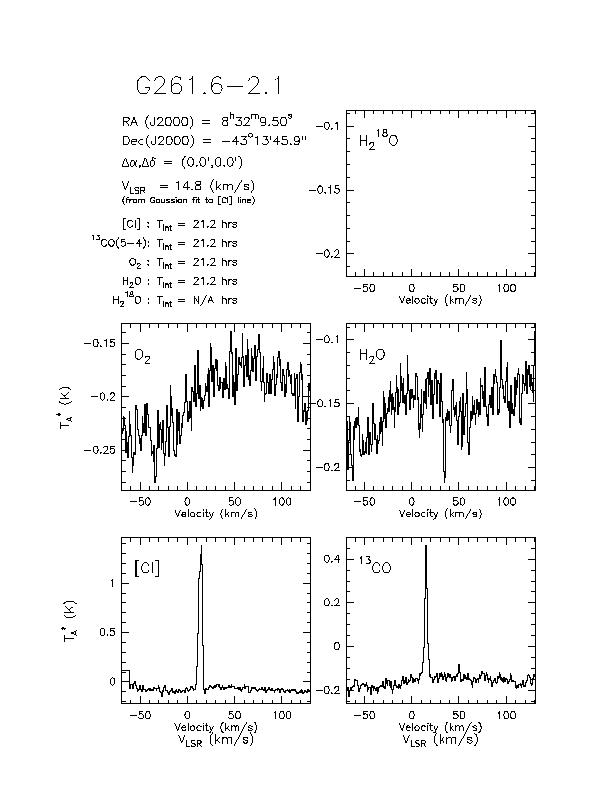
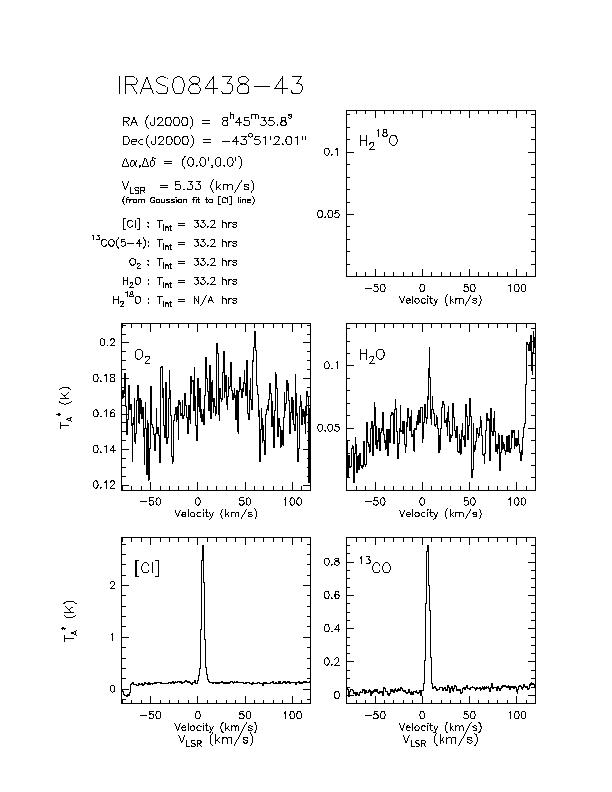
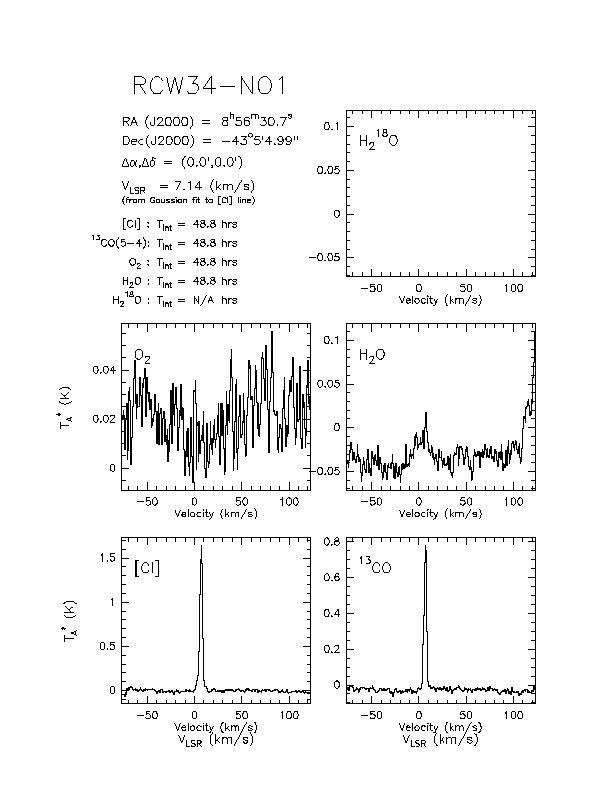
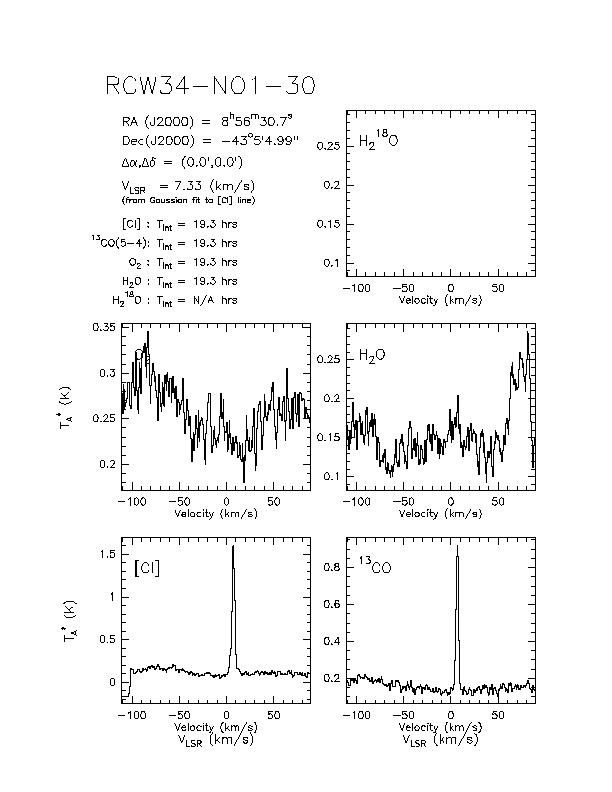
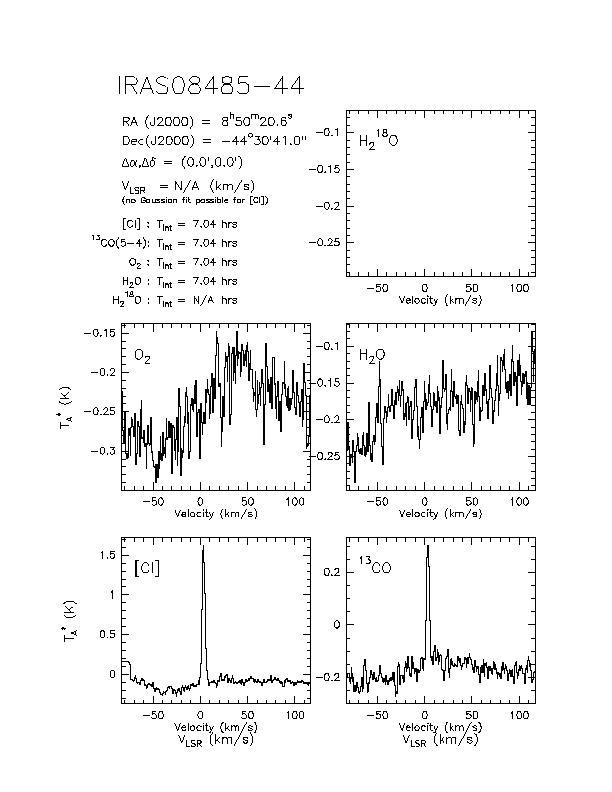
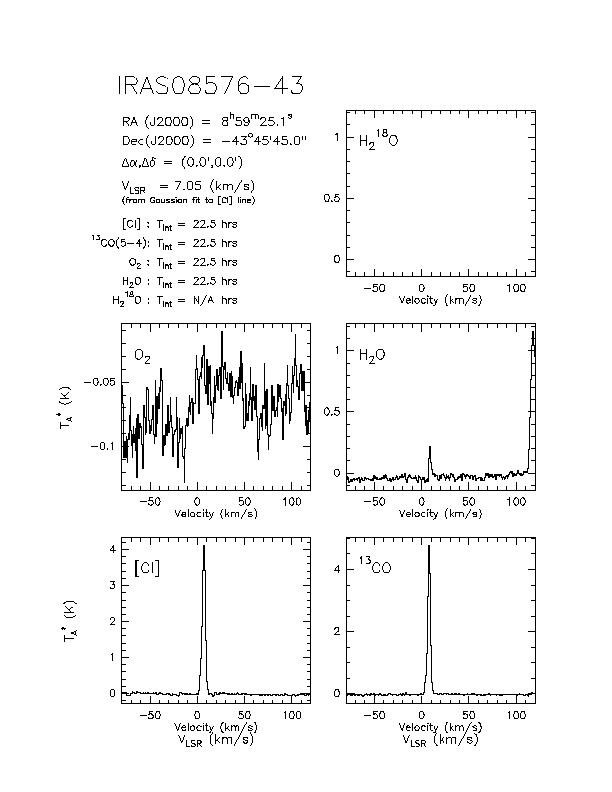
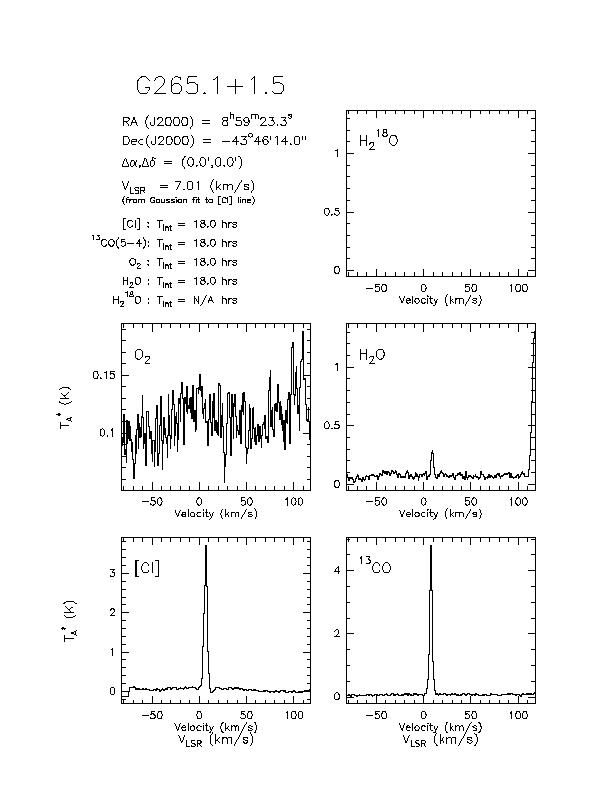
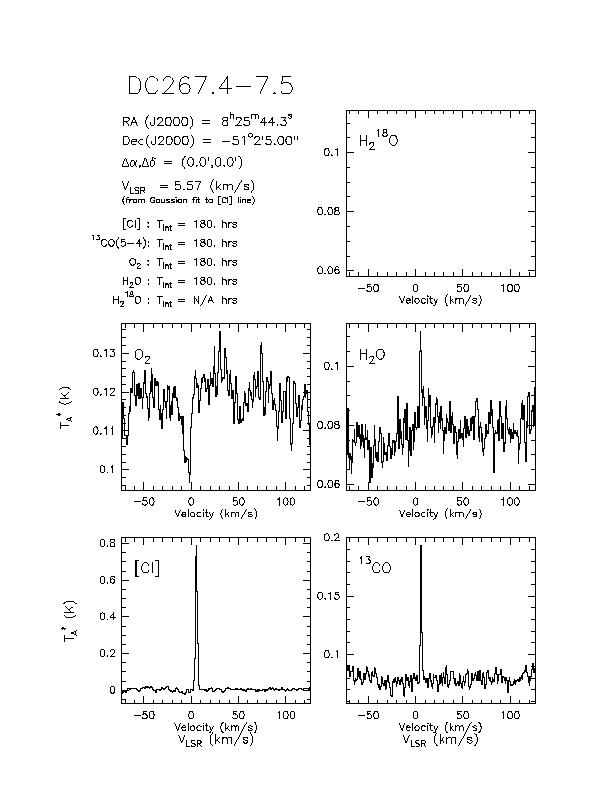
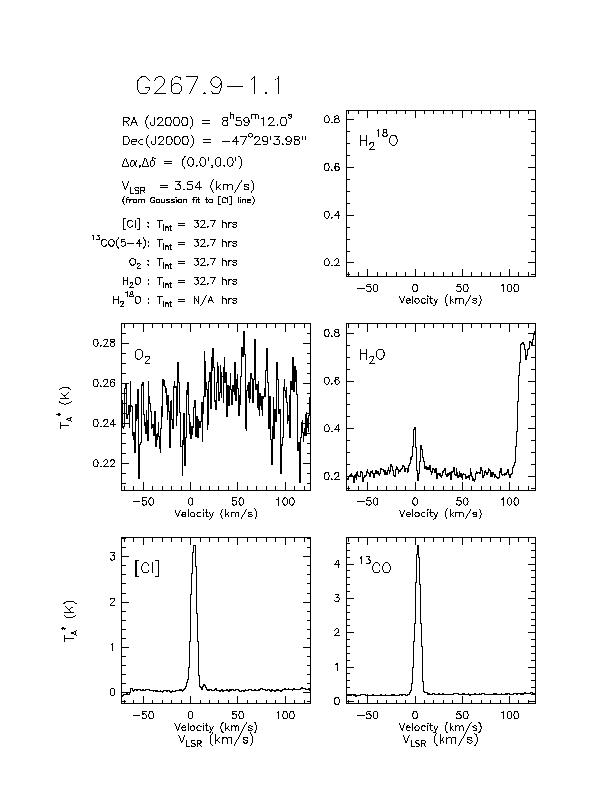
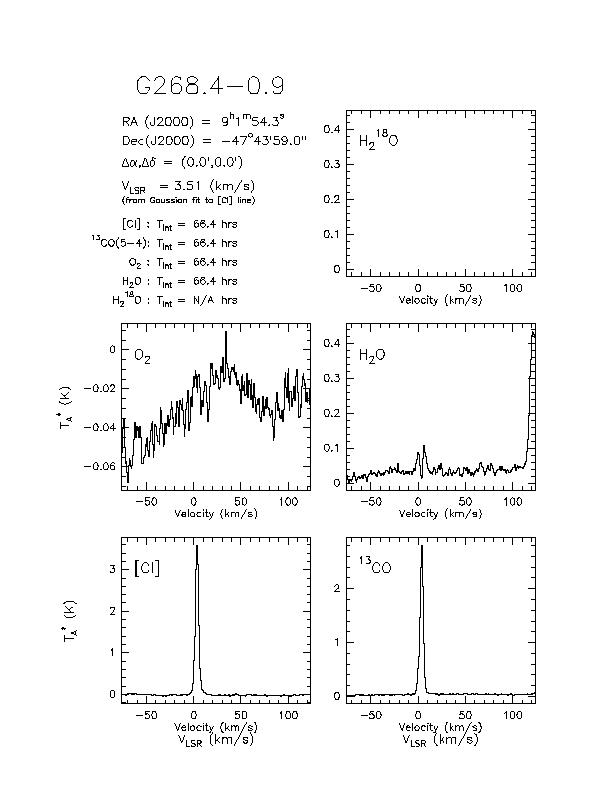
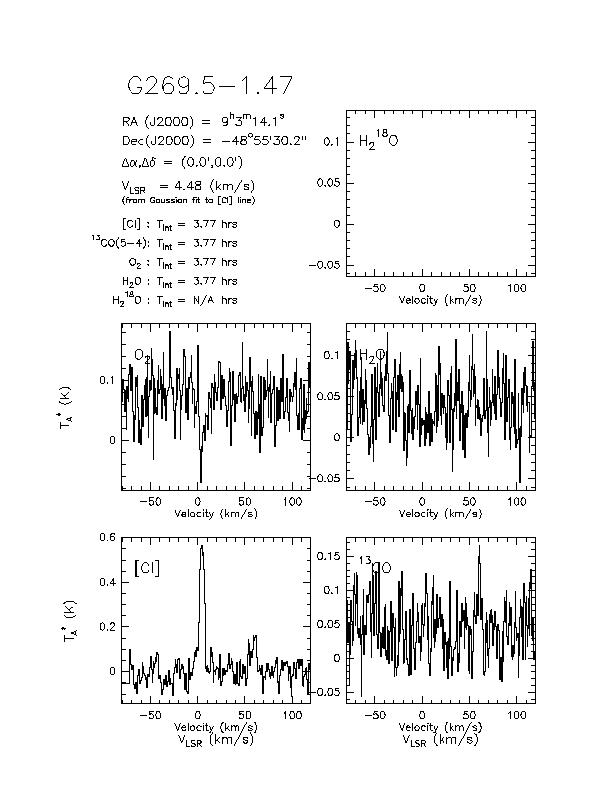
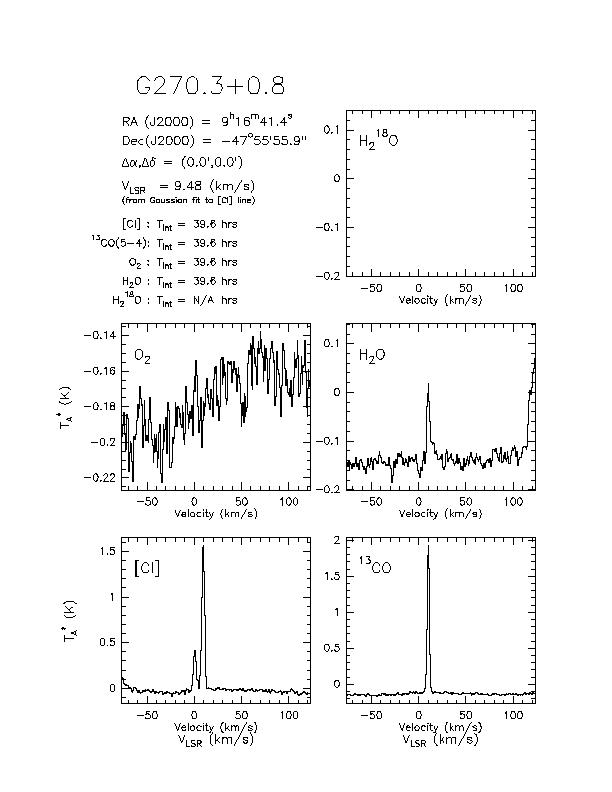
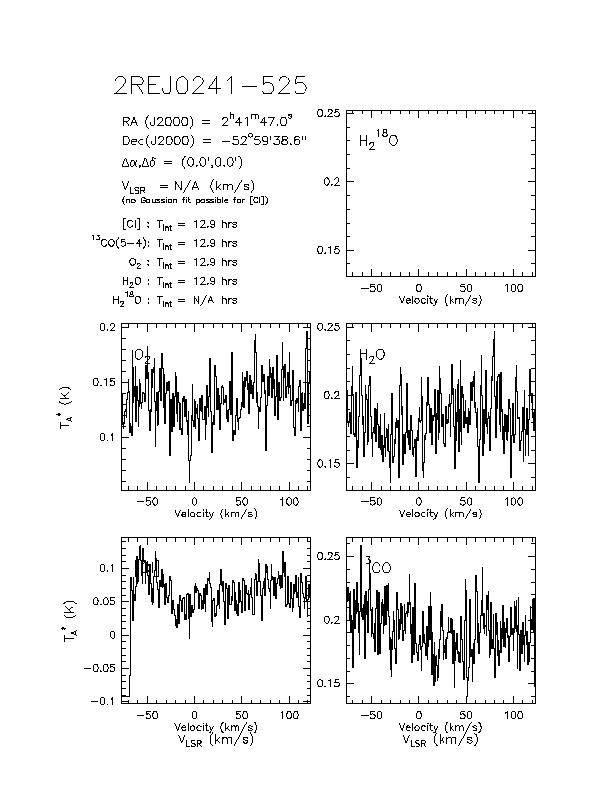
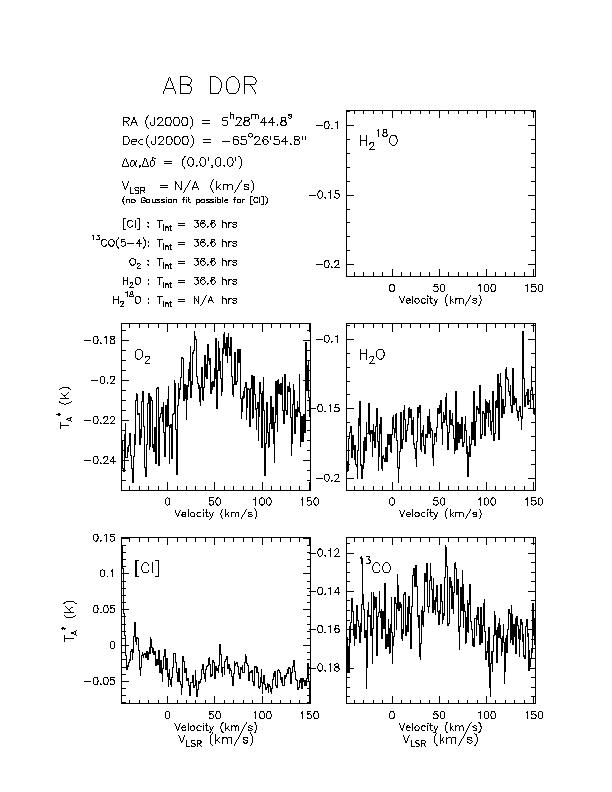
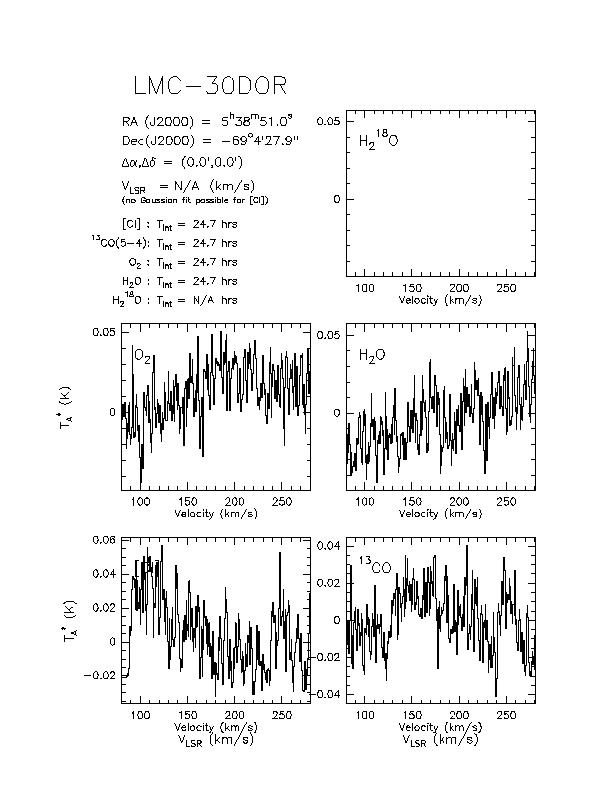
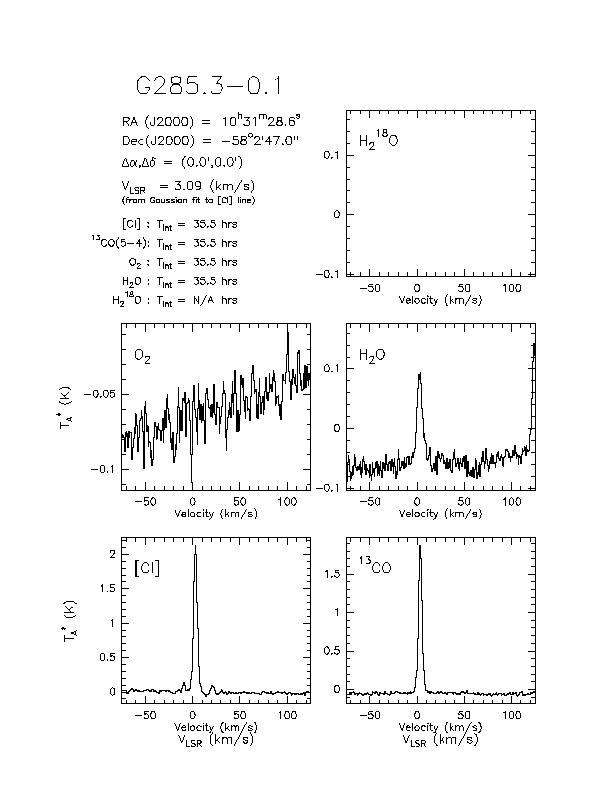
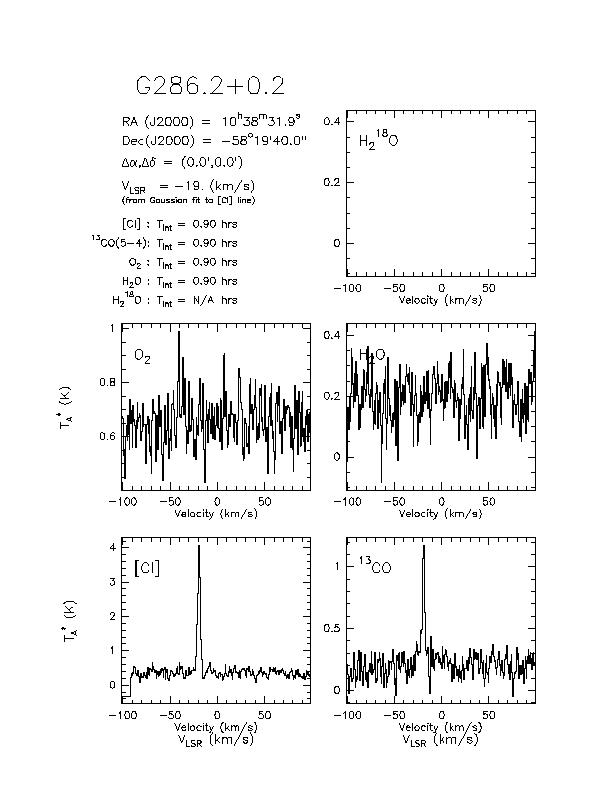
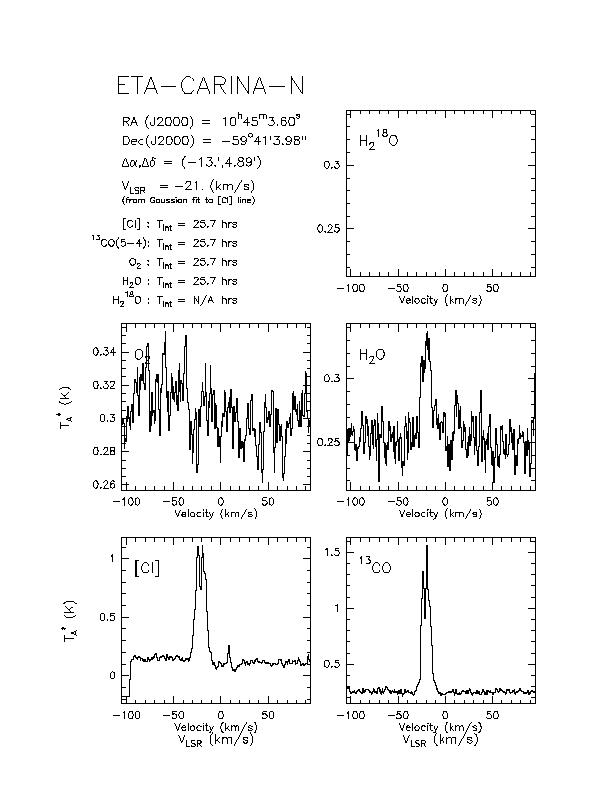
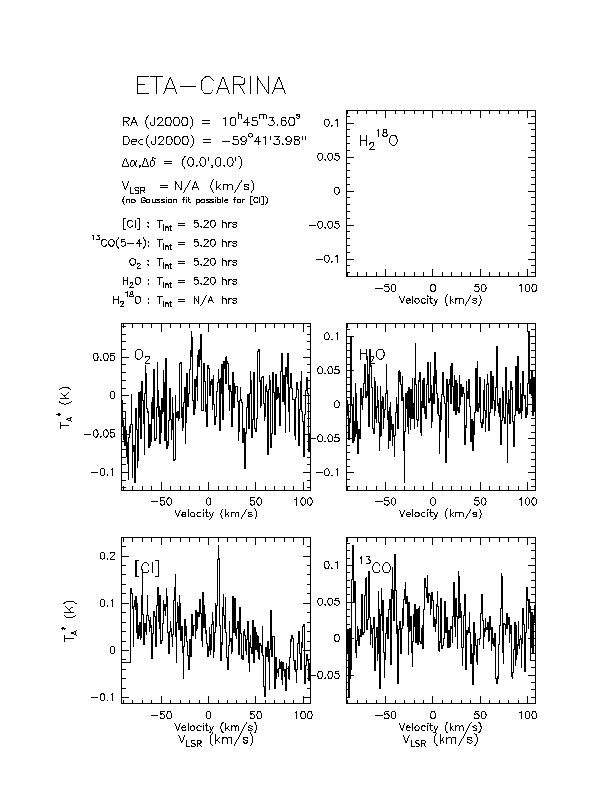
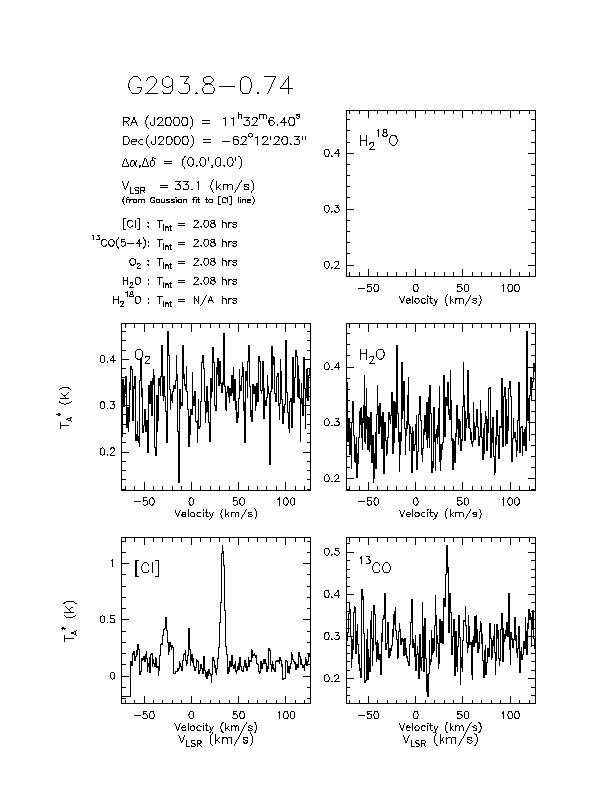
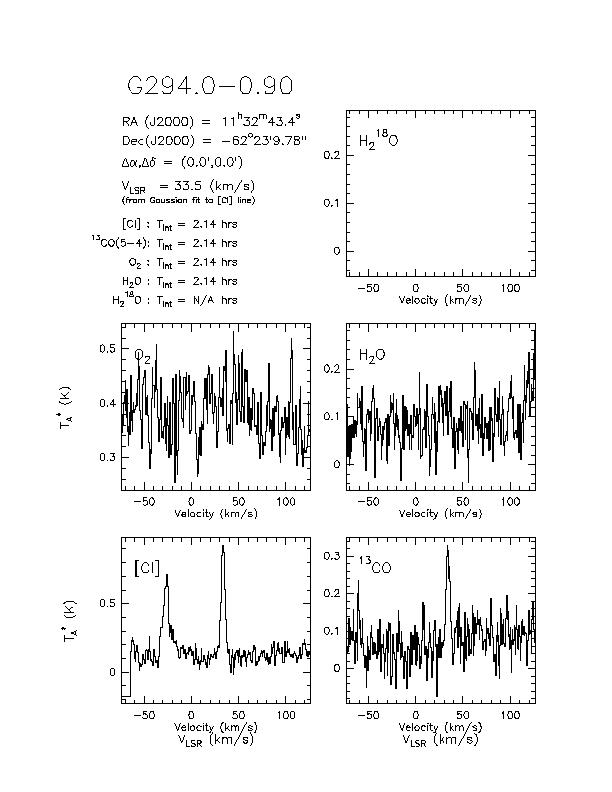
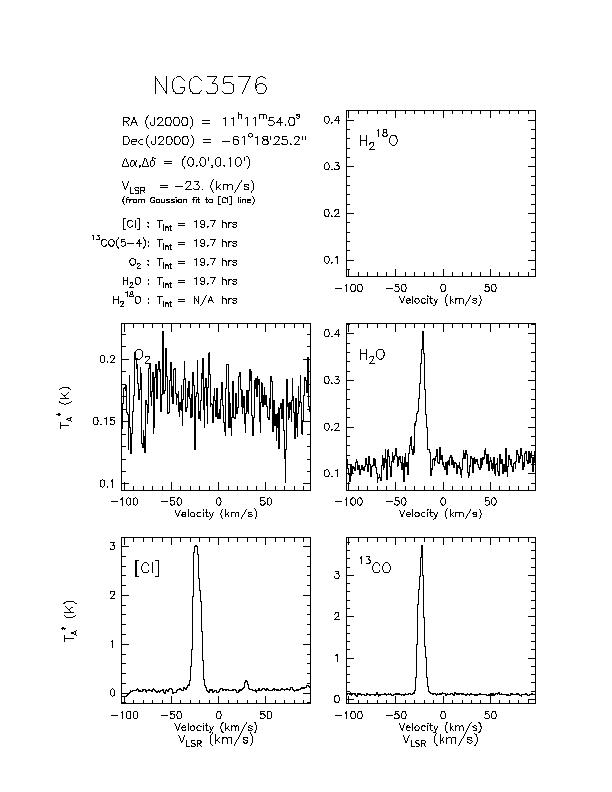
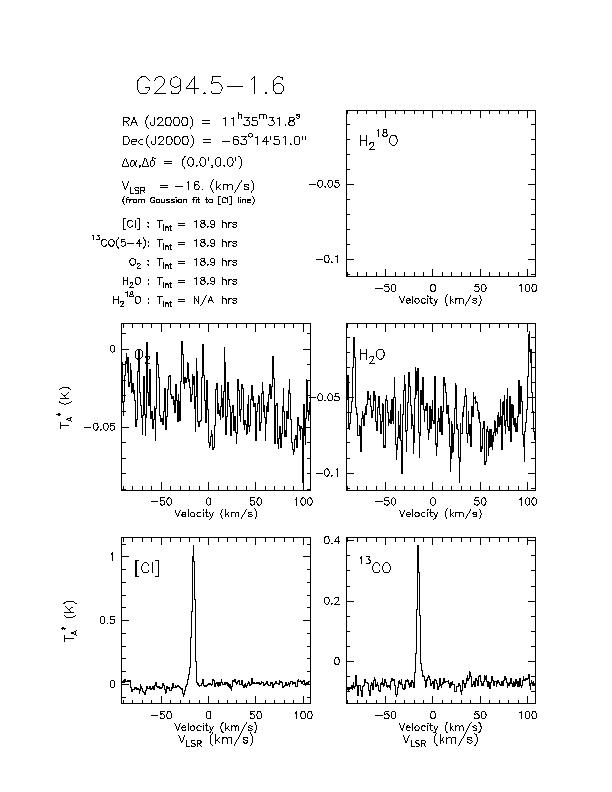
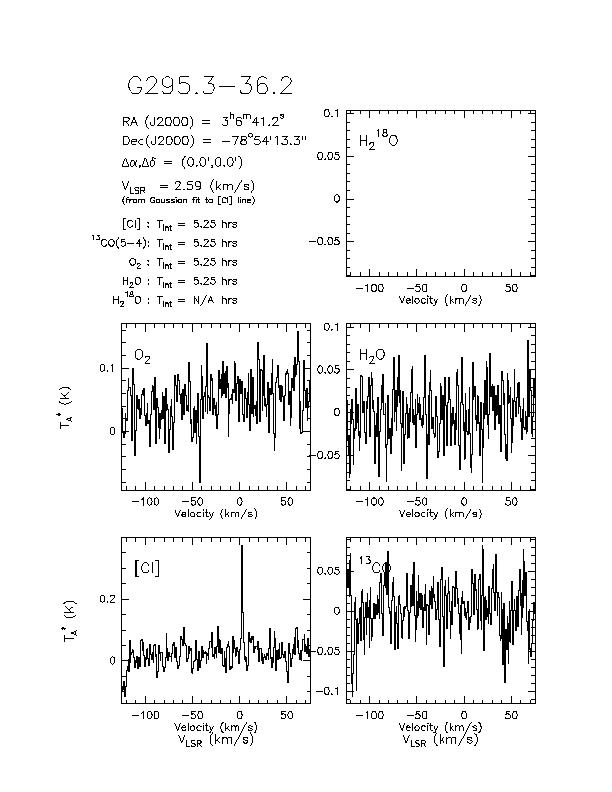
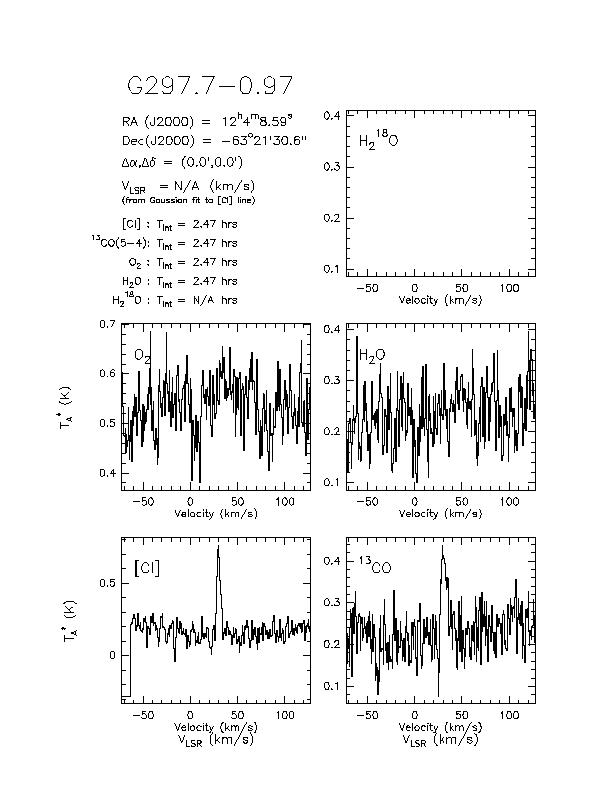
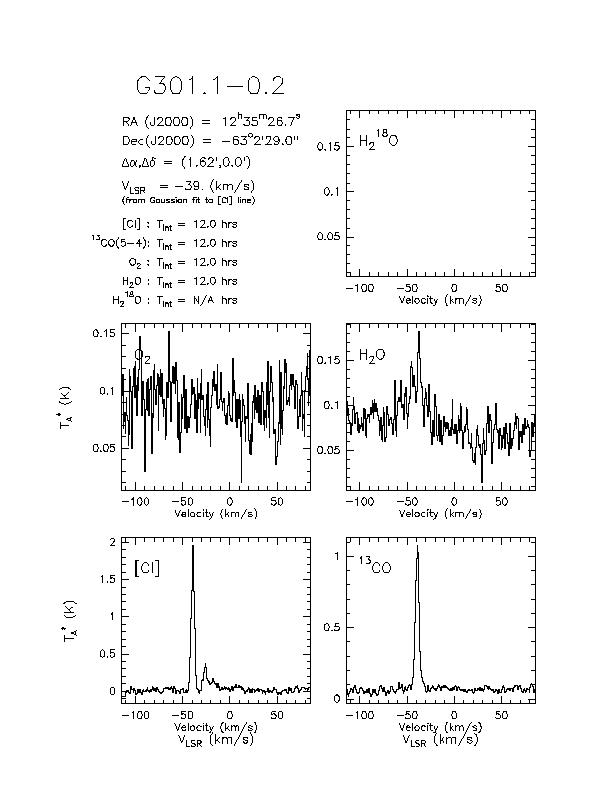
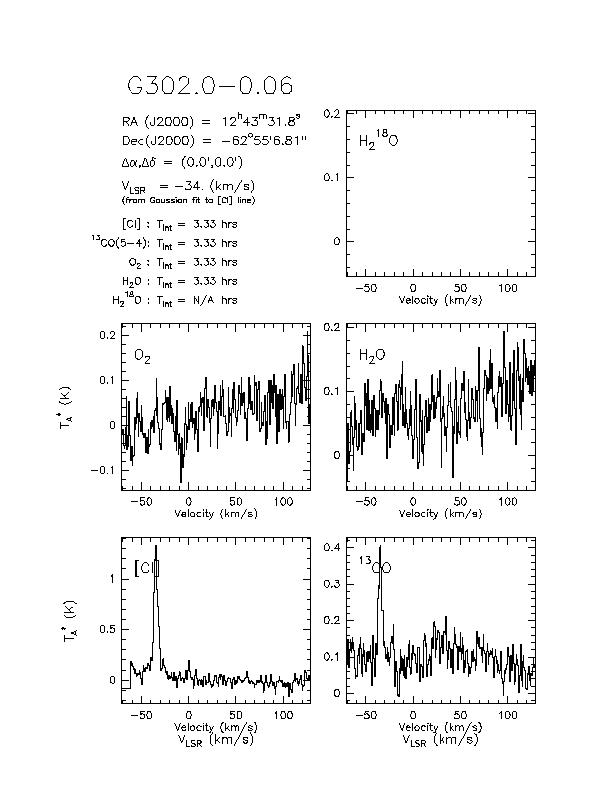
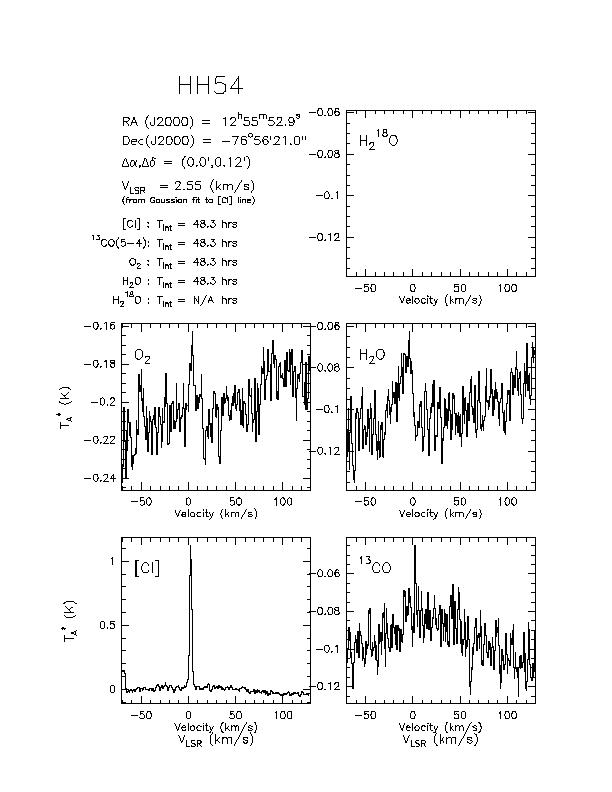
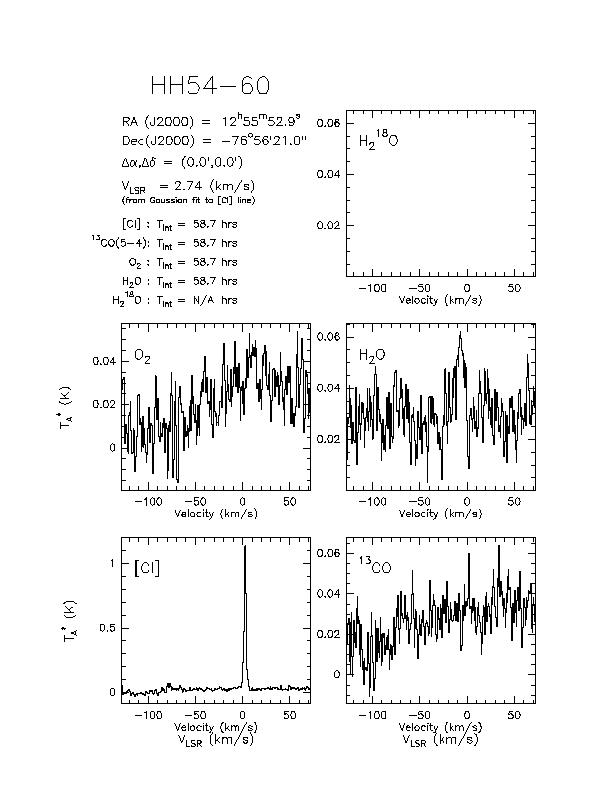
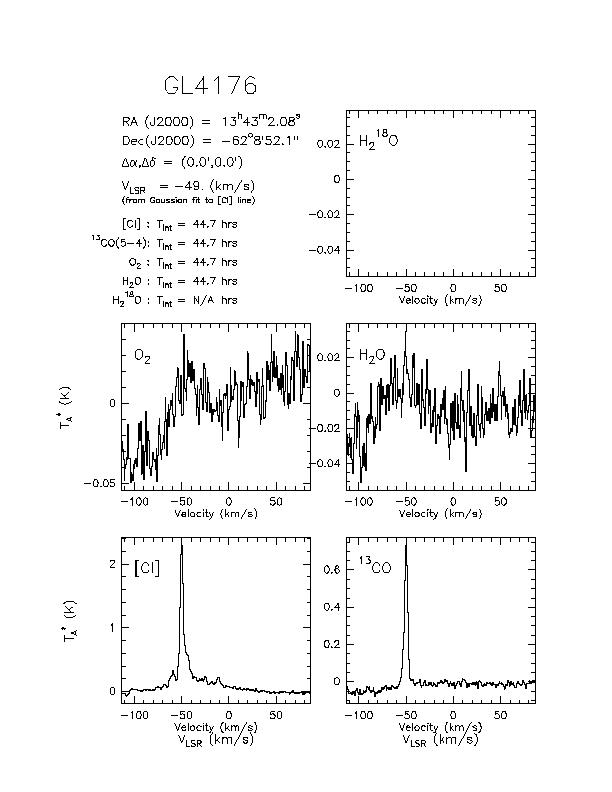
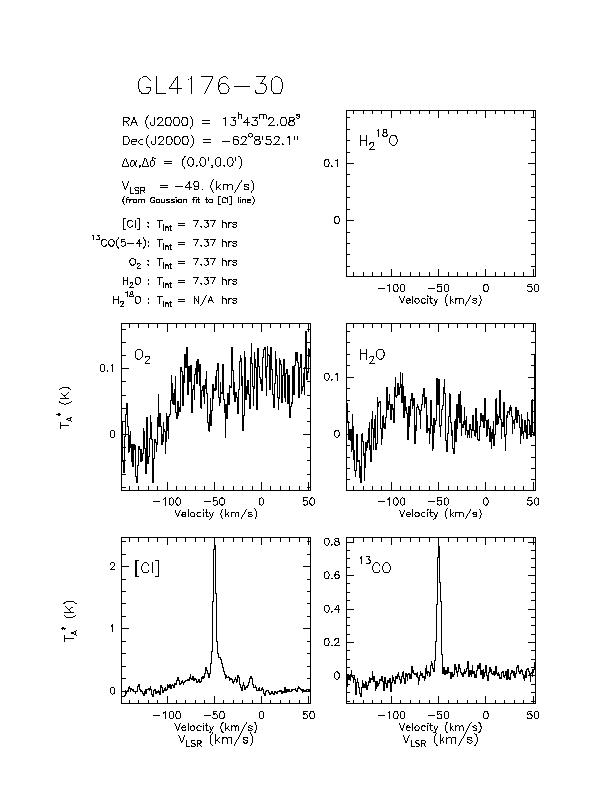
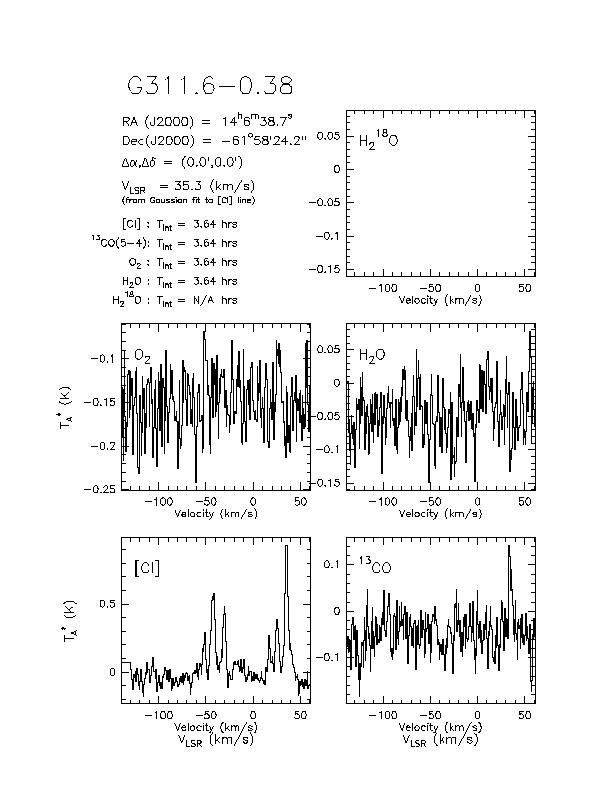
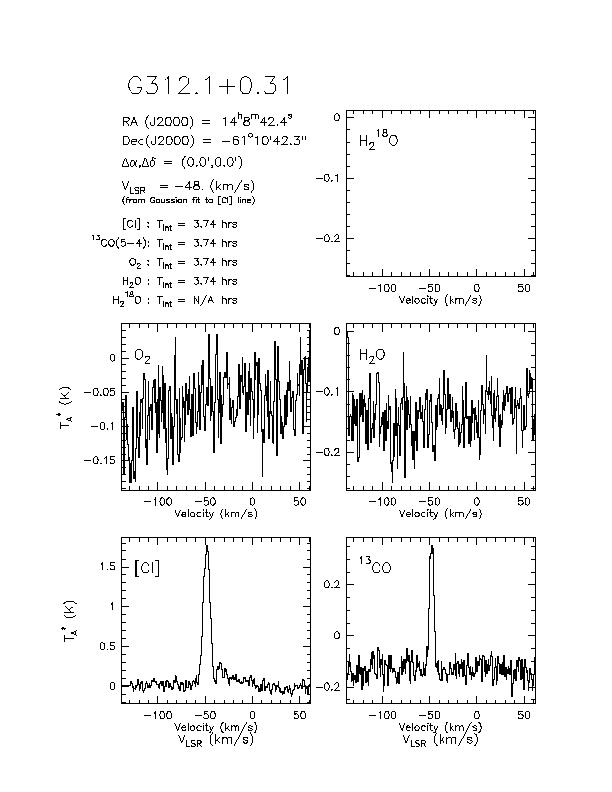
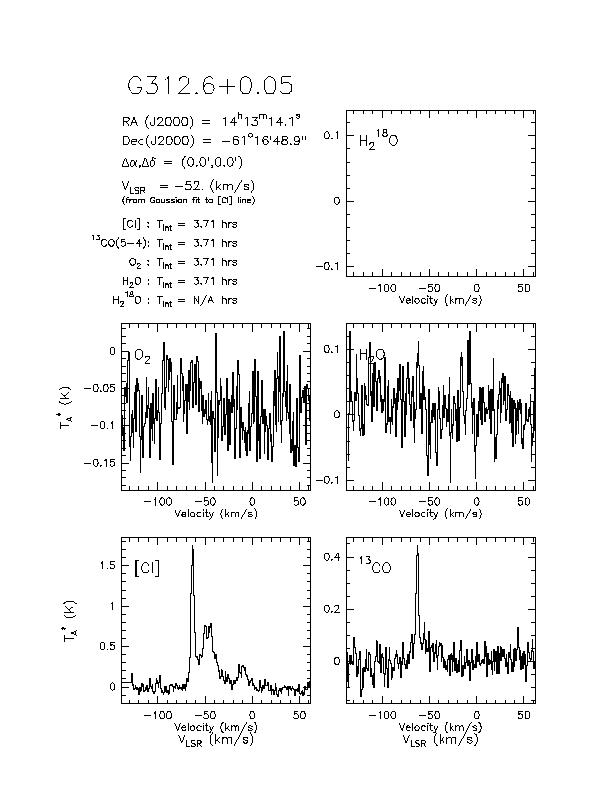
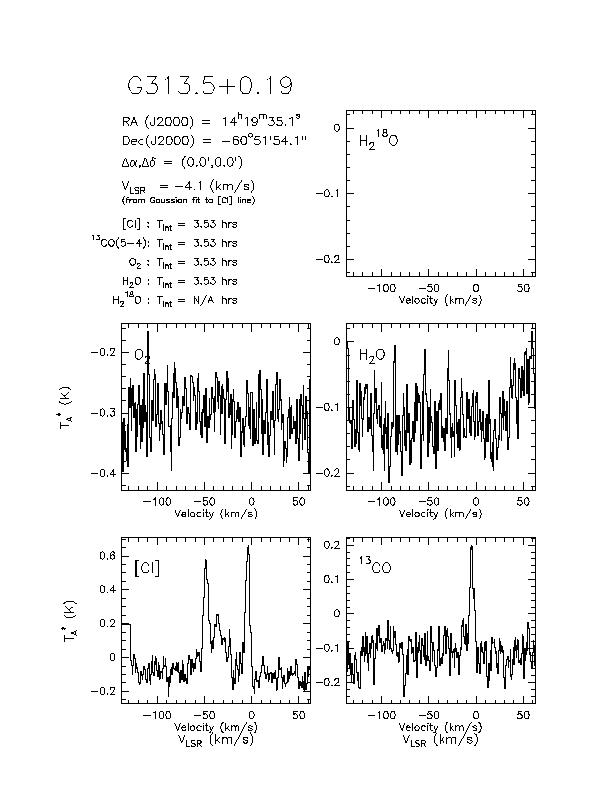
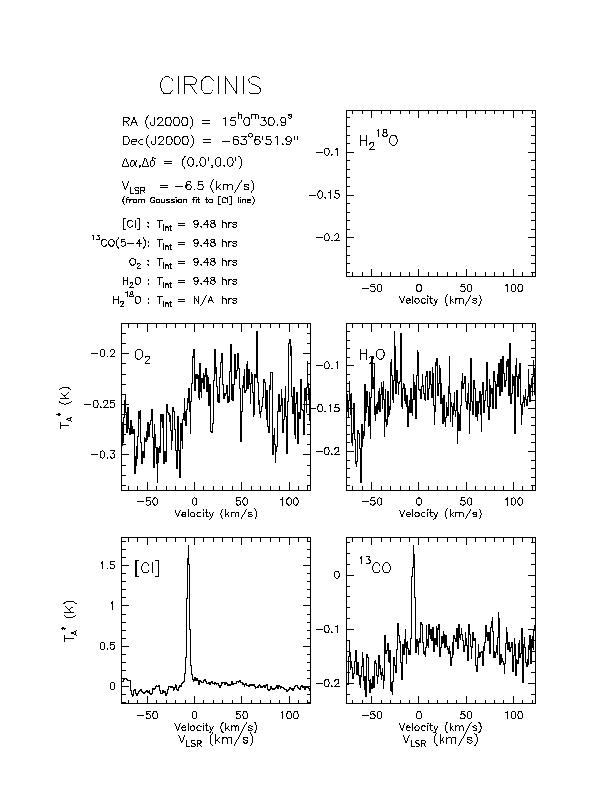
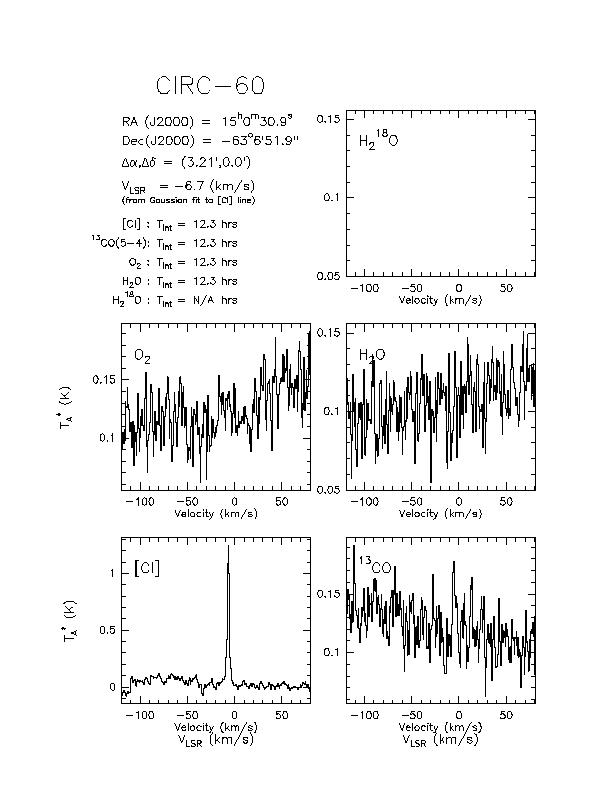
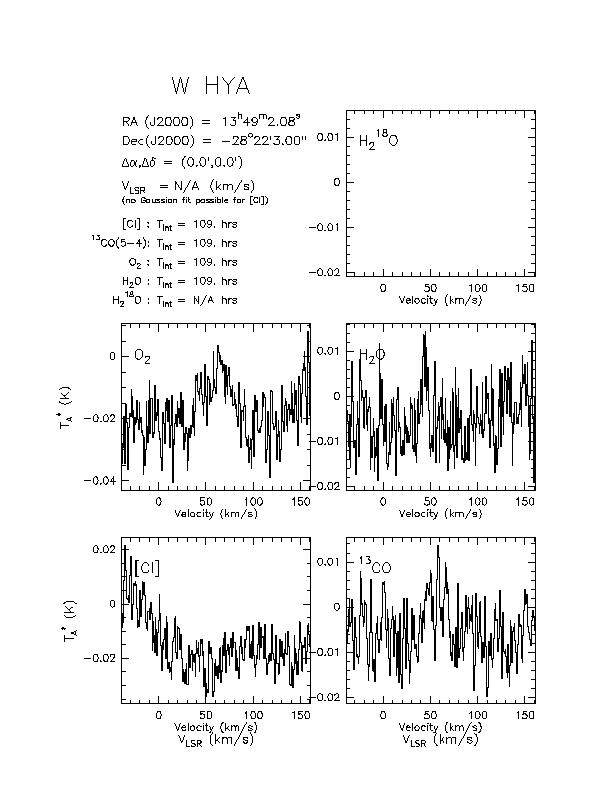
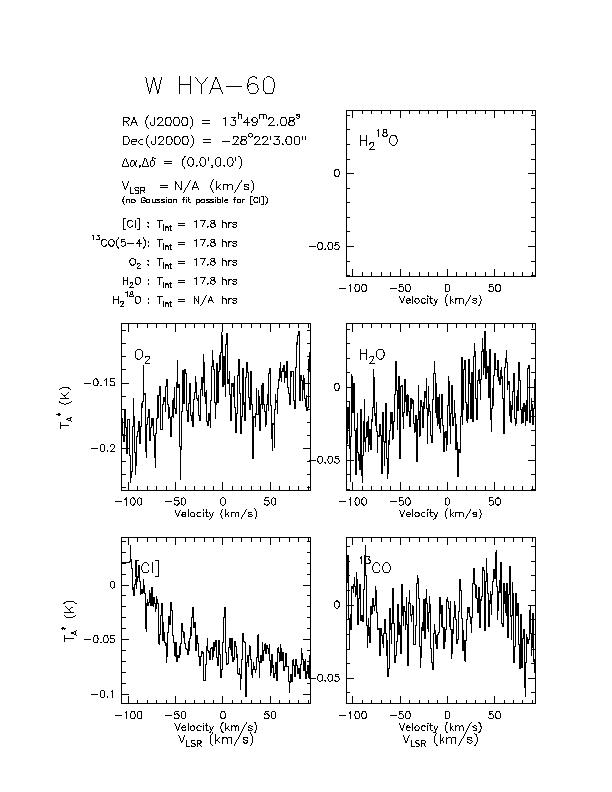
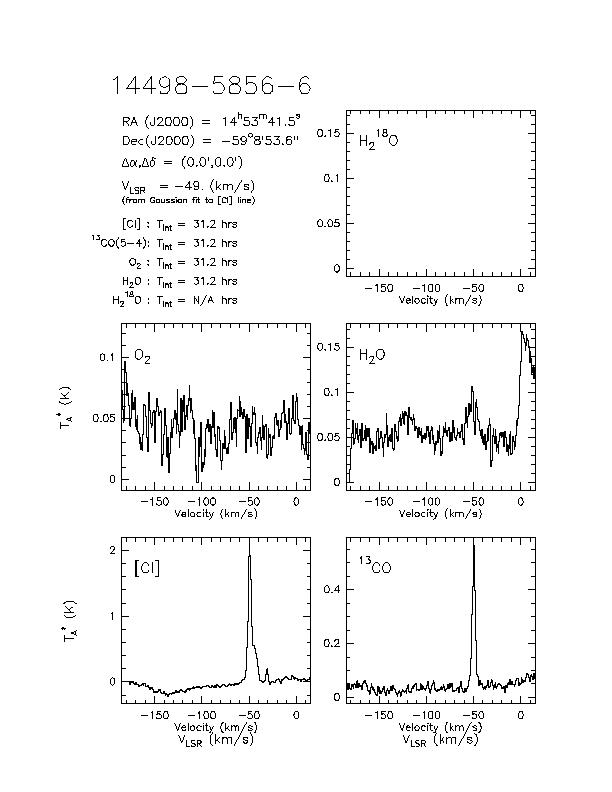
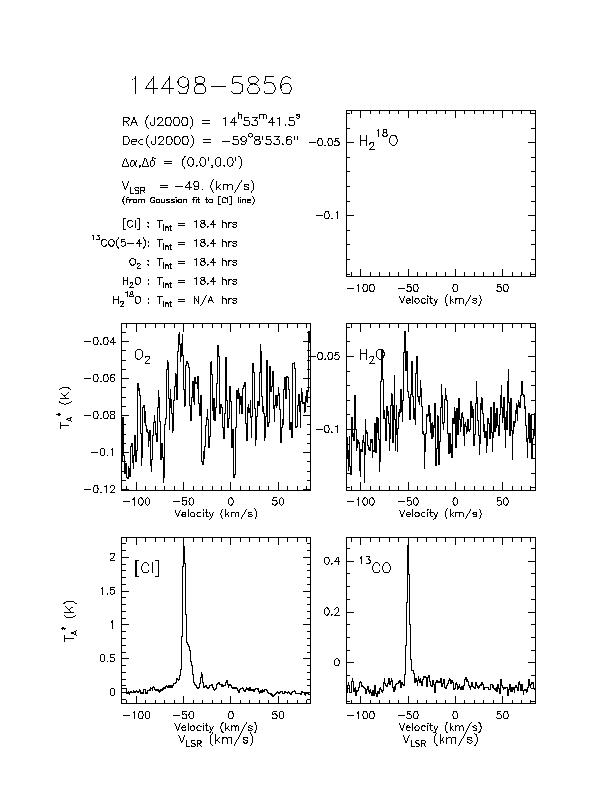
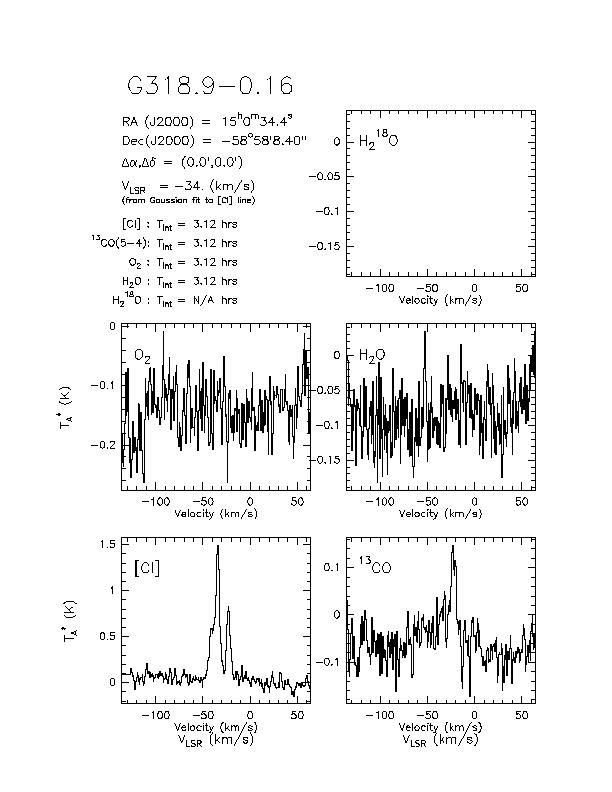
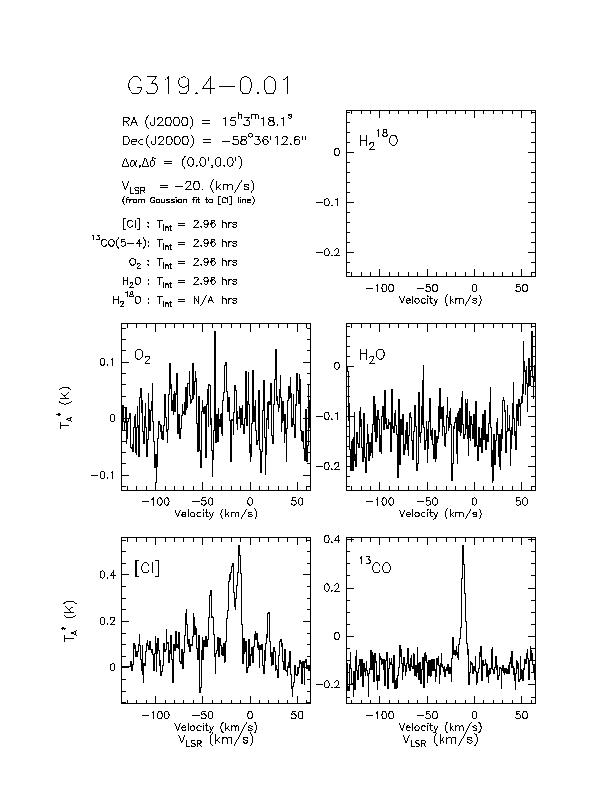
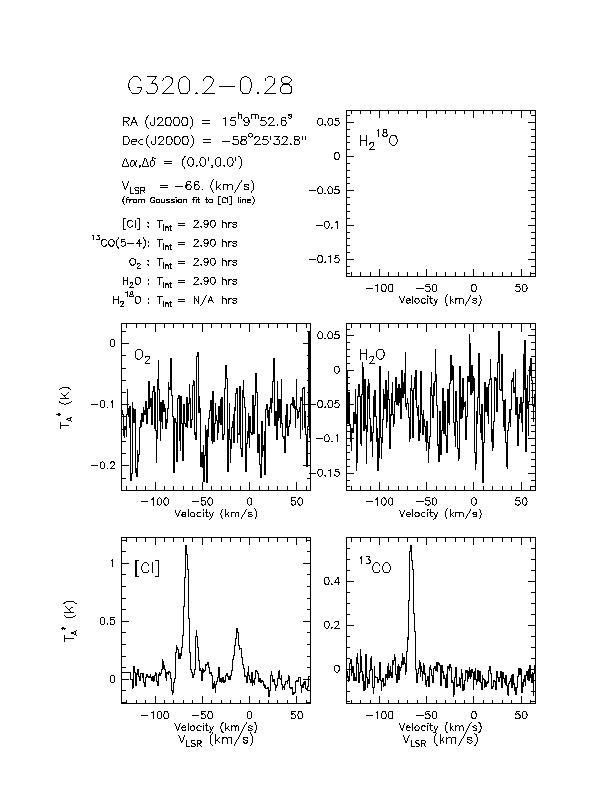
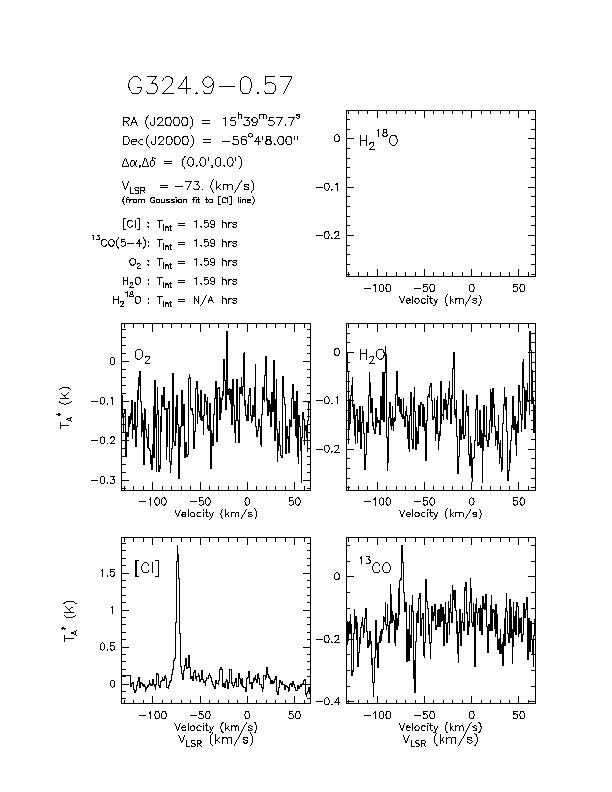
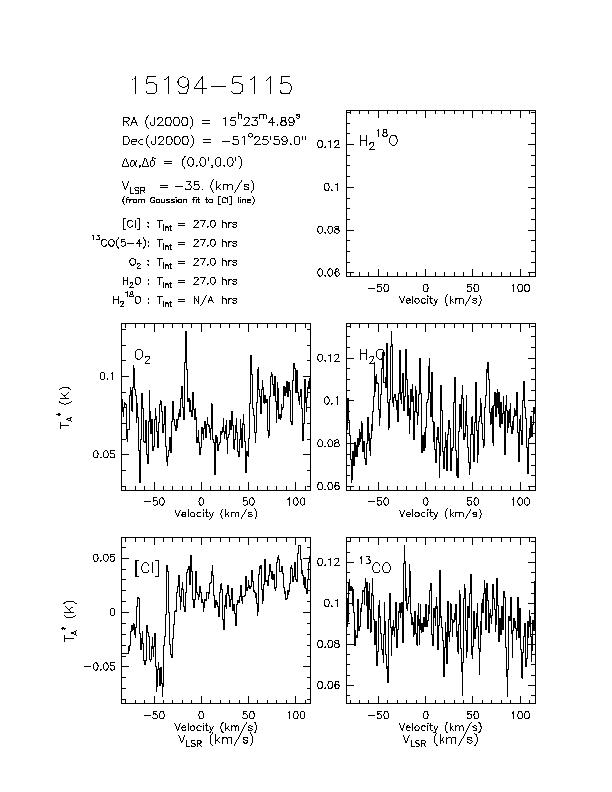
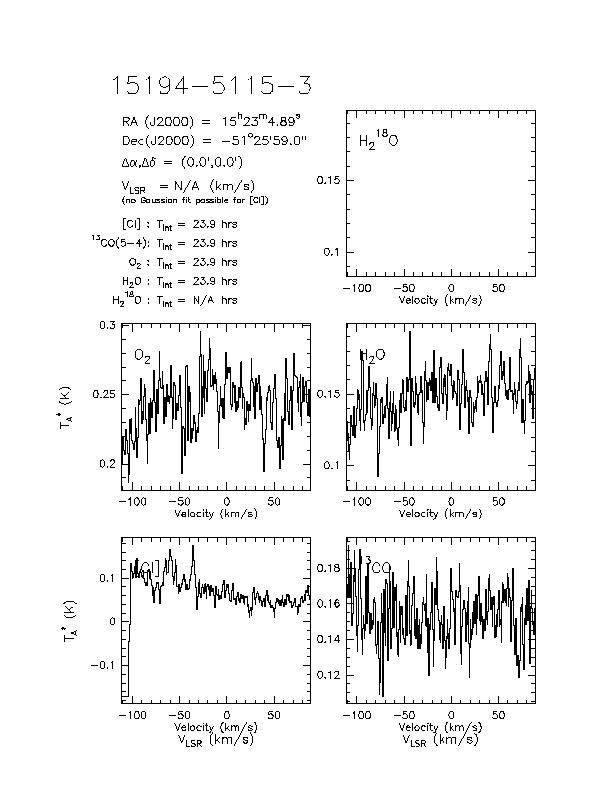
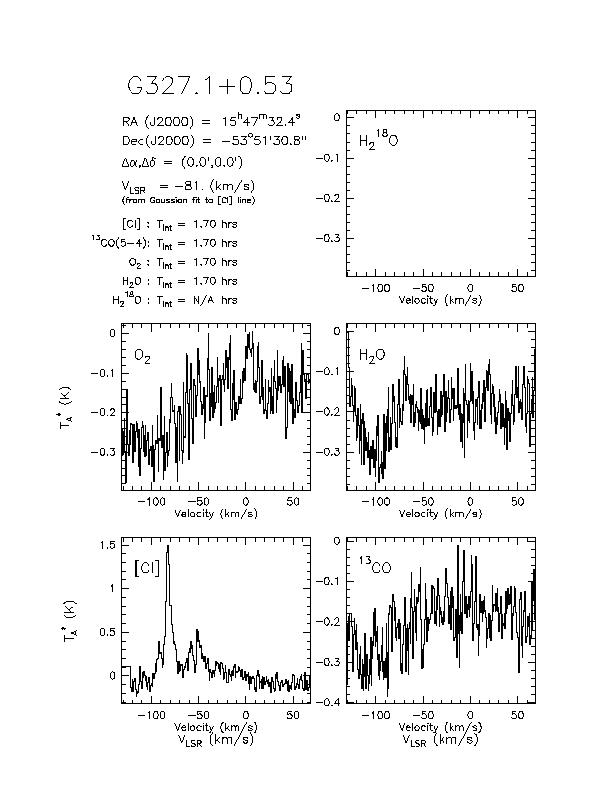
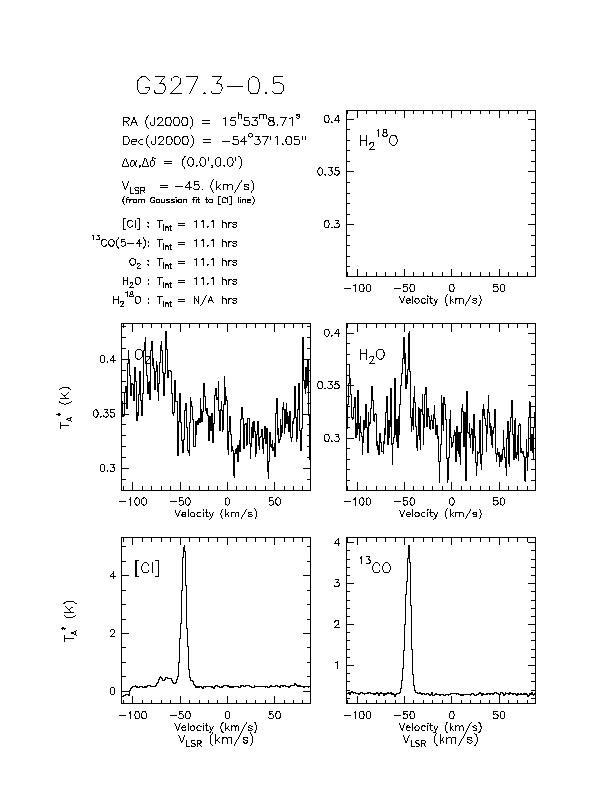
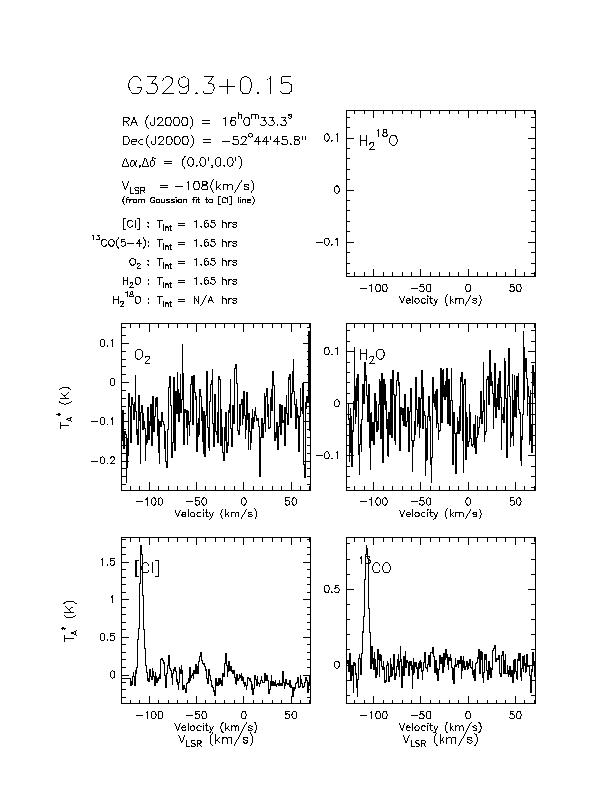
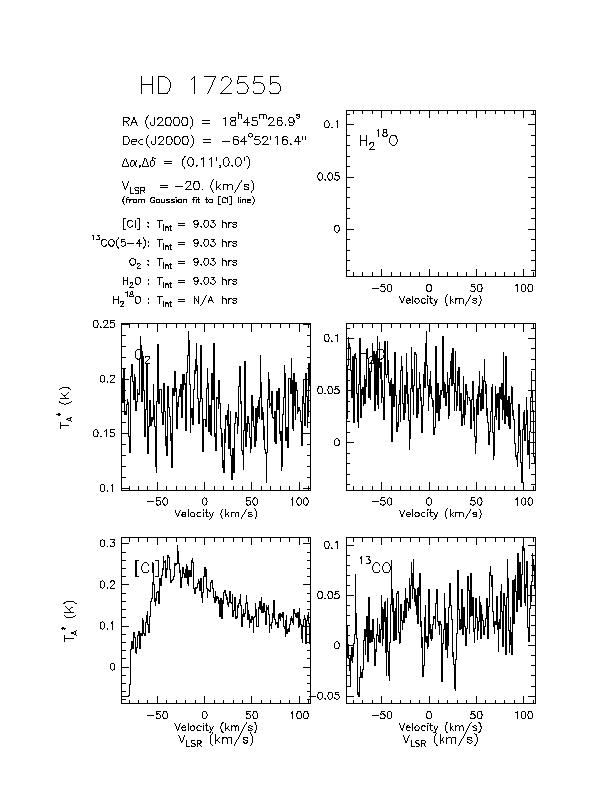
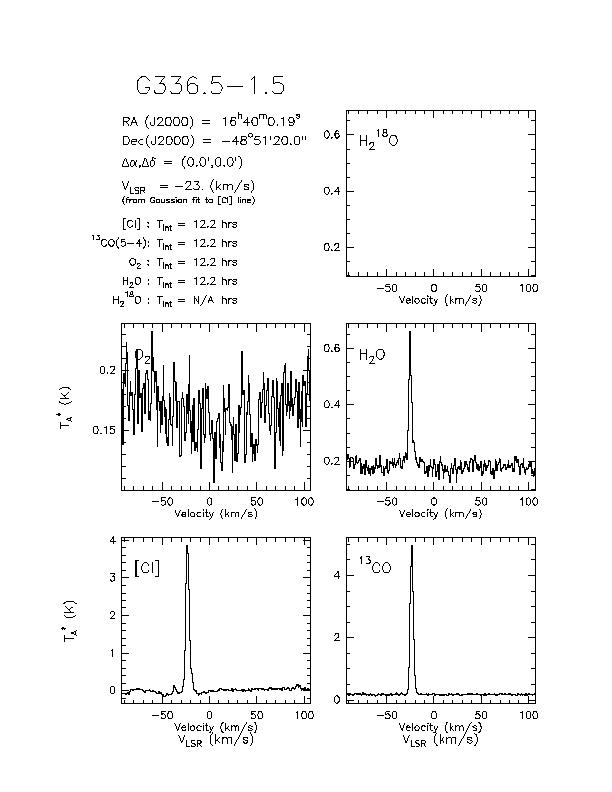
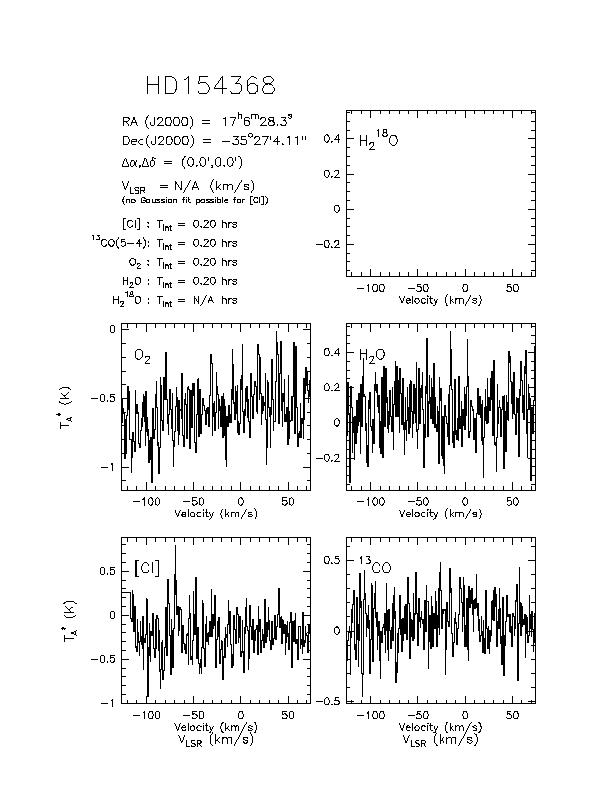
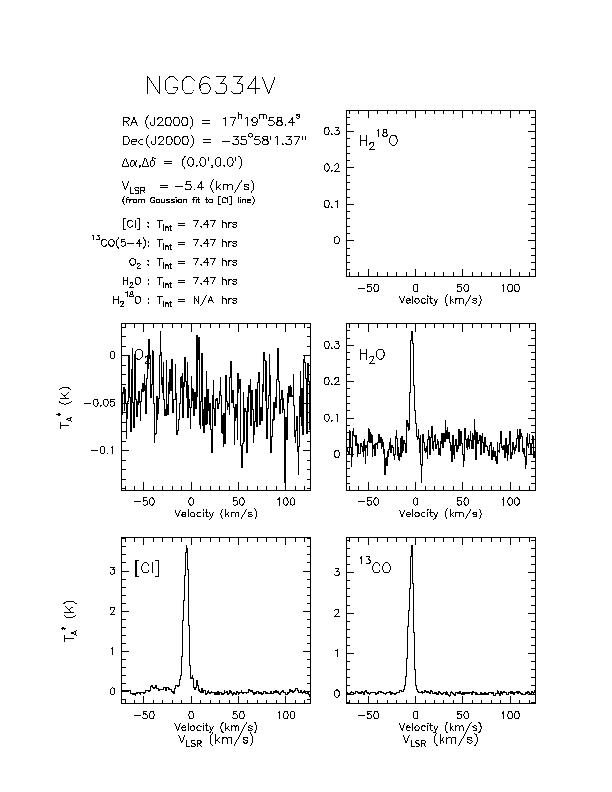
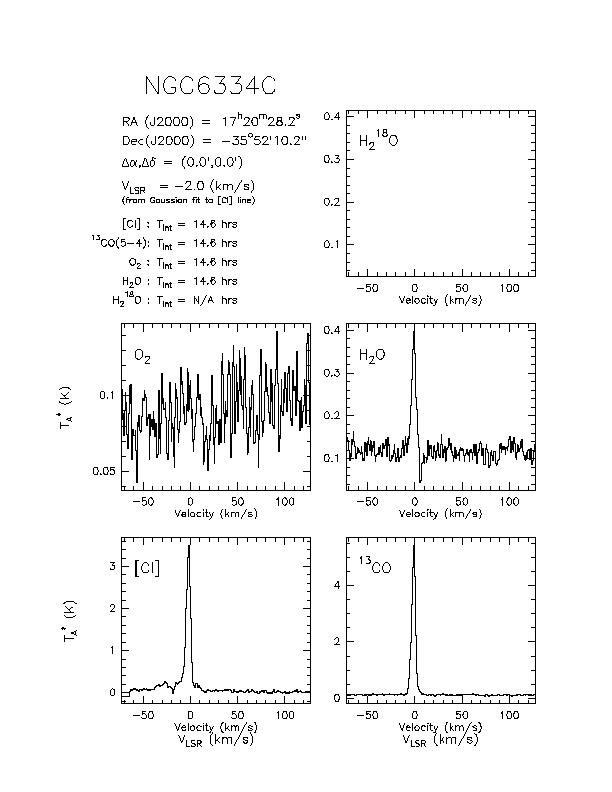
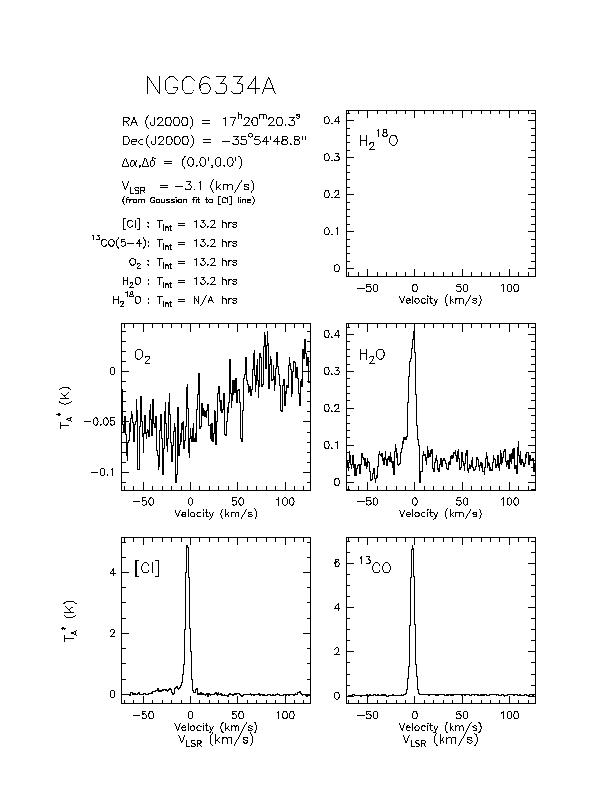
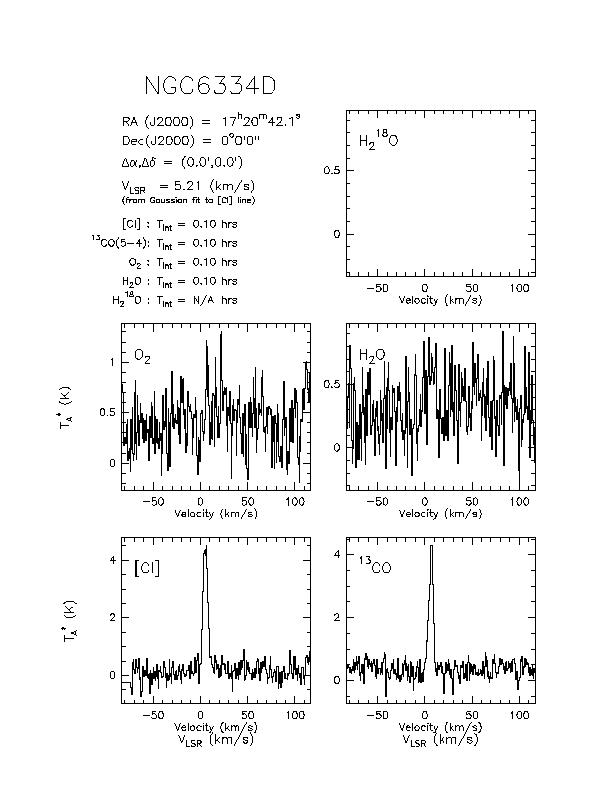
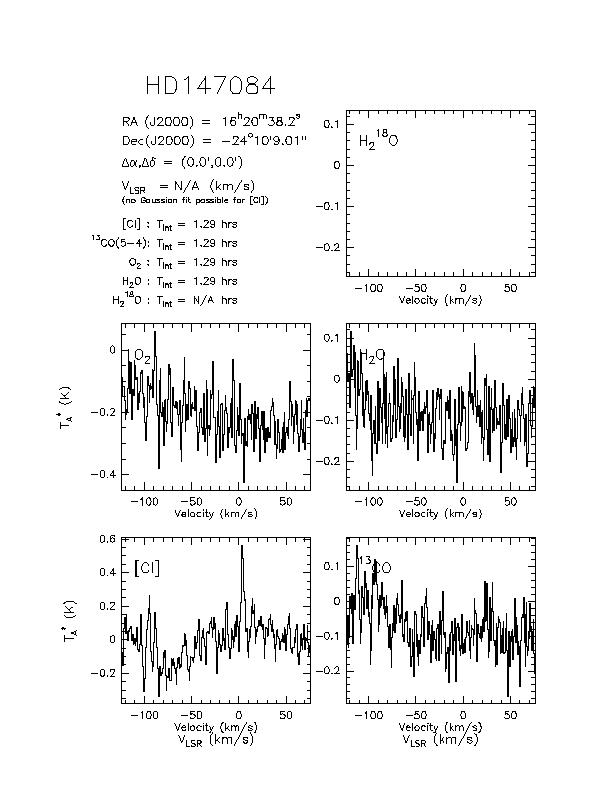
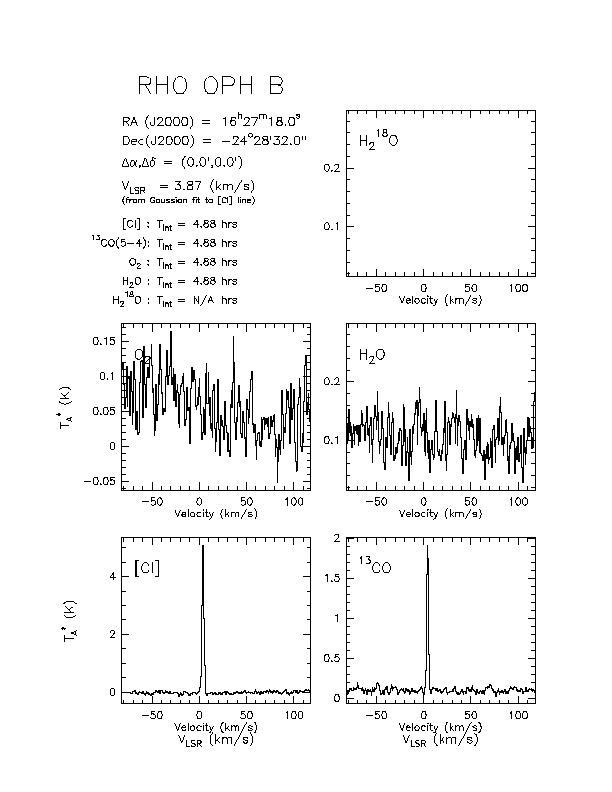
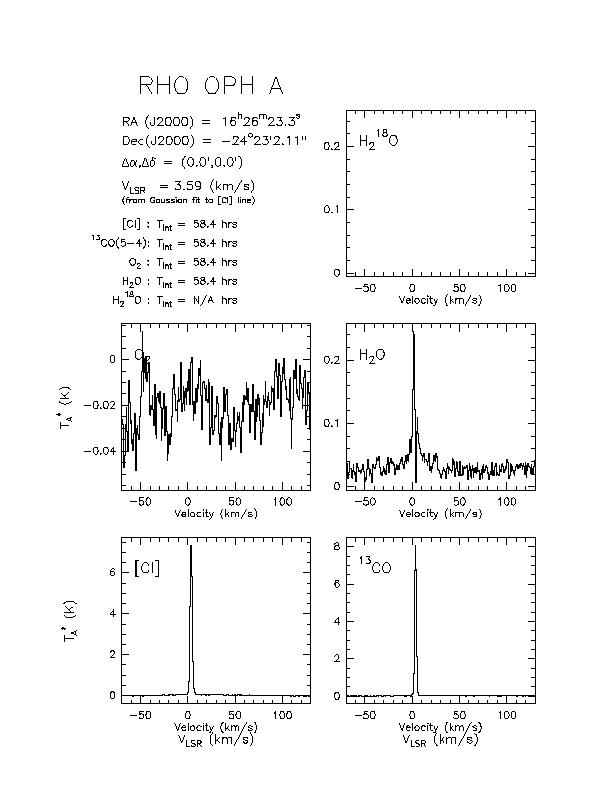
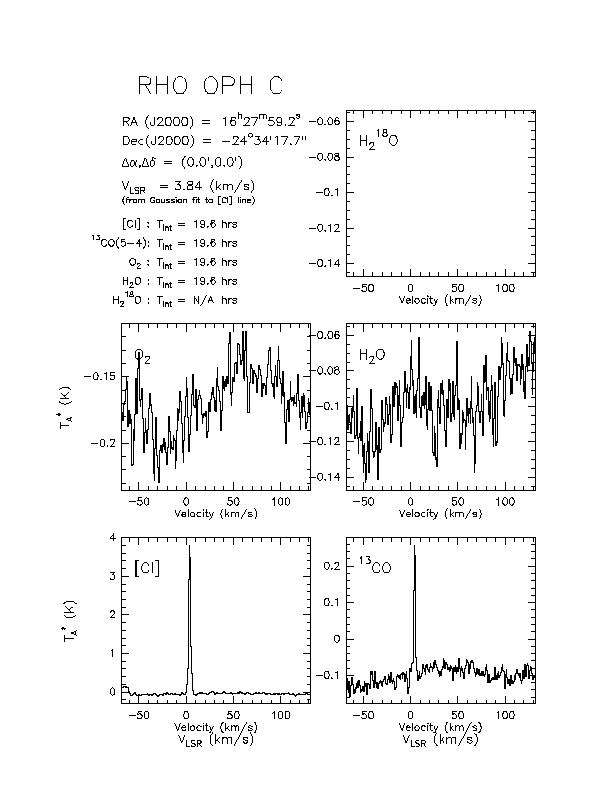
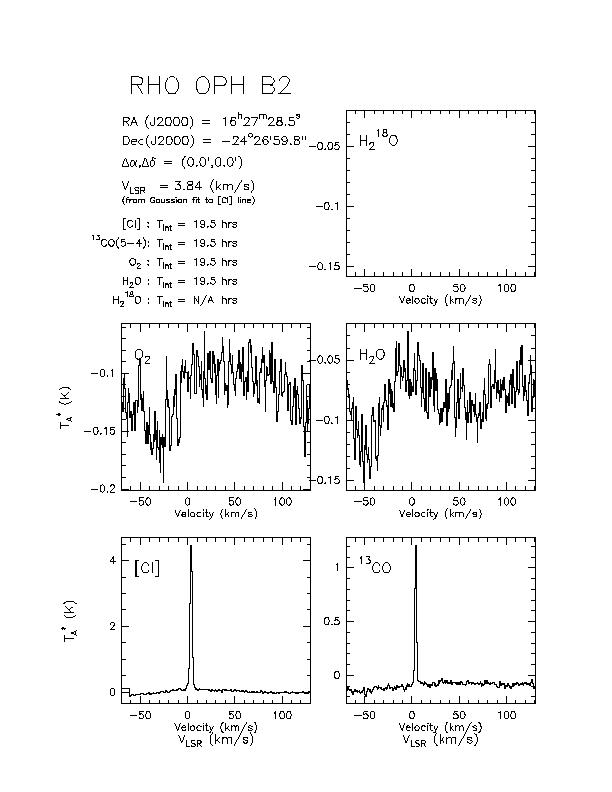
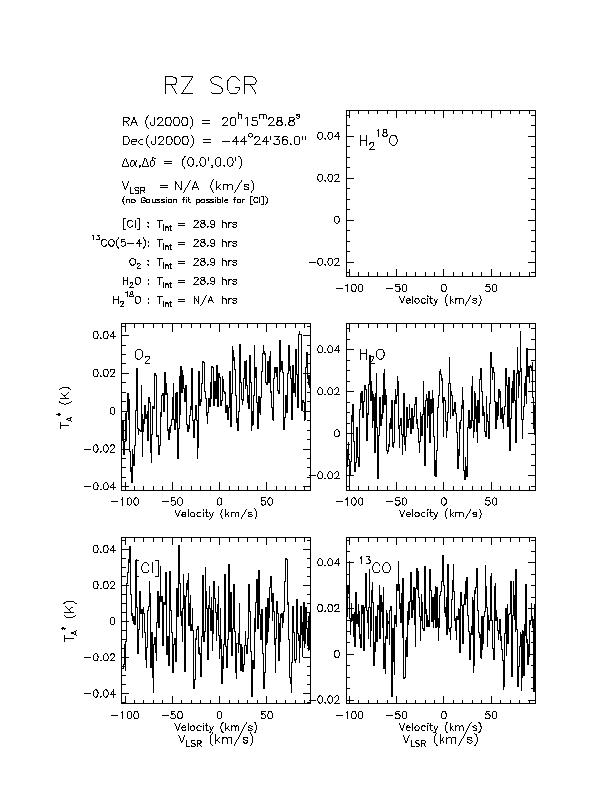
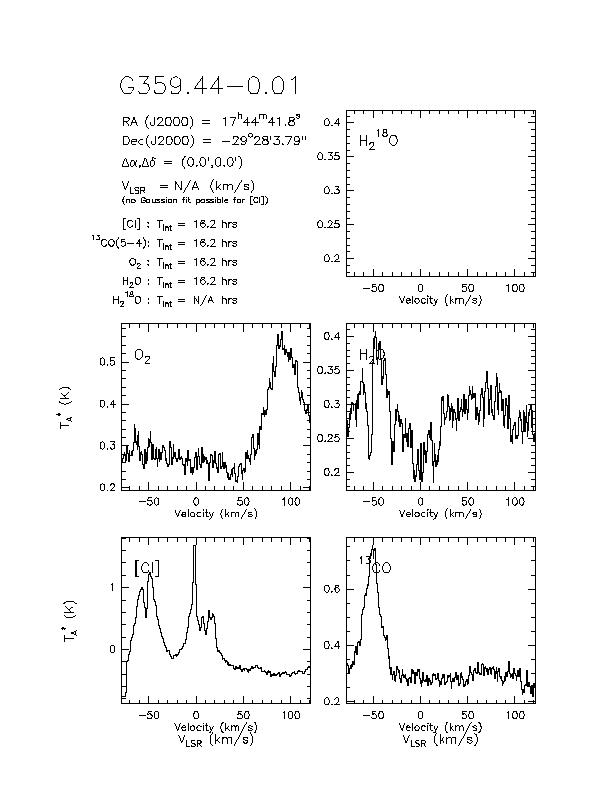
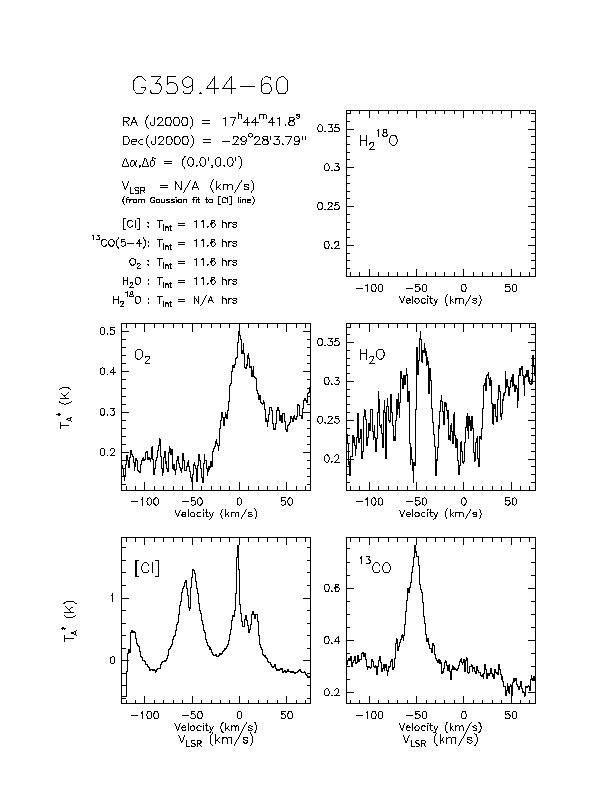
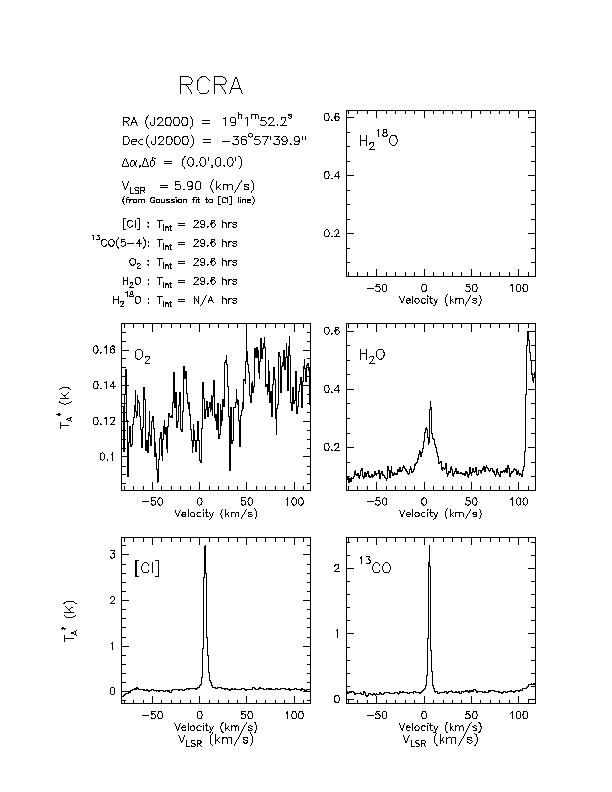
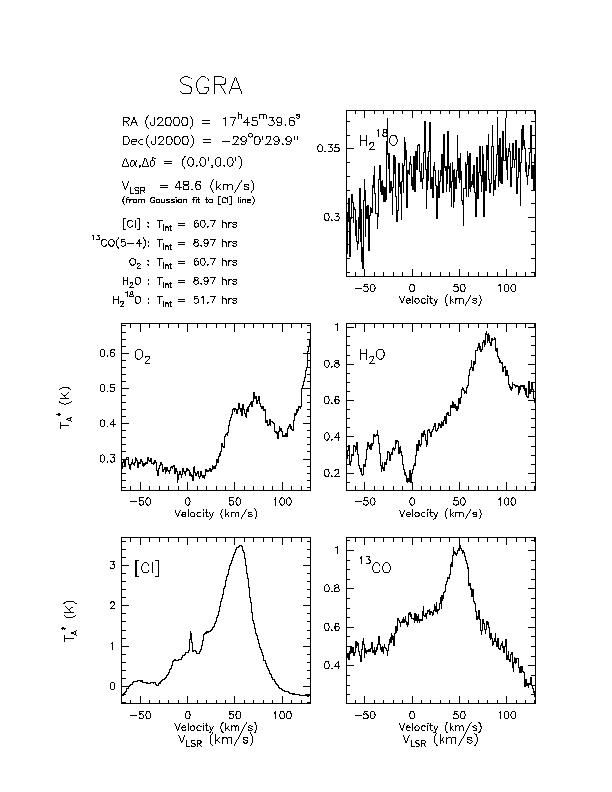
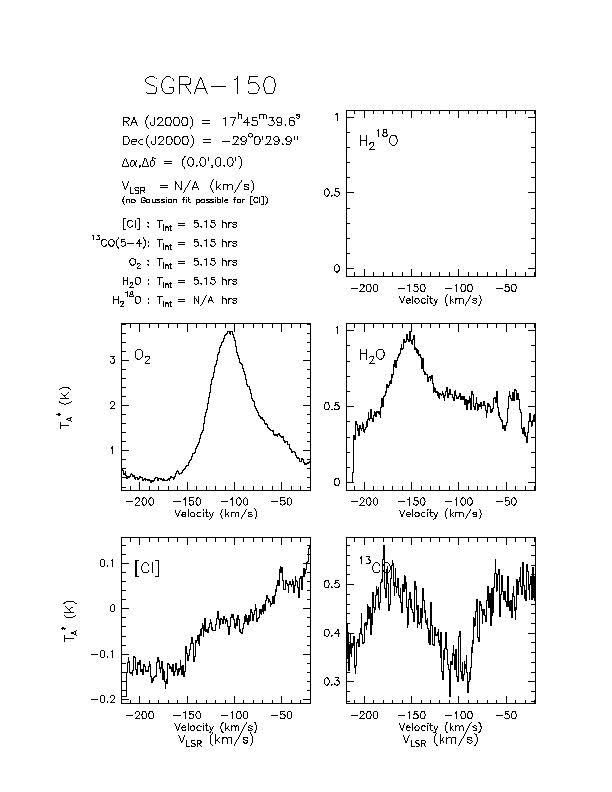
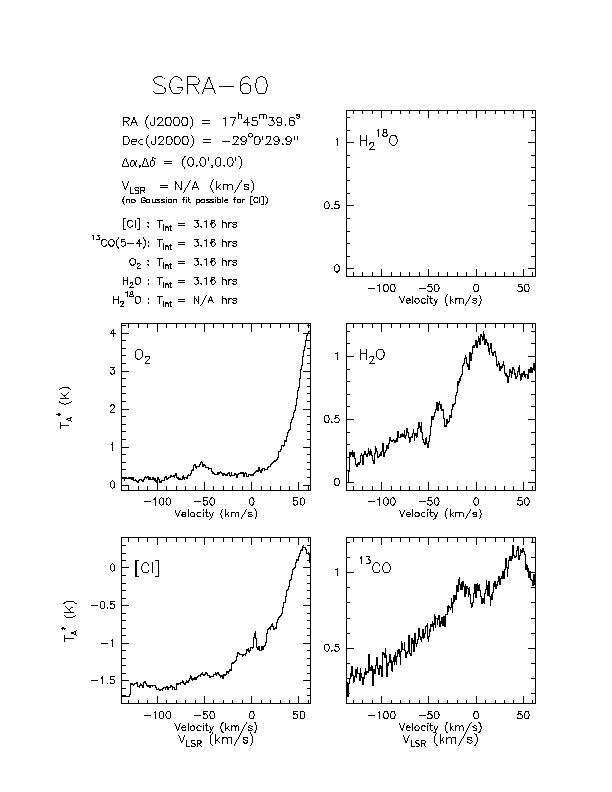
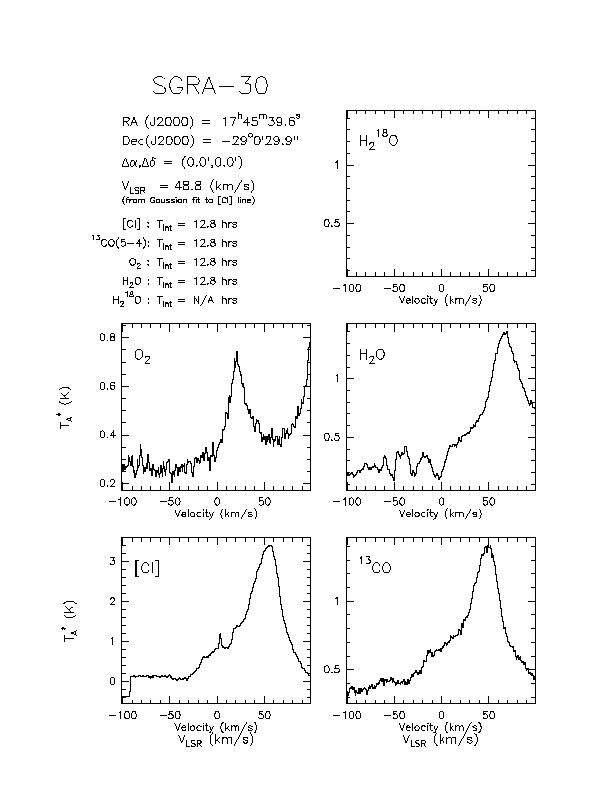
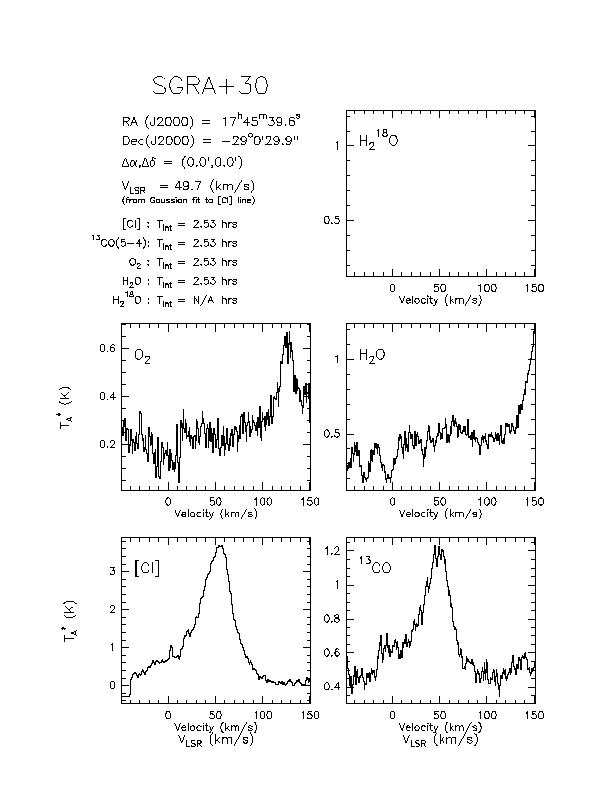
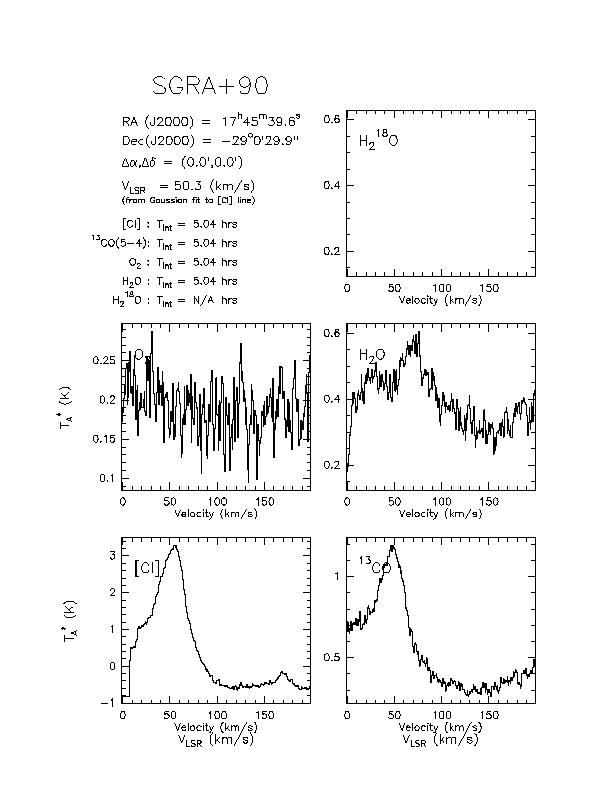
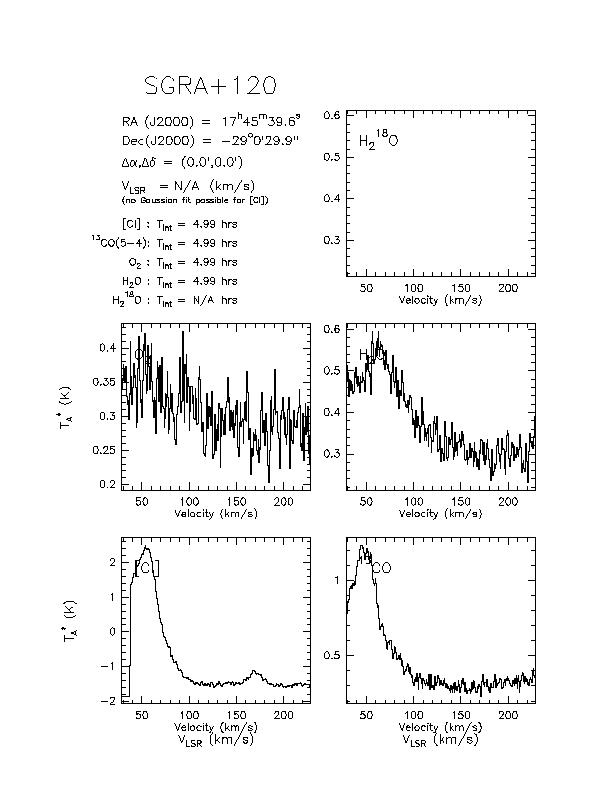
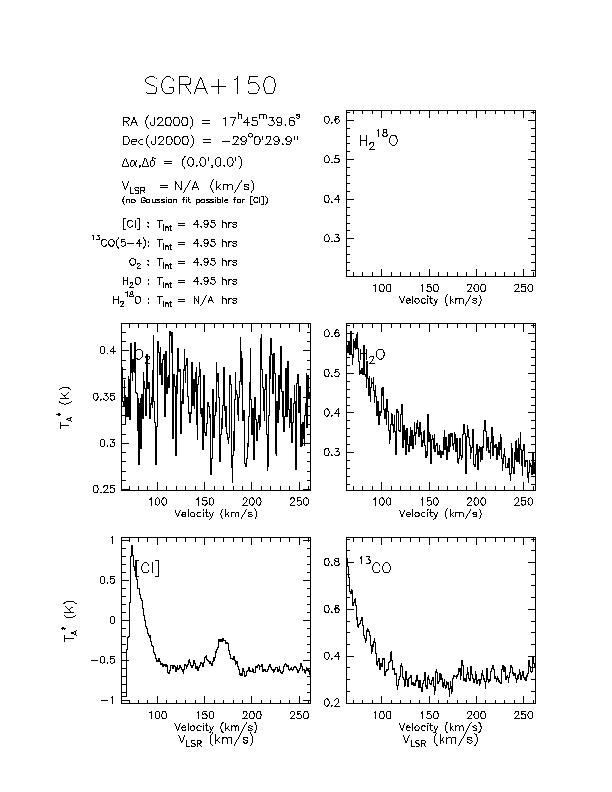
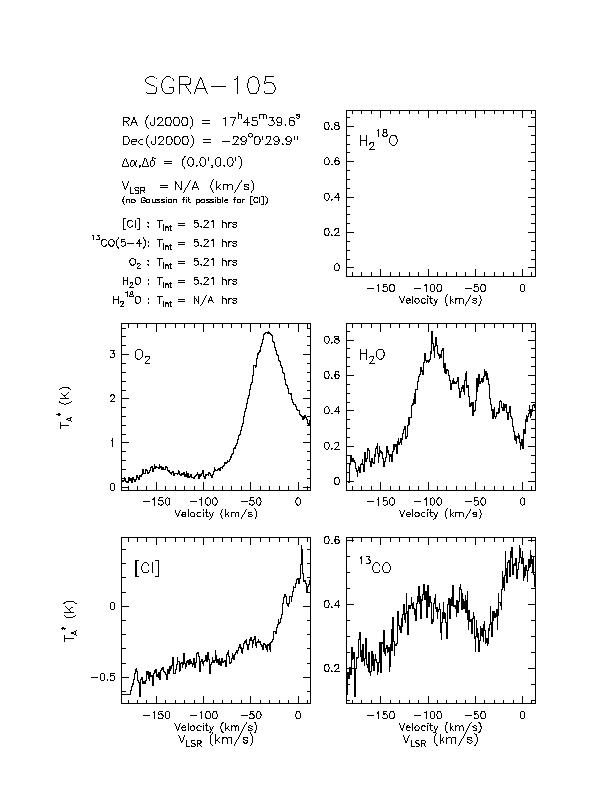
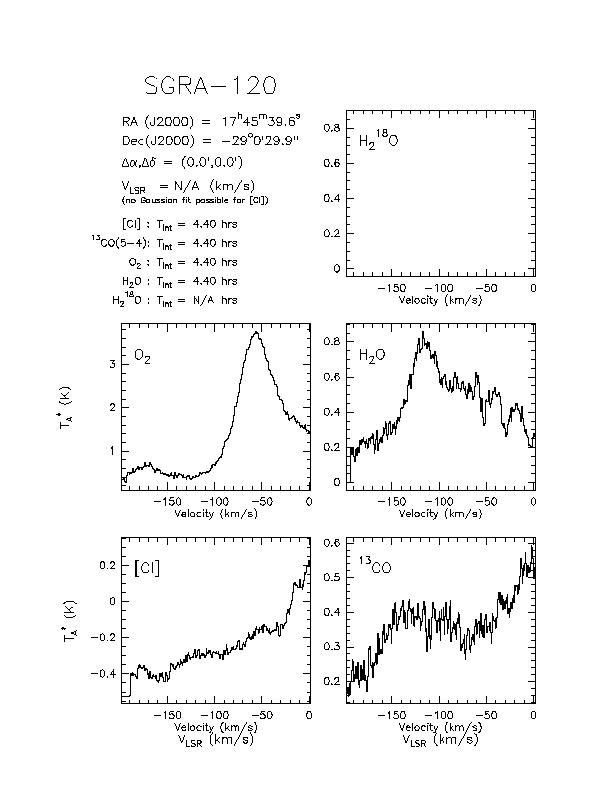
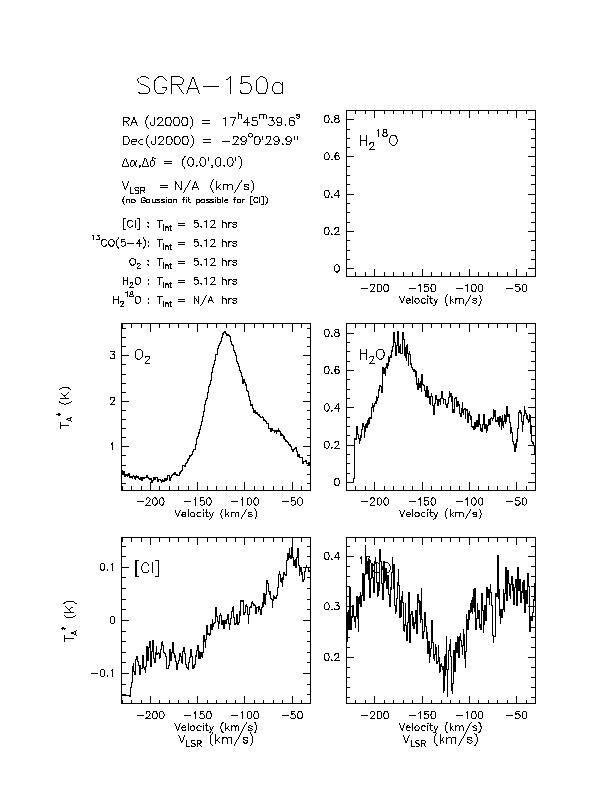
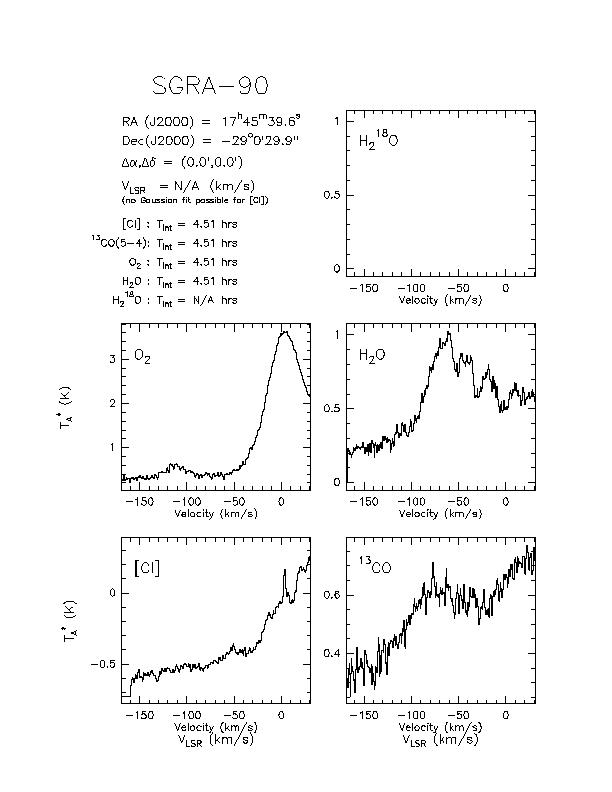
SWAS Spectral Data BrowserPlots of co-added spectra from the five and a half years of the 'SWAS nominal mission can be viewed by clicking on source names in the table below. Plots are available for all observed sources except for solar system objects. For each source, a 5-panel figure shows co-added spectra in the 5 SWAS sidebands containing the H218O, O2, C I, H2O, and 13CO lines. These spectra were produced from data taken at the central position of the source. (Figures are not available for data taken at offset positions.) For sources that were not observed in the sideband containing the H218O line, that panel of the figure is empty. The figures also list source name, source coordinates, source LSR velocity, and on-source integration time for each sideband. If you would prefer interactive browsing we recommend the SWAS Spectrum Server at IRSA. Each SWAS receiver operates as a double sideband system. Receiver 1 is used to observe the 487 GHz O2 line in the lower sideband and the 492 GHz C I line in the upper sideband. Receiver 2 is used to observe the 551 GHz 13CO line in the lower sideband and the 557 GHz H2O line in the upper sideband, or to observe the 548 GHz H218O line in the lower sideband with no line present in the upper sideband. In the conversion to intermediate frequency, opposite sidebands are superimposed in a single intermediate frequency band. As a result, the spectral plots for the O2 sideband often show a strong broad feature offset from the source LSR velocity by roughly 200 km/s. This feature is due to C I emission in the opposite sideband, and it appears broadened because Doppler corrections for spacecraft motion are different for the lower and upper sidebands. Similarly, a feature offset by roughly 100 km/s in the plots for the H2O sideband is due to 13CO emission in the opposite sideband, and for some sources a feature due to H2O emission can be seen in the plot for the 13CO sideband.
|
