

WMAP Google Earth Microwave Sky Images
| |||||||||||||||||||||||||||||||||||||||||
(6420 kB) |
||||
|
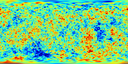
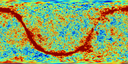
The first image shows the CMB fluctuations from the Five Year WMAP survey. The average brightness corresponds to a temperature of 2.725 Kelvins (degrees above absolute zero; equivalent to -270 C or -455 F). The colors represent temperature variations, as in a weather map: red regions are warmer and blue regions are colder than average by 0.0002 degrees. This map was formed from the five frequency bands shown below in such a way as to suppress the signal from our own Milky Way Galaxy. |
||||
WMAP Five Year Frequency Band Maps (Linear Color Scale) |
||||
 K Band -- 23 GHz 4840 kB |
 Ka Band -- 33 GHz 7365 kB |
 Q Band -- 41 GHz 8212 kB |
 V Band -- 61 GHz 9132 kB |
 W Band -- 94 GHz 9092 kB |
|
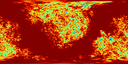
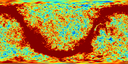
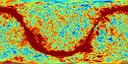
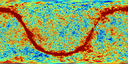
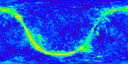
In addition to the CMB, our own Milky Way Galaxy is a source of microwave radiation. Fortunately, the two sources have a different frequency spectrum (or "color"), so they can be separated using multifrequency observations. WMAP uses 5 frequency bands to discern CMB emission from Galactic emission: 23, 33, 41, 61, and 94 GHz. These five images show the microwave brightness measured in each frequency band. The signal is measured in units of Kelvins, and the color scale goes from blue at -0.0002 Kelvins below average (-200 microKelvins) to red at 0.0002 Kelvins above average (+200 microKelvins). The red band running through the center of the image is the emission from our Milky Way, which is much brighter than the CMB signal. By combining these five images in a particular way (as shown in the Internal Linear Combination Map), we can suppress the signal from the Milky Way. |
||||
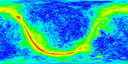
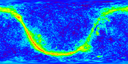
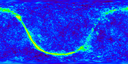
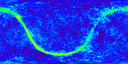
WMAP Five Year Frequency Band Maps (Nonlinear Color Scale) |
||||
 K Band -- 23 GHz 5900 kB |
 Ka Band -- 33 GHz 6956 kB |
 Q Band -- 41 GHz 7412 kB |
 V Band -- 61 GHz 8204 kB |
 W Band -- 94 GHz 8520 kB |
|
These are the same five images as above, except the color scale is distorted to show both the faint variations in the CMB and the much brighter variations in the Milky Way signal. |
||||
Projection Conventions
Google Earth places the observer at the center of a sphere looking out at the sky.
The images projected here are in celestial coordinates (right ascension (RA) and declination (Dec)), with the center representing zero degrees RA and Dec. The entire top of the image corresponds to 90 degrees Dec and the entire bottom corresponds to -90 degrees Dec. This orientation was chosen to allow Google Earth to correctly position star and constellation overlays on top of the image.
Also available:
