

WMAP Google Earth Microwave Sky Images
| ||||||||||||||||||||||||||||||||||||||||||||||||||||||||
(6362 kB) |
||||
|
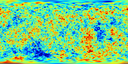
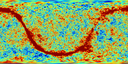
The first image shows the CMB fluctuations from the Seven Year WMAP survey. The average brightness corresponds to a temperature of 2.725 Kelvins (degrees above absolute zero; equivalent to -270 C or -455 F). The colors represent temperature variations, as in a weather map: red regions are warmer and blue regions are colder than average by 0.0002 degrees. This map was formed from the five frequency bands shown below in such a way as to suppress the signal from our own Milky Way Galaxy. |
||||
WMAP Seven Year Frequency Band Maps (Linear Color Scale) |
||||
 K Band -- 23 GHz 4724 kB |
 Ka Band -- 33 GHz 7147 kB |
 Q Band -- 41 GHz 8000 kB |
 V Band -- 61 GHz 8978 kB |
 W Band -- 94 GHz 9080 kB |
|
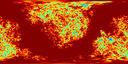
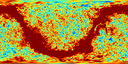
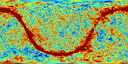
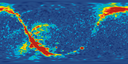
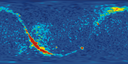
In addition to the CMB, our own Milky Way Galaxy is a source of microwave radiation. Fortunately, the two sources have a different frequency spectrum (or "color"), so they can be separated using multifrequency observations. WMAP uses 5 frequency bands to discern CMB emission from Galactic emission: 23, 33, 41, 61, and 94 GHz. These five images show the microwave brightness measured in each frequency band. The signal is measured in units of Kelvins, and the color scale goes from blue at -0.0002 Kelvins below average (-200 microKelvins) to red at 0.0002 Kelvins above average (+200 microKelvins). The red band running through the center of the image is the emission from our Milky Way, which is much brighter than the CMB signal. By combining these five images in a particular way (as shown in the Internal Linear Combination Map), we can suppress the signal from the Milky Way. |
||||
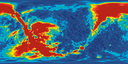
WMAP Seven Year Frequency Band Maps (Nonlinear Color Scale) |
||||
 K Band -- 23 GHz 5698 kB |
 Ka Band -- 33 GHz 6747 kB |
 Q Band -- 41 GHz 7216 kB |
 V Band -- 61 GHz 7983 kB |
 W Band -- 94 GHz 8249 kB |
|
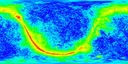
These are the same five images as above, except the color scale is distorted to show both the faint variations in the CMB and the much brighter variations in the Milky Way signal. |
||||
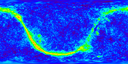
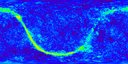
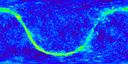
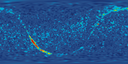
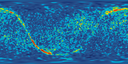
WMAP Seven Year Polarization Maps by Frequency Band |
||||
 K Band -- 23 GHz 5067 kB |
 Ka Band -- 33 GHz 5161 kB |
 Q Band -- 41 GHz 4565 kB |
 V Band -- 61 GHz 4675 kB |
 W Band -- 94 GHz 6272 kB |
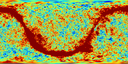
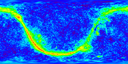
In addition to measuring brightness variations, the WMAP mission is also capable of measuring a more specialized property of the microwaves called polarization. CMB polarization can provide information about when the first stars turned on and whether there were gravity waves in the very early universe. These images show the polarized portion of the microwave signal at two of the five frequency bands: 23 and 33 GHz. The color represents the strength of the polarization: blue is no polarization while red is relatively strong; the color scale ranges between 0 to 50 μK for K band and between 0 to 35 μK for the other bands. The signal seen in the polarization maps arises almost entirely from our own Milky Way Galaxy. Specifically it is mostly due to "synchrotron radiation" that is produced by high energy electrons spiraling around magnetic field lines in our Galaxy. As with the brightness variations, the polarized signal can be largely suppressed by combining multifrequency data. Once this is done, the CMB polarization left behind tells us that the first stars in the universe first formed when the universe was about 400 million years old. As of yet, the polarization provides no evidence for gravity waves in the early universe. |
||||
Projection Conventions
Google Earth places the observer at the center of a sphere looking out at the sky.
The images projected here are in celestial coordinates (right ascension (RA) and declination (Dec)), with the center representing zero degrees RA and Dec. The entire top of the image corresponds to 90 degrees Dec and the entire bottom corresponds to -90 degrees Dec. This orientation was chosen to allow Google Earth to correctly position star and constellation overlays on top of the image.
Also available:
