
Example Survey Footprint Graphics

This page gives several examples of survey footprints available in the library. All footprint data are provided for survey planning and visualization purposes only.
CMB Intensity
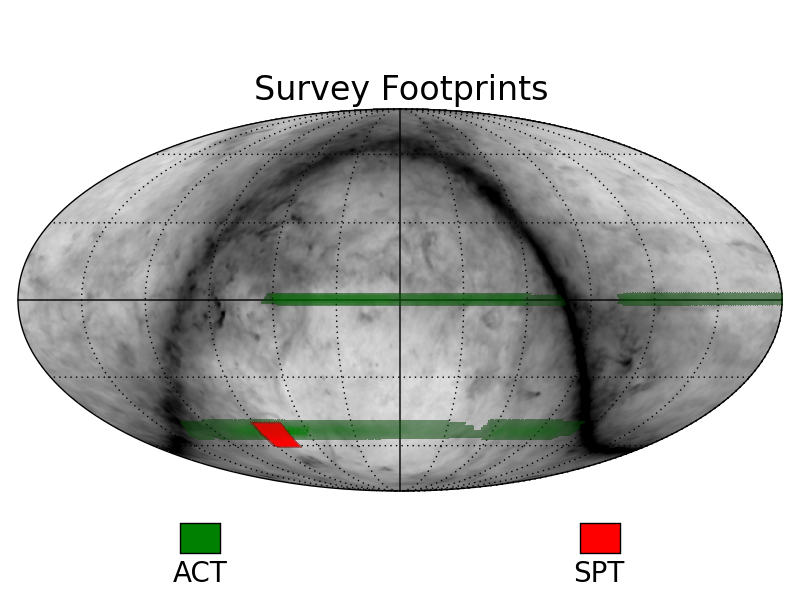
The first example shows the footprints of ACT and SPT through the data that has been released on LAMBDA. The ACT data comes from the weights released for the 2008-2010 seasons at 148 GHz and 218 GHz. The SPT data are pixel weight functions for data from the ra5h30dec-55 field in the 2008 data. These represent map data that are available through LAMBDA and are a fraction of the total temperature data of the respective experiments. The background is the dust intensity from Planck.

CMB Polarization
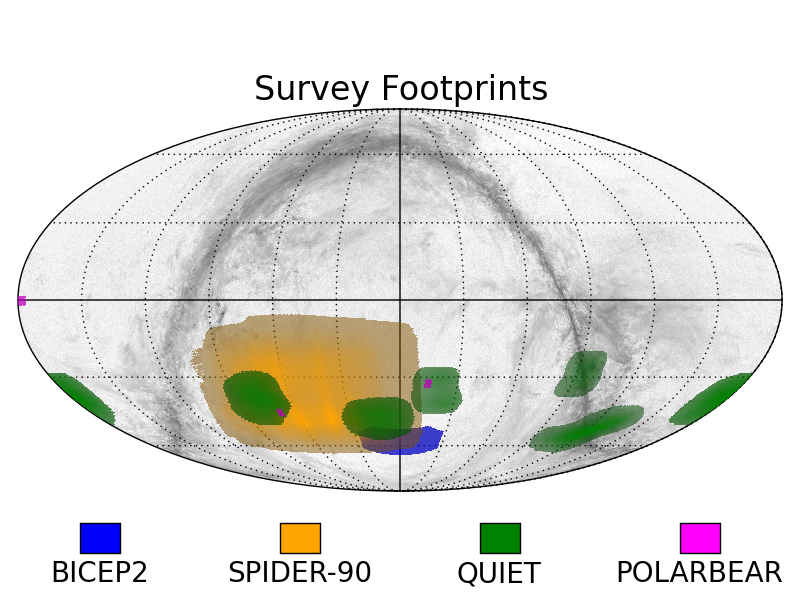
The second example shows several footprints of CMB polarization experiments. Results from BICEP2, SPIDER, QUIET, and POLARBEAR are shown. The footprints for BICEP2, QUIET, and POLARBEAR are generated based on values in the literature. The SPIDER hitmap is a preliminary hitmap for the SPIDER experiment (and point that has a non-zero number of hits). The background is the polarized dust intensity from Planck.

Large Scale Structure
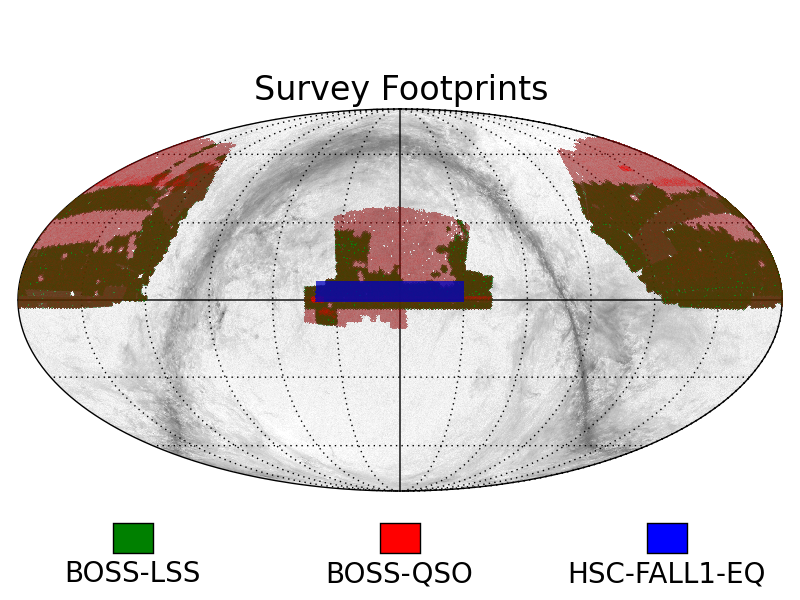
The last example contains the footprints of several LSS surveys: BOSS-LSS, BOSS-QSO, and HSC. The two BOSS footprints are the result of a binning of the released catalogs. The Subaru Hyper Suprime-Cam survey plots are taken from a released paper. The background is the same as the CMB polarization


