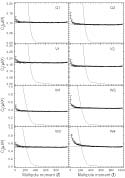
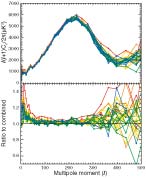
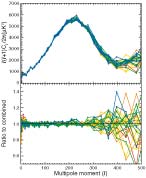
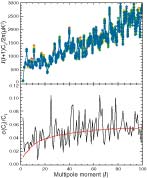
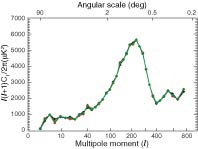
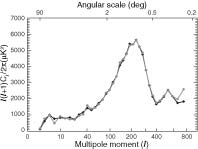
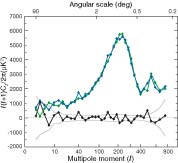
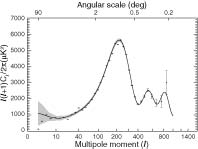
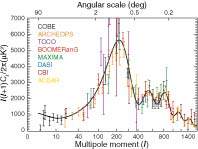
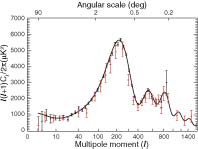
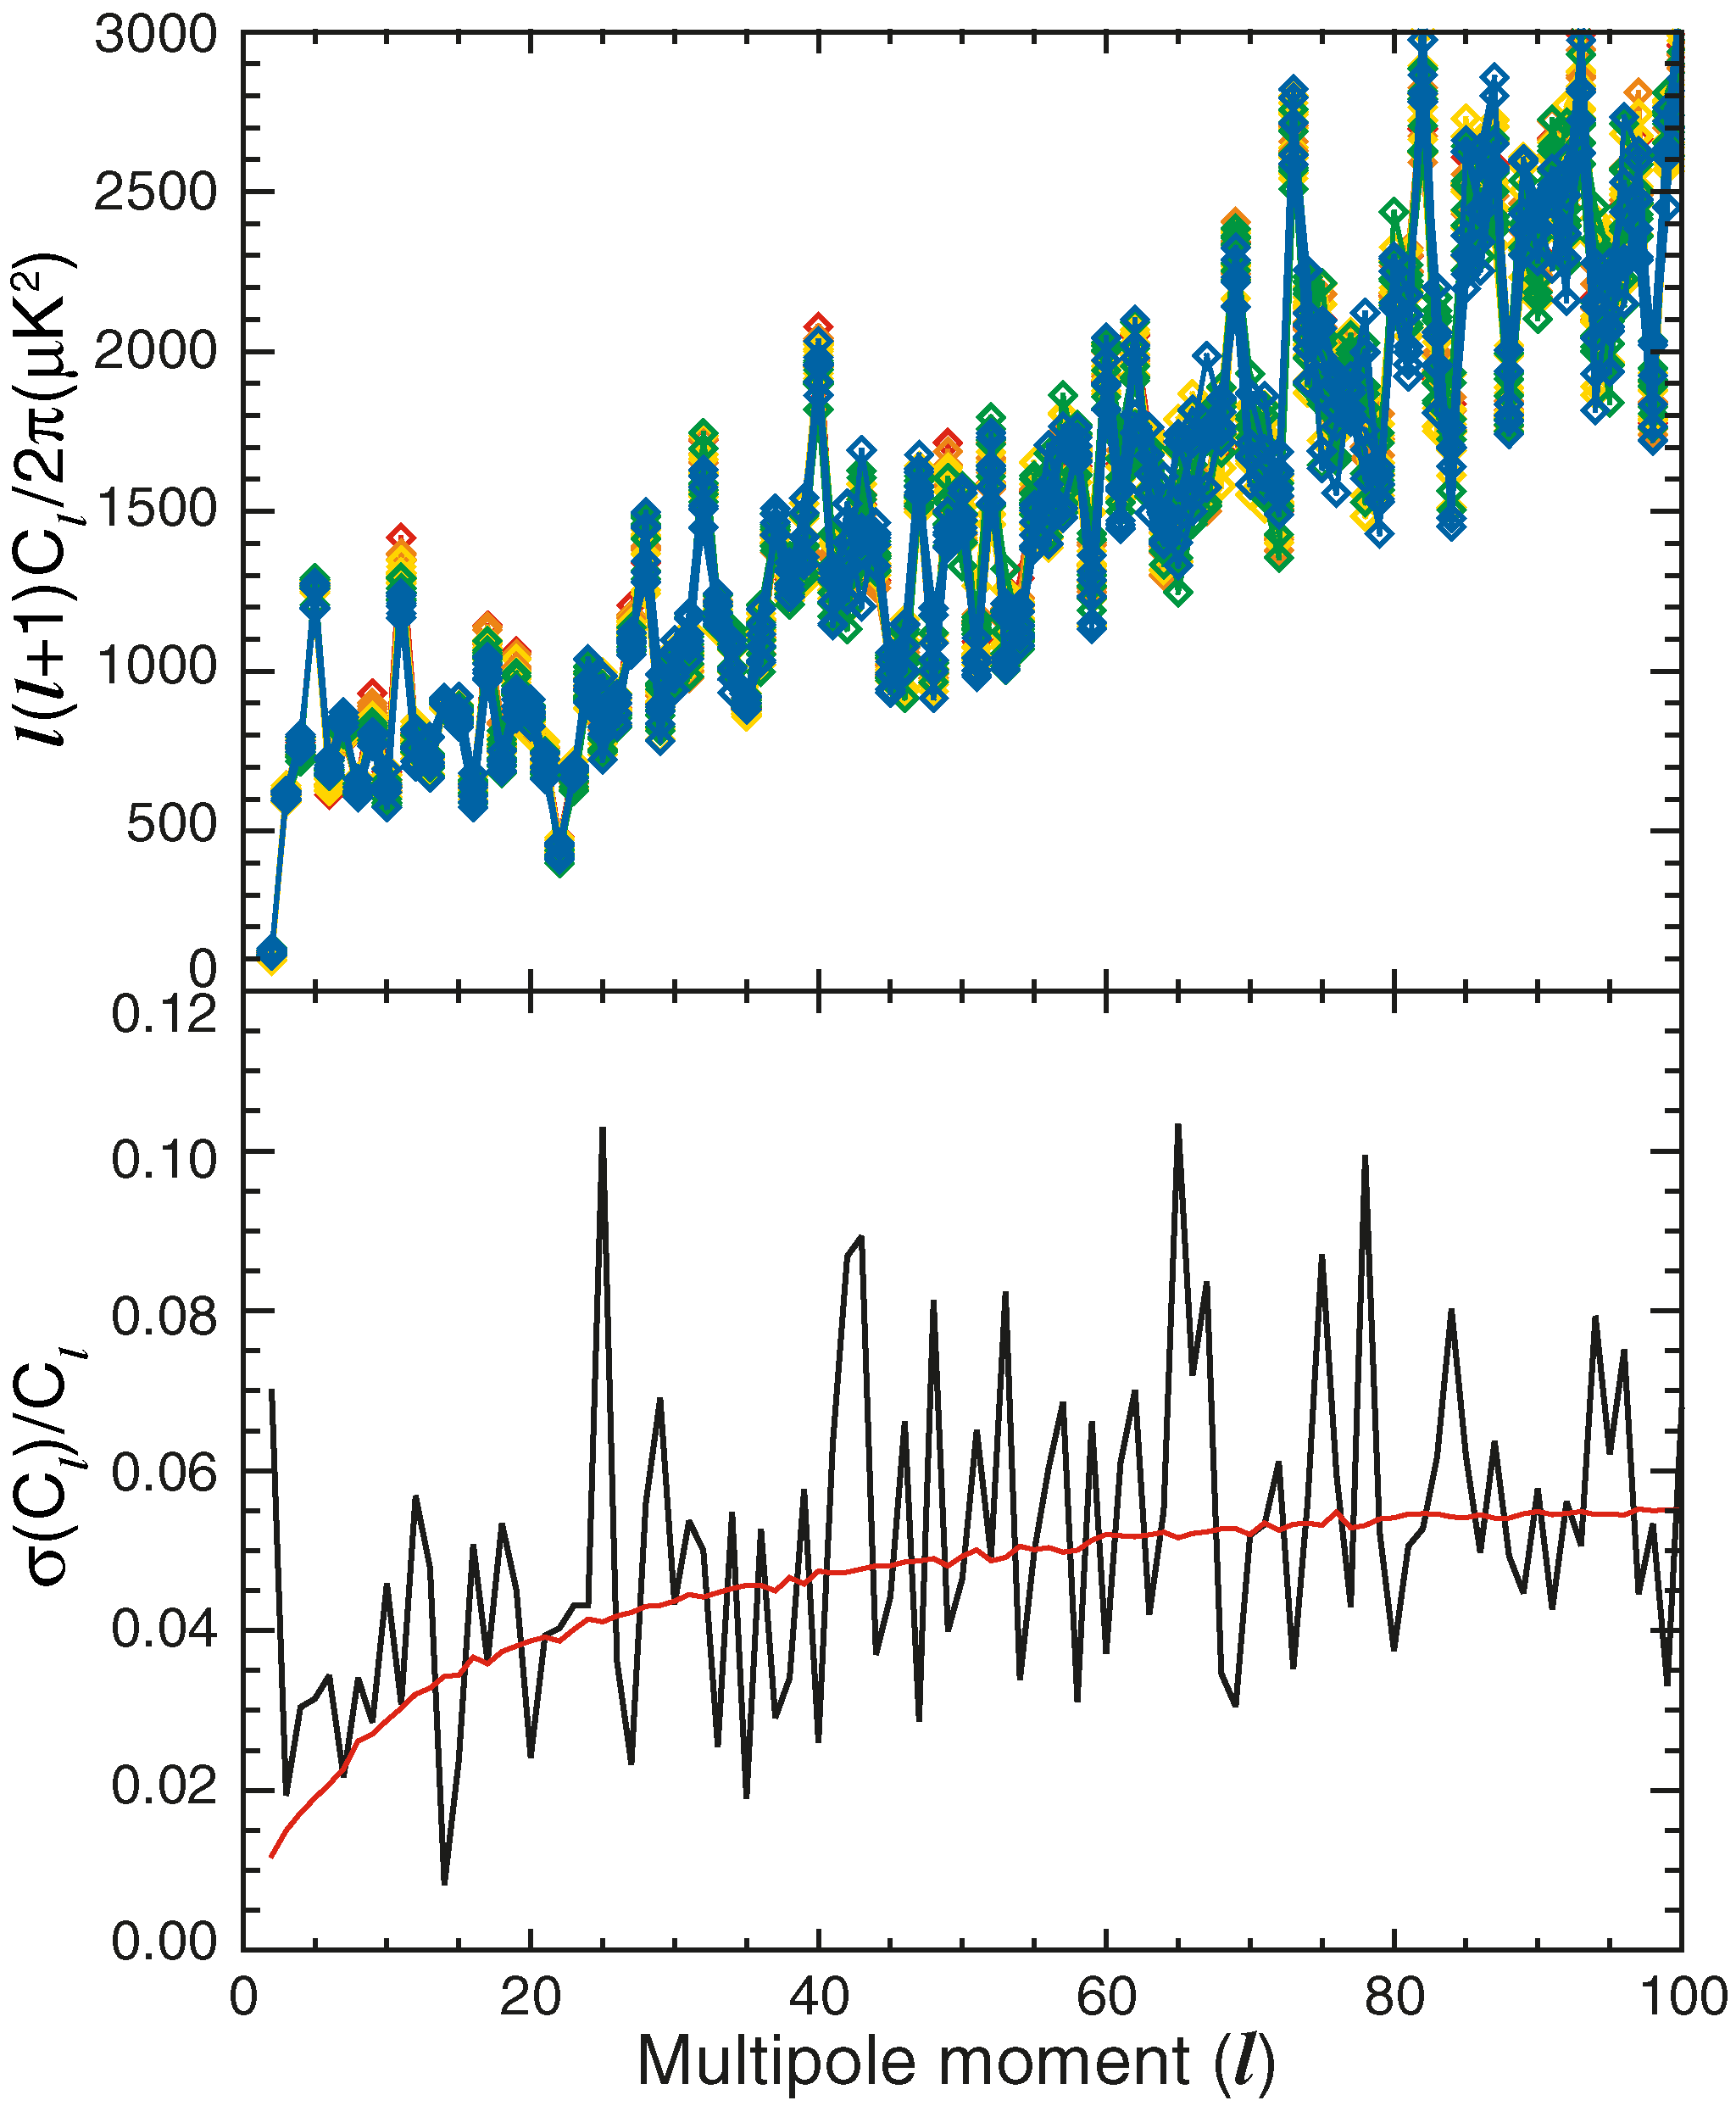
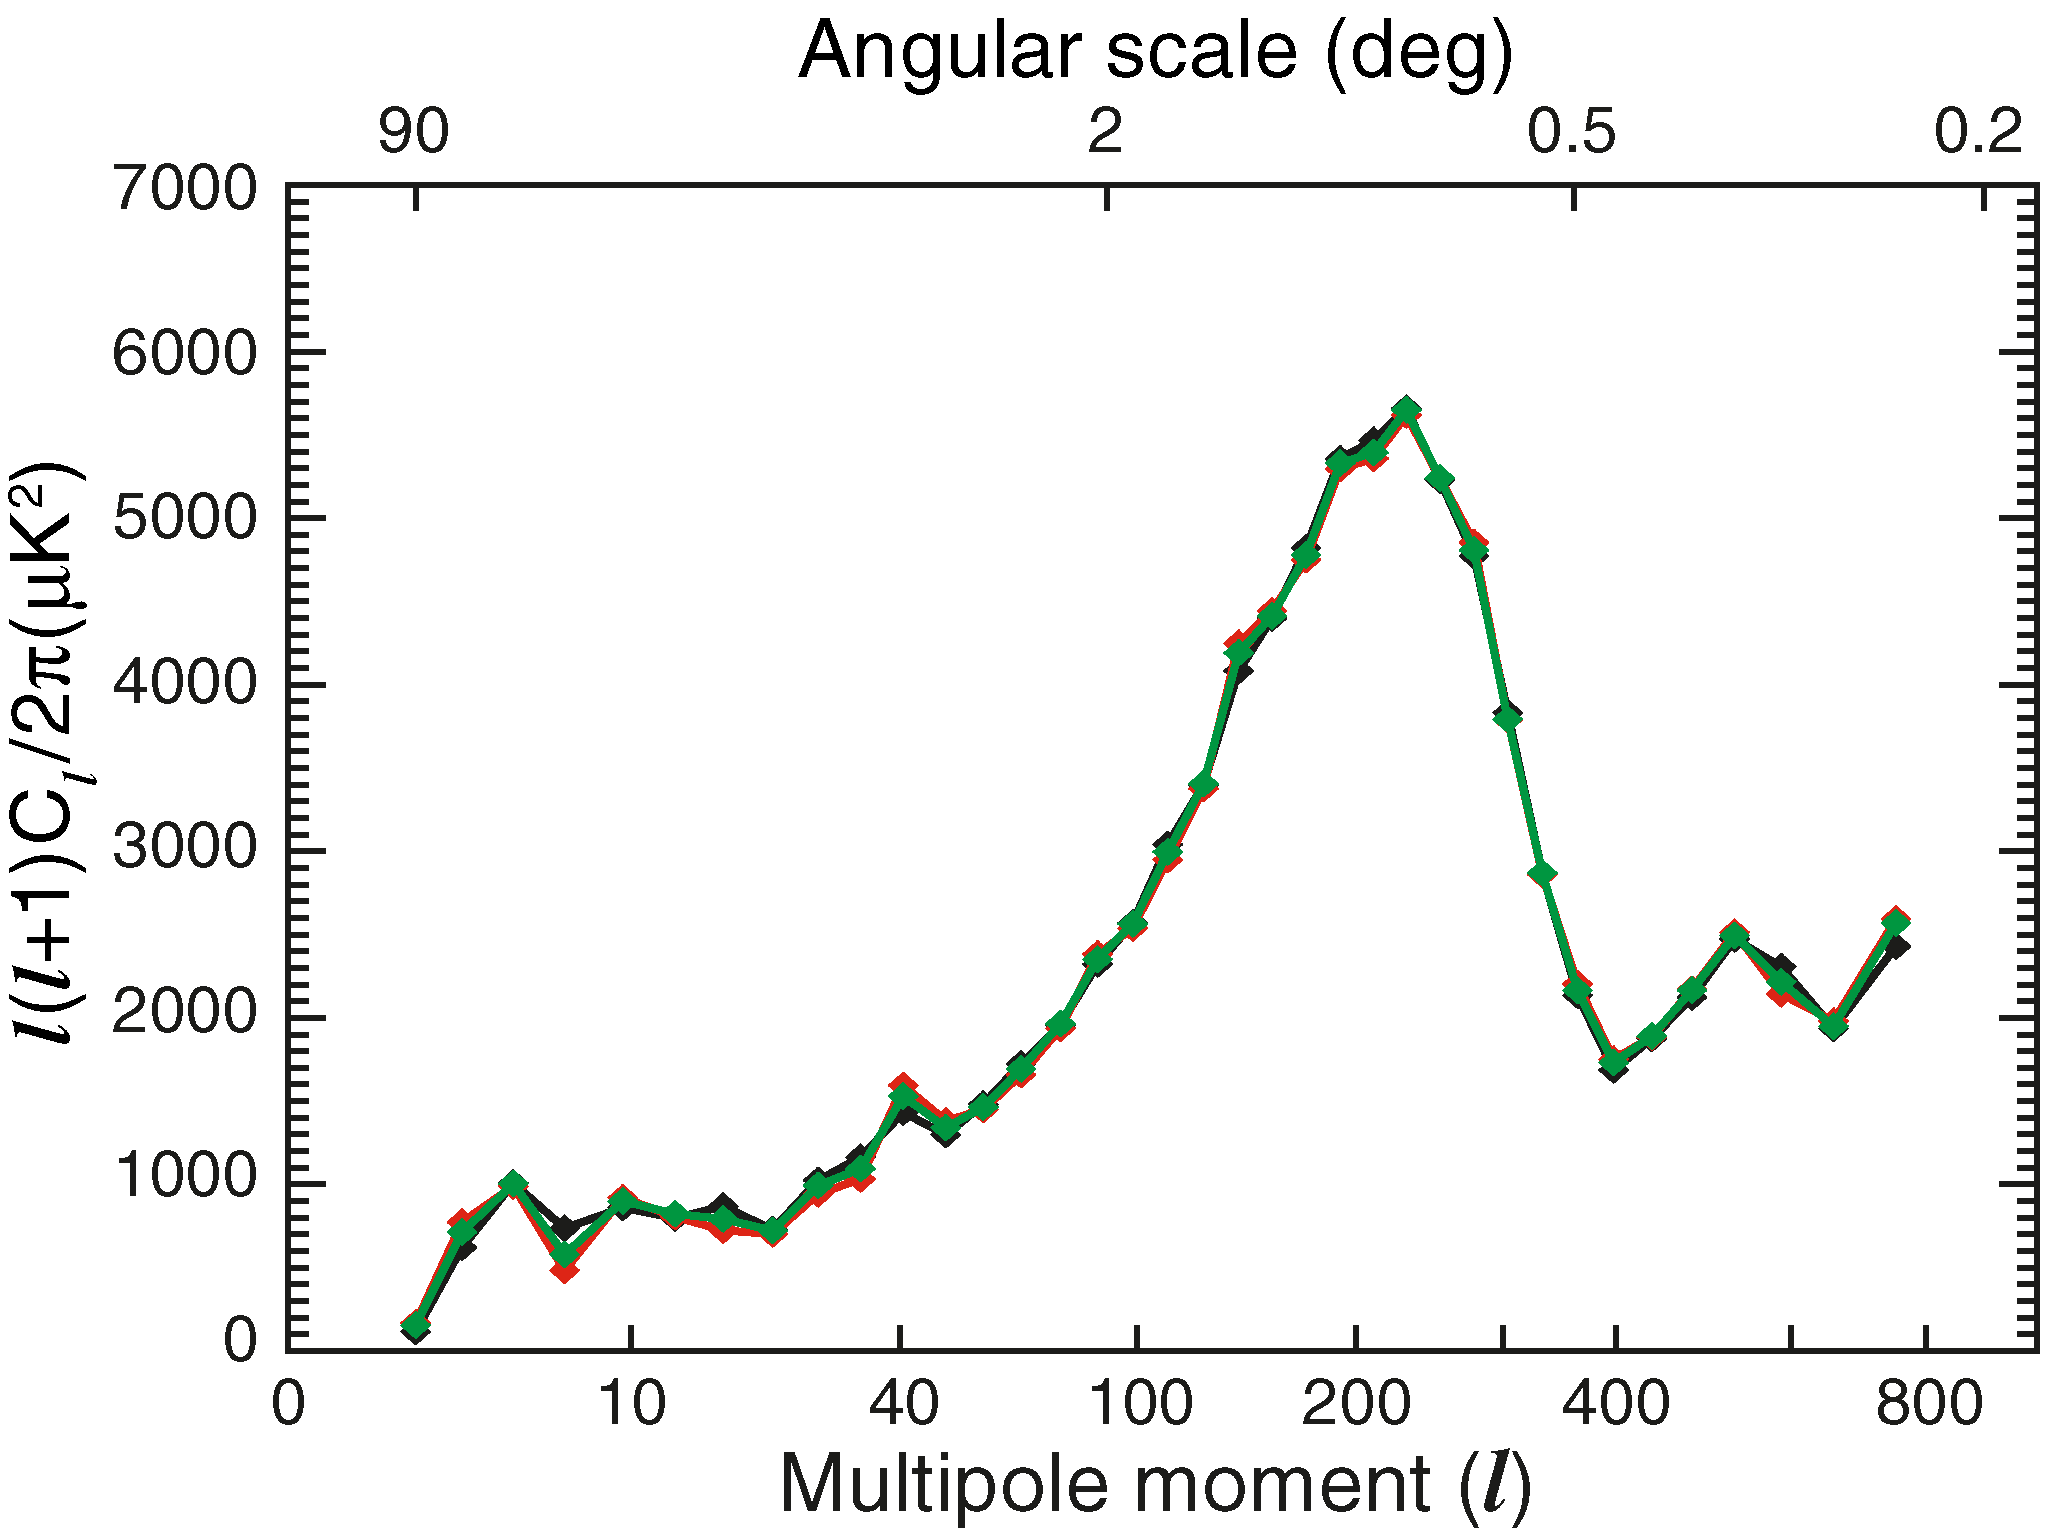
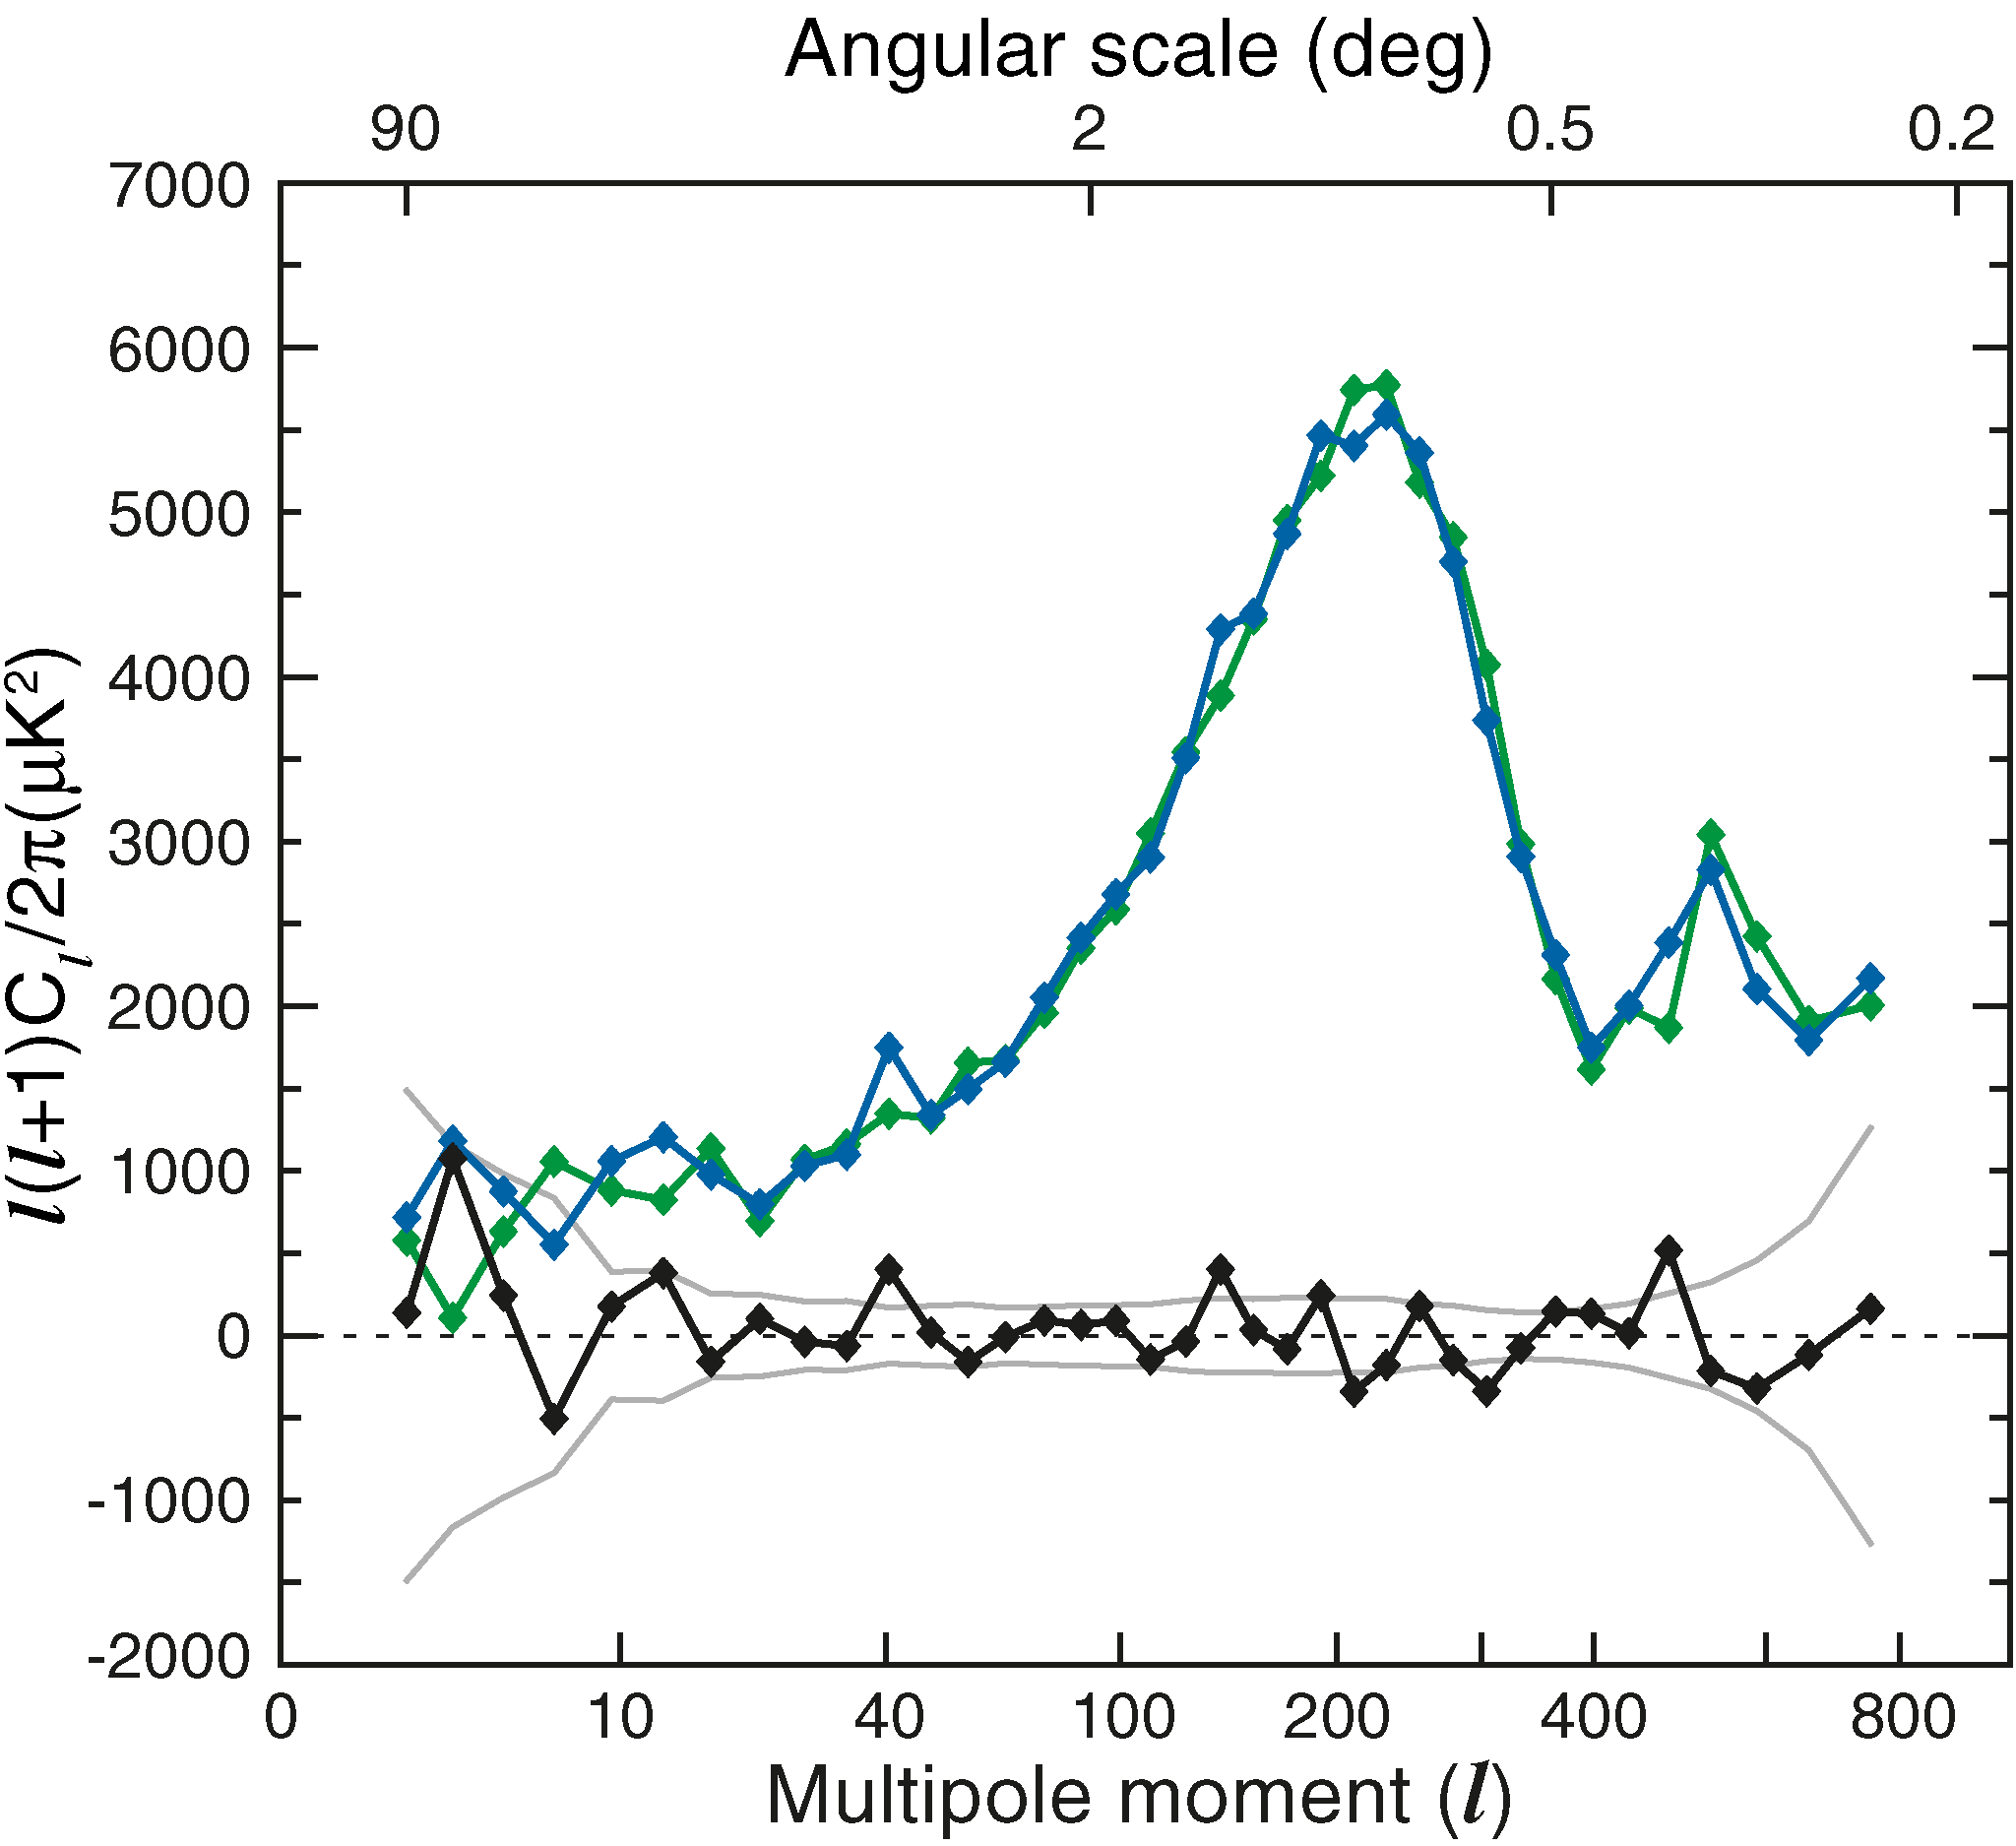
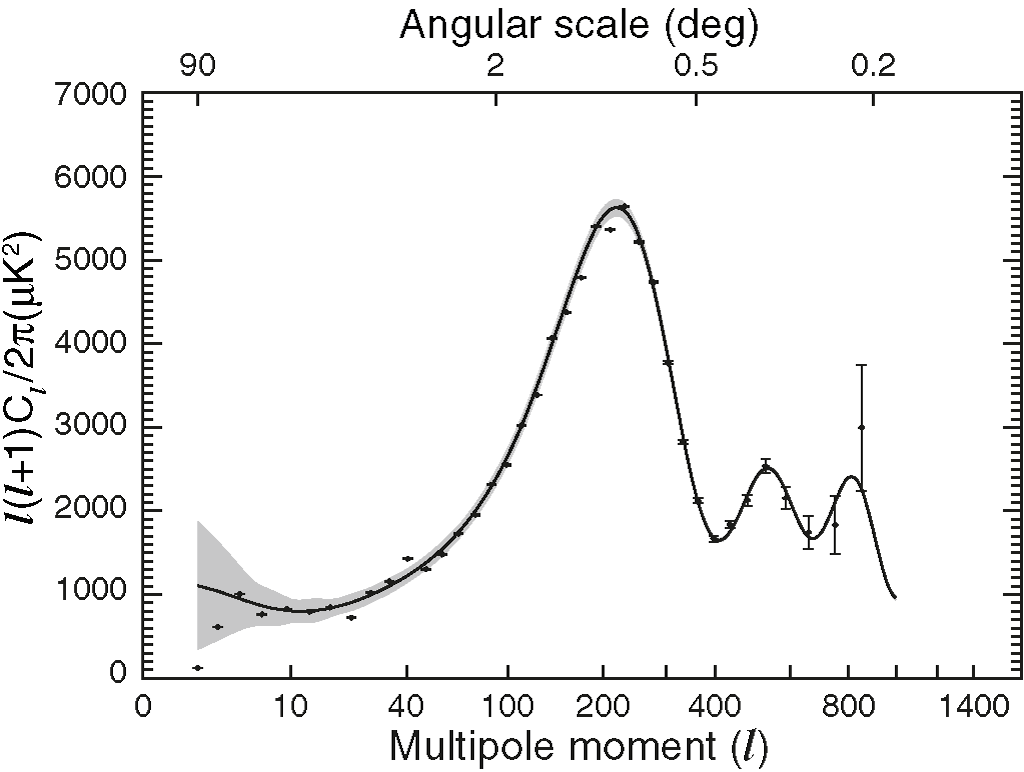
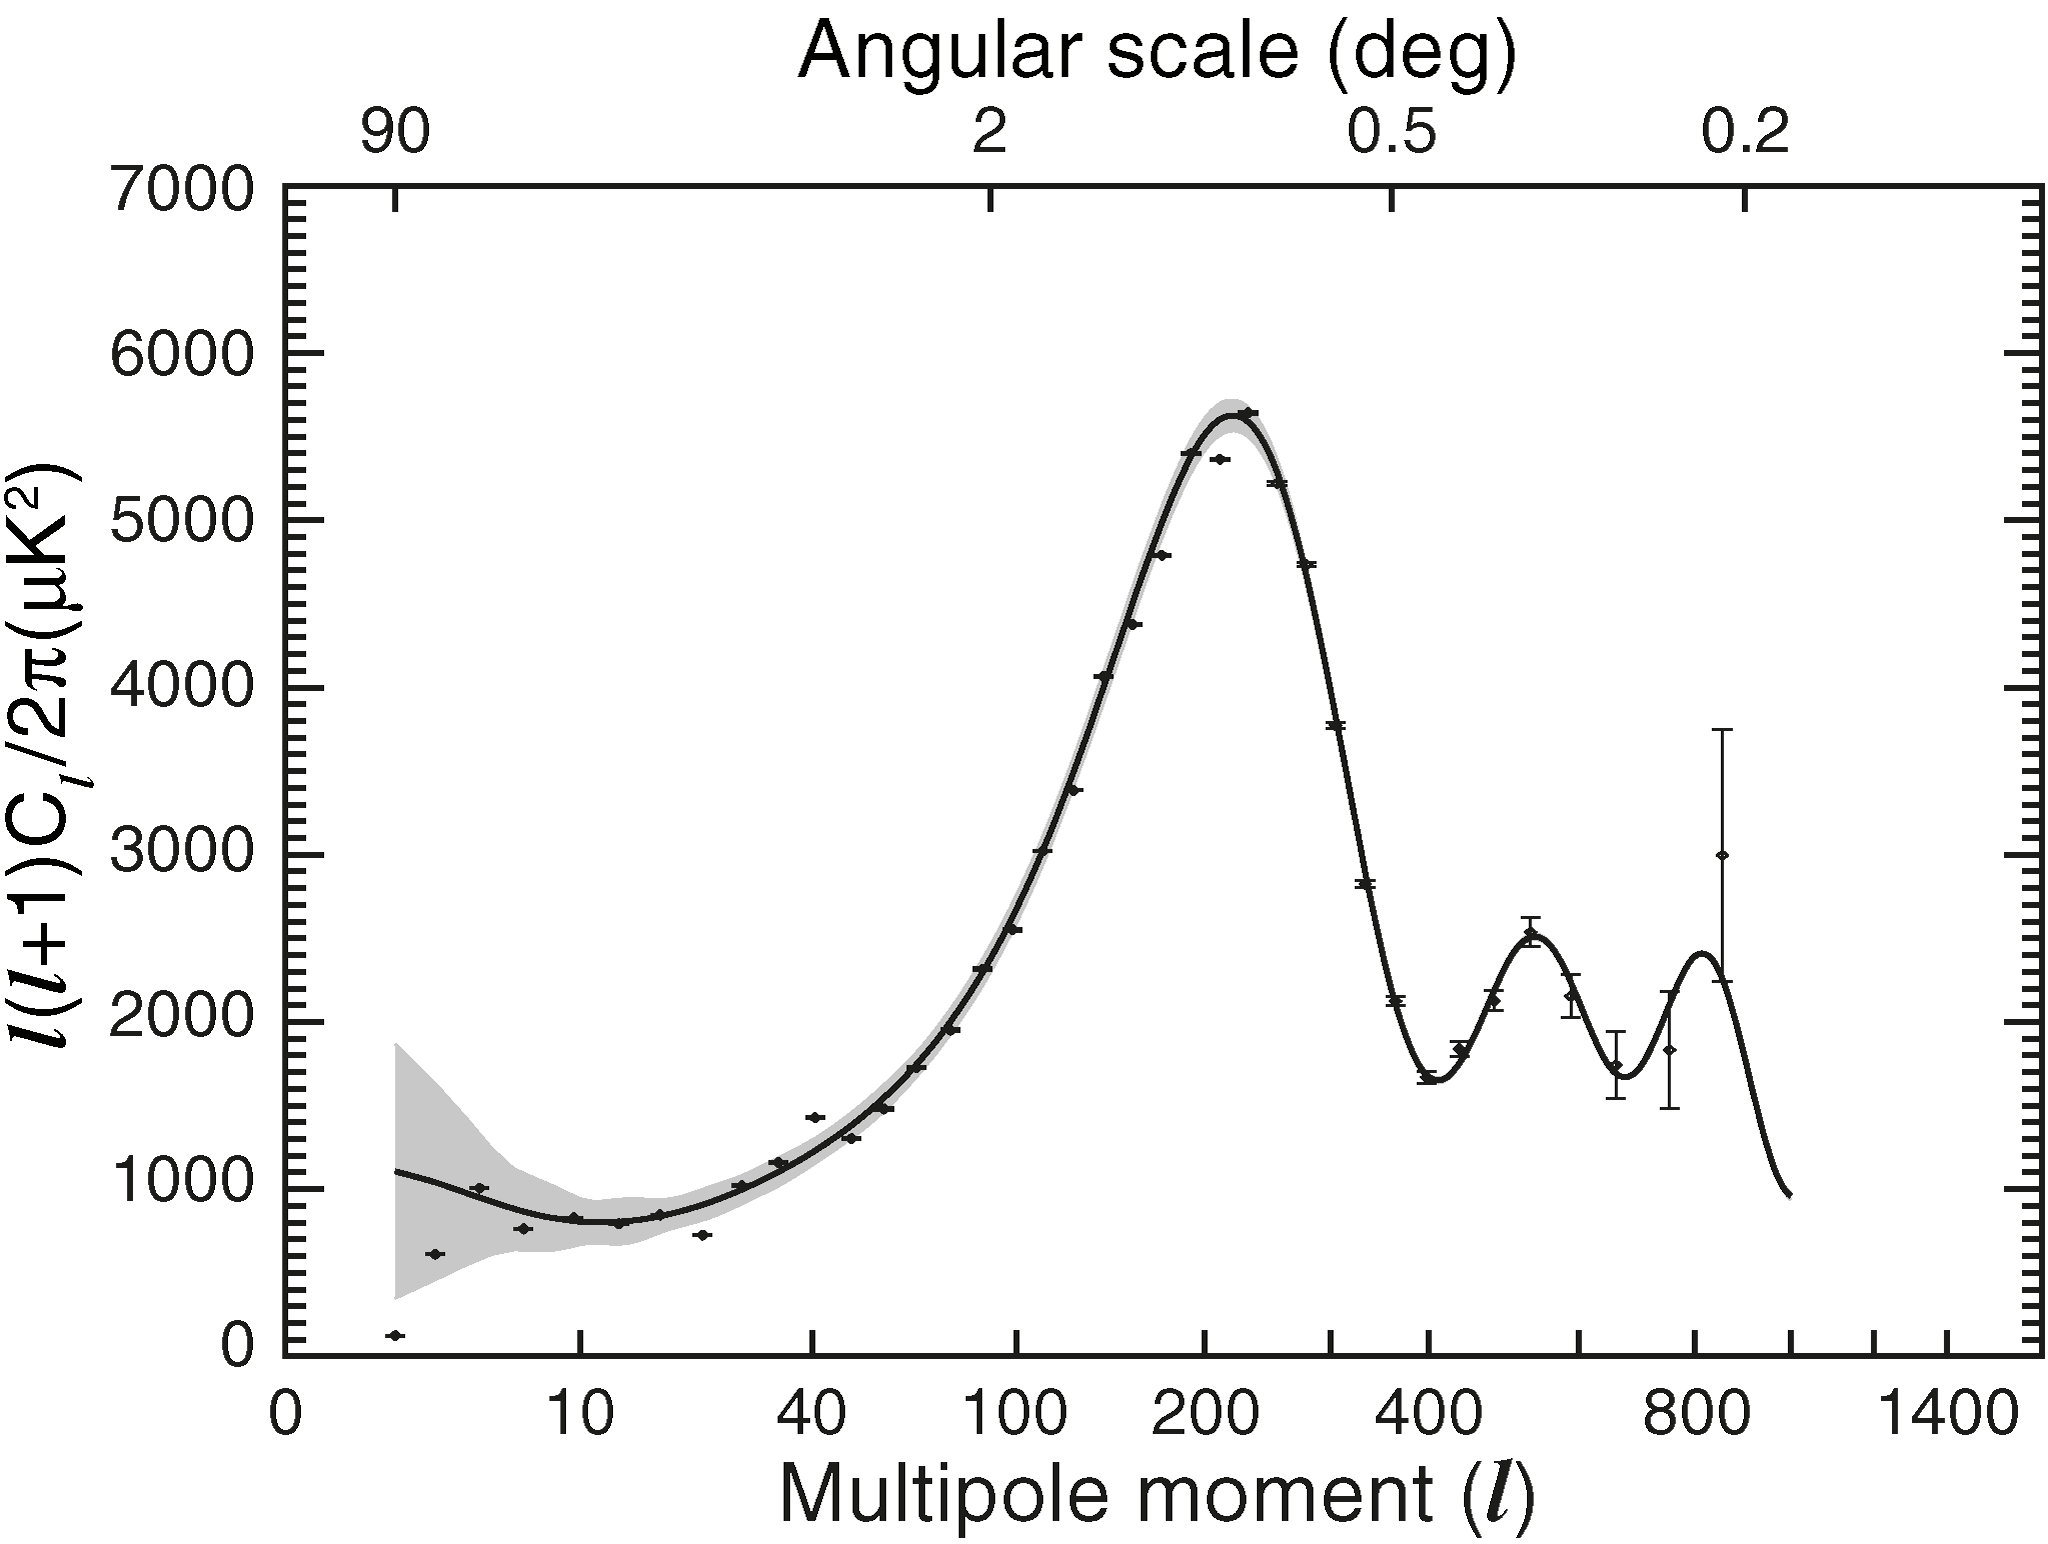
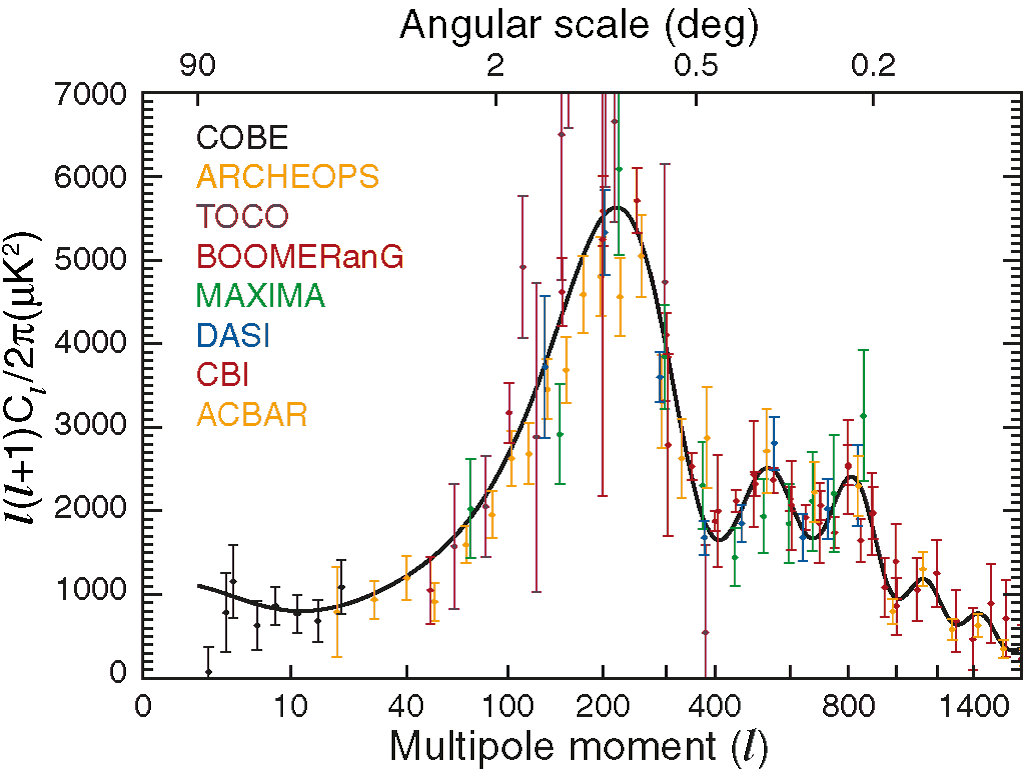
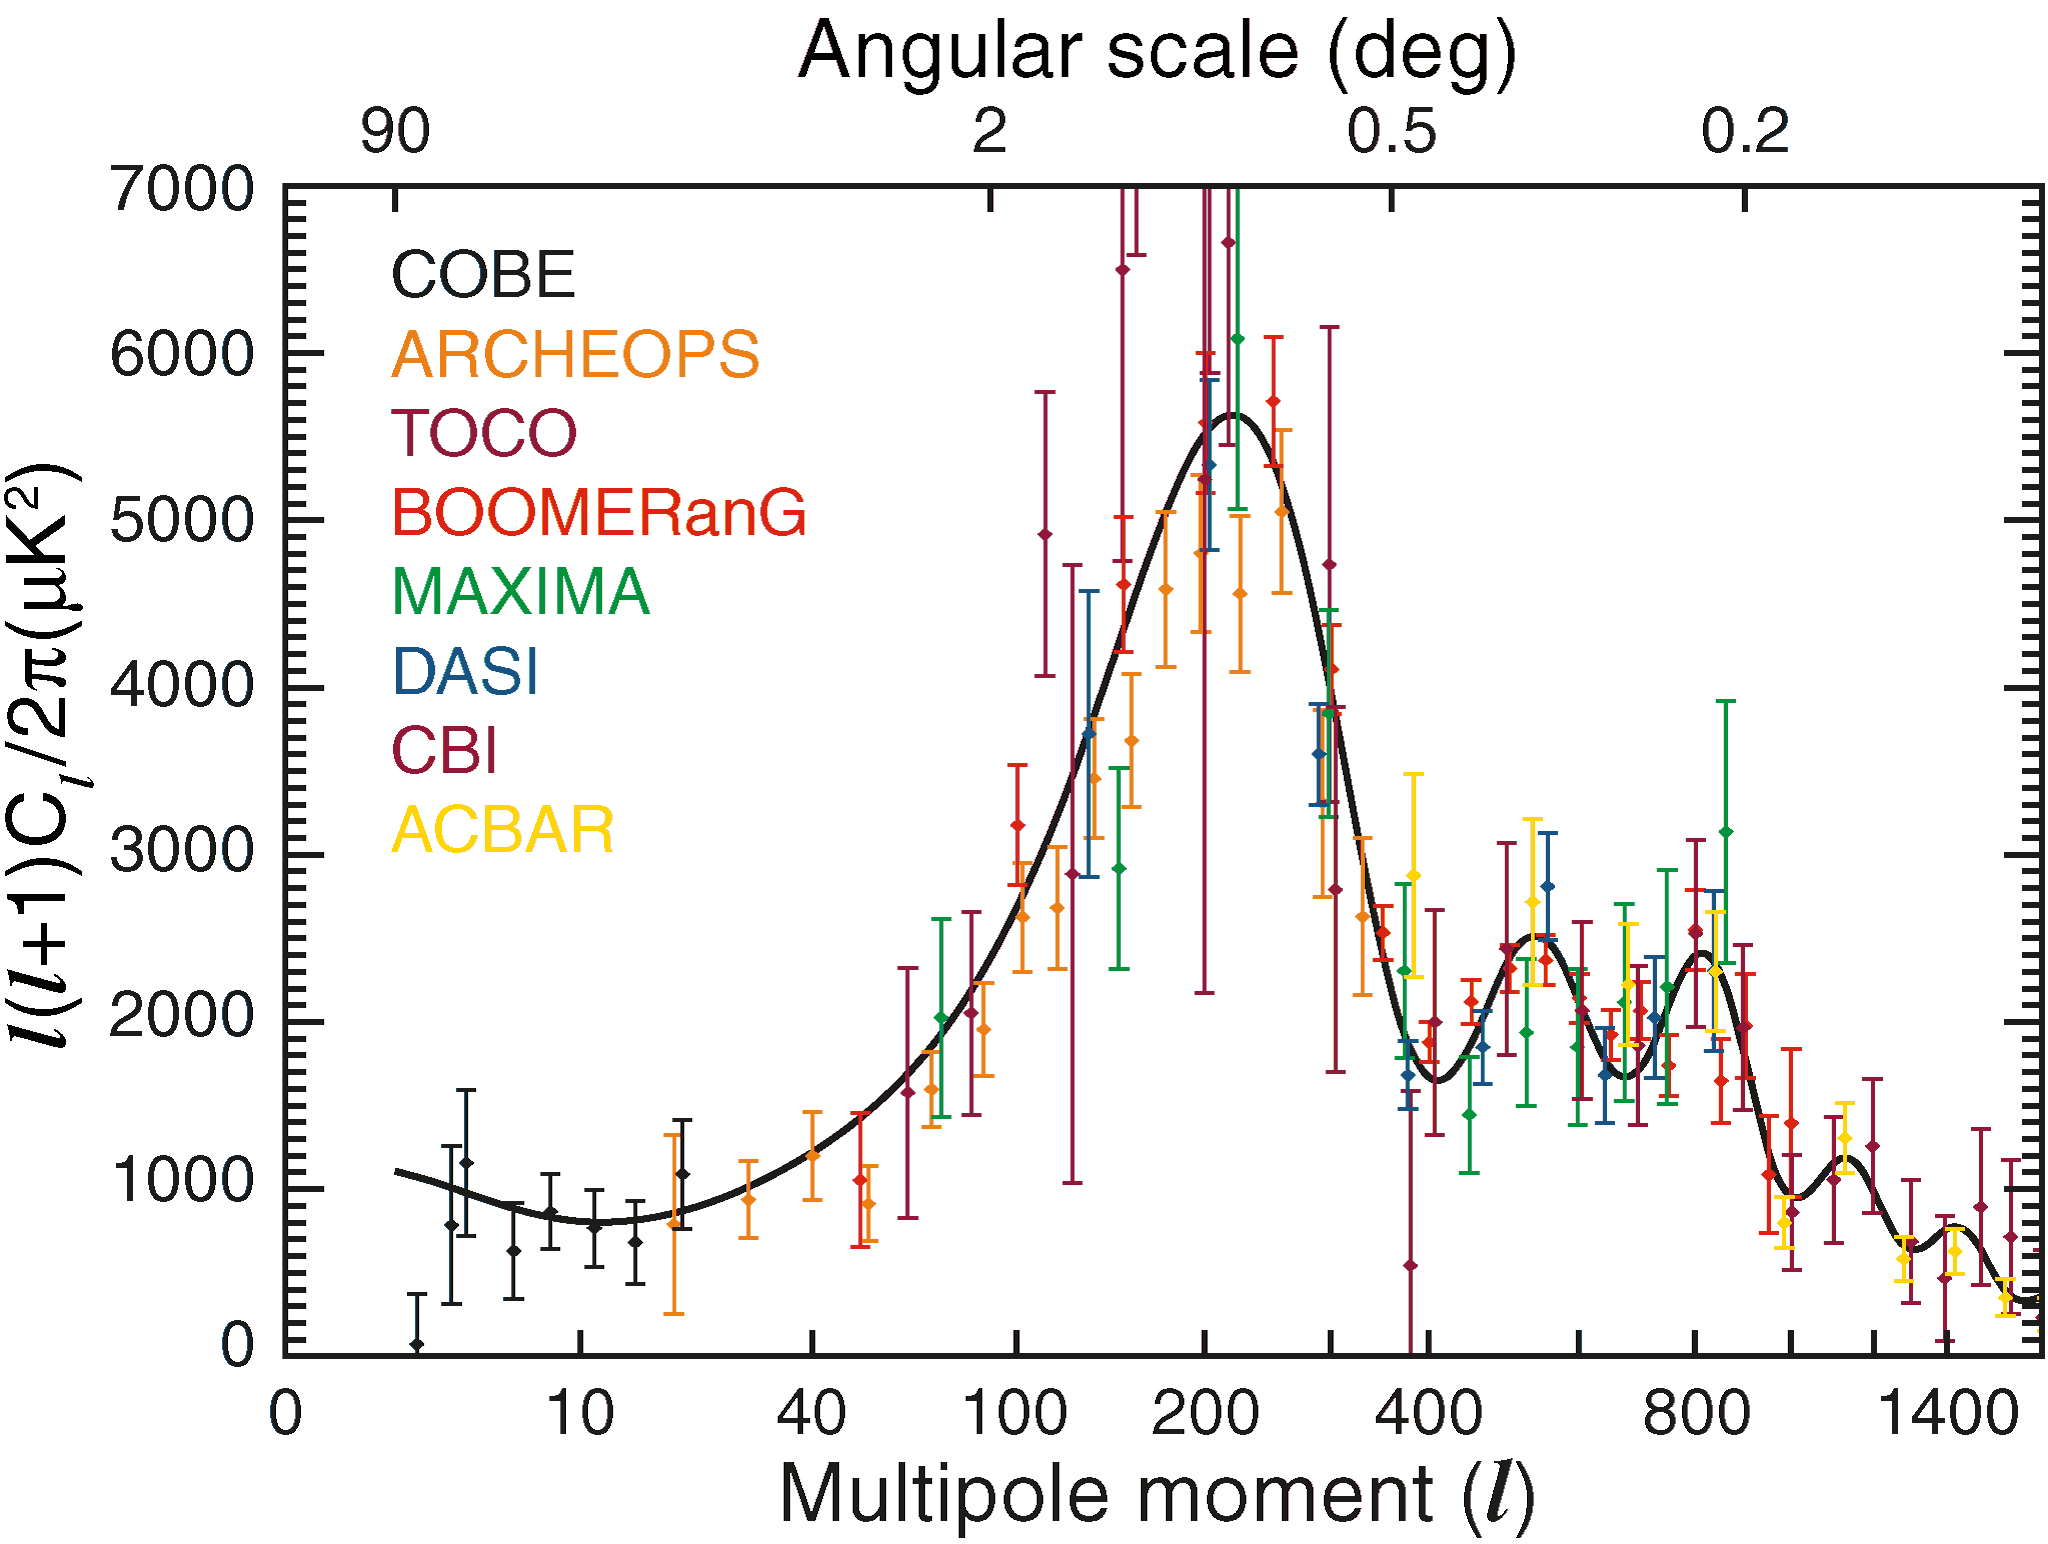
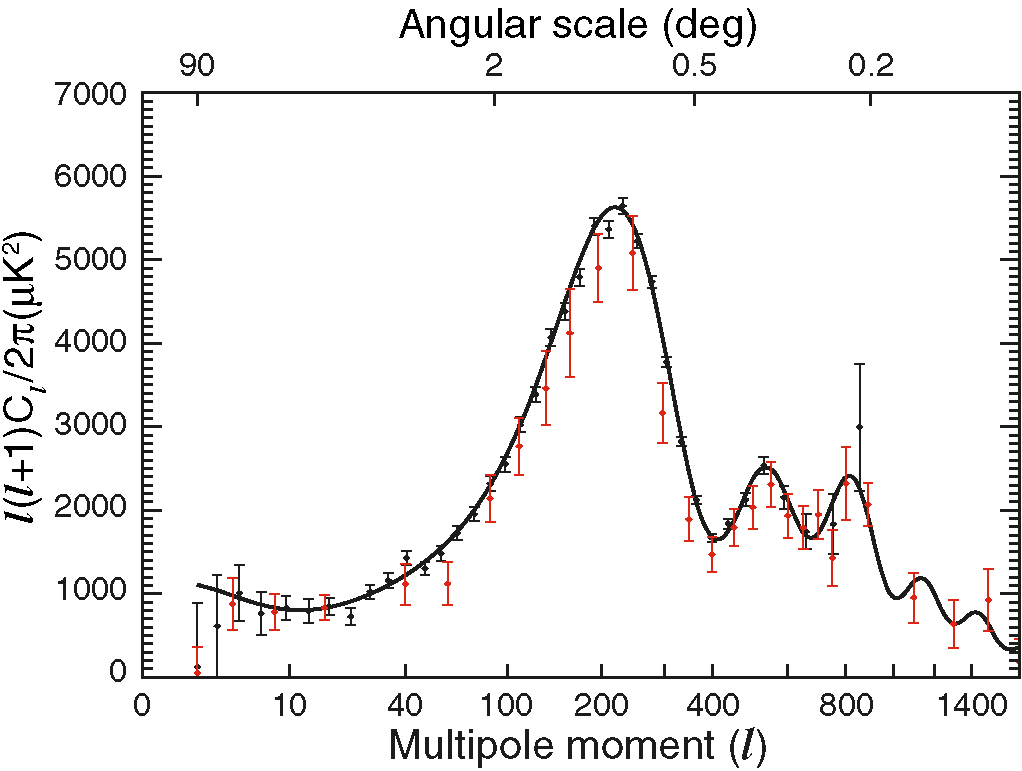
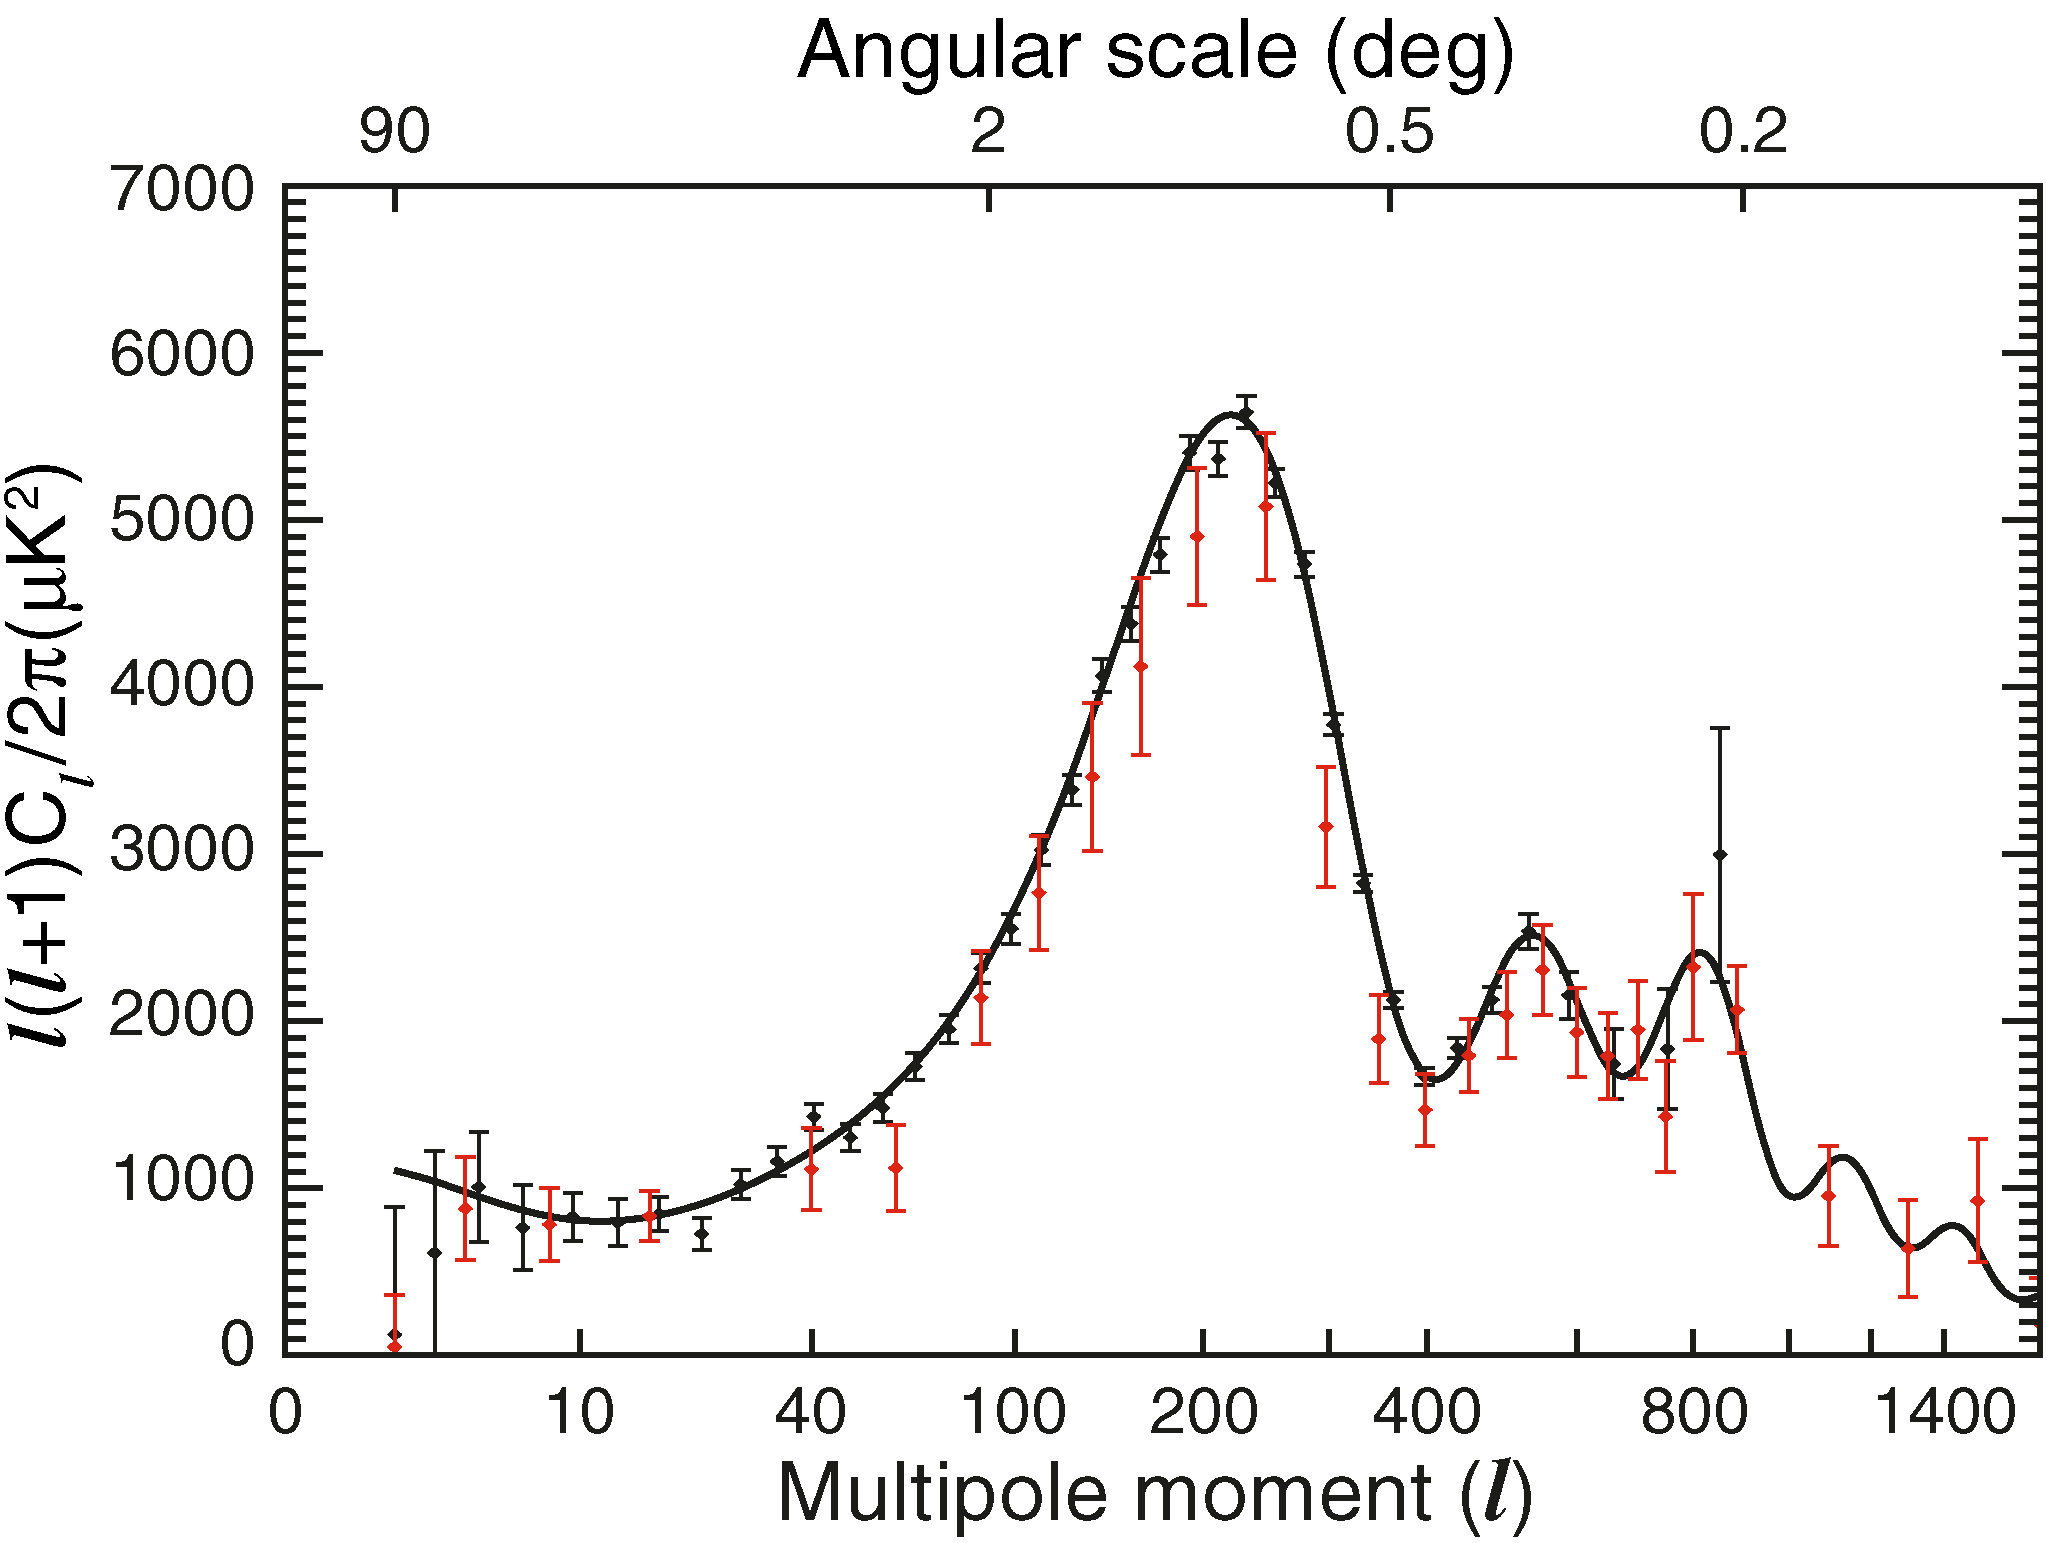
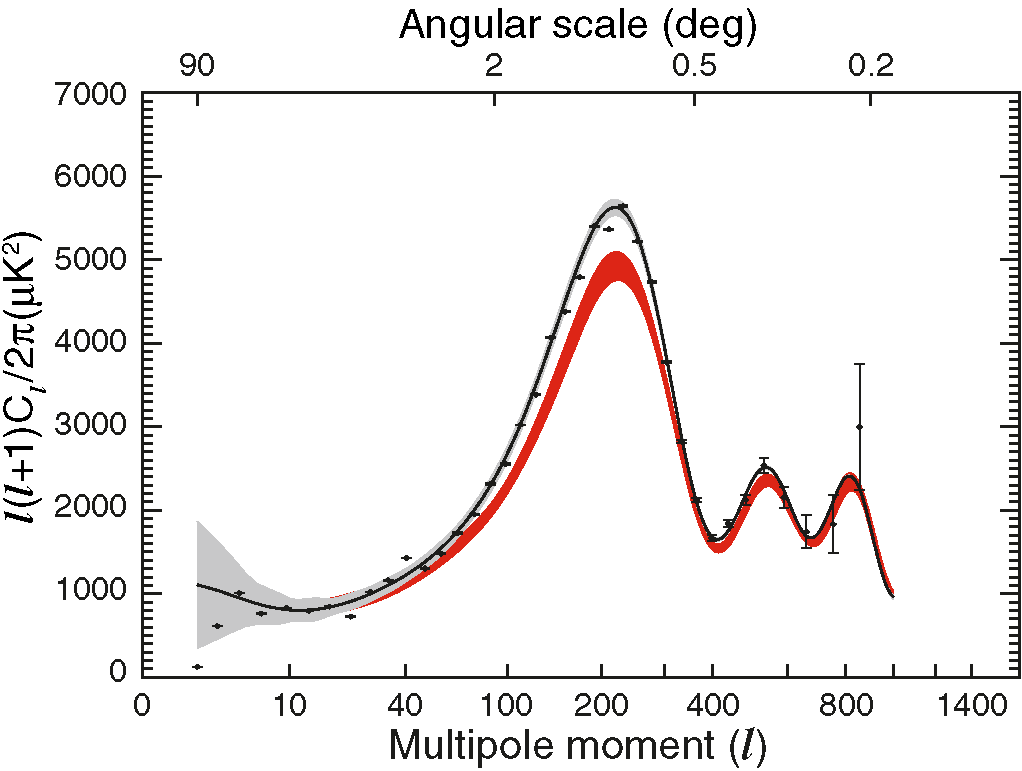
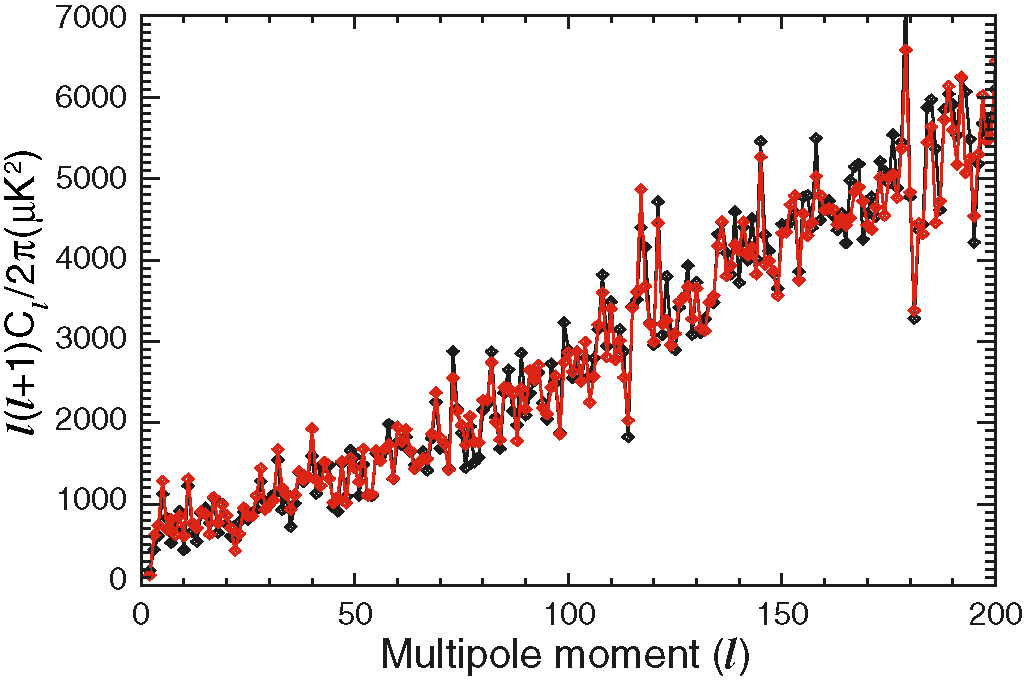
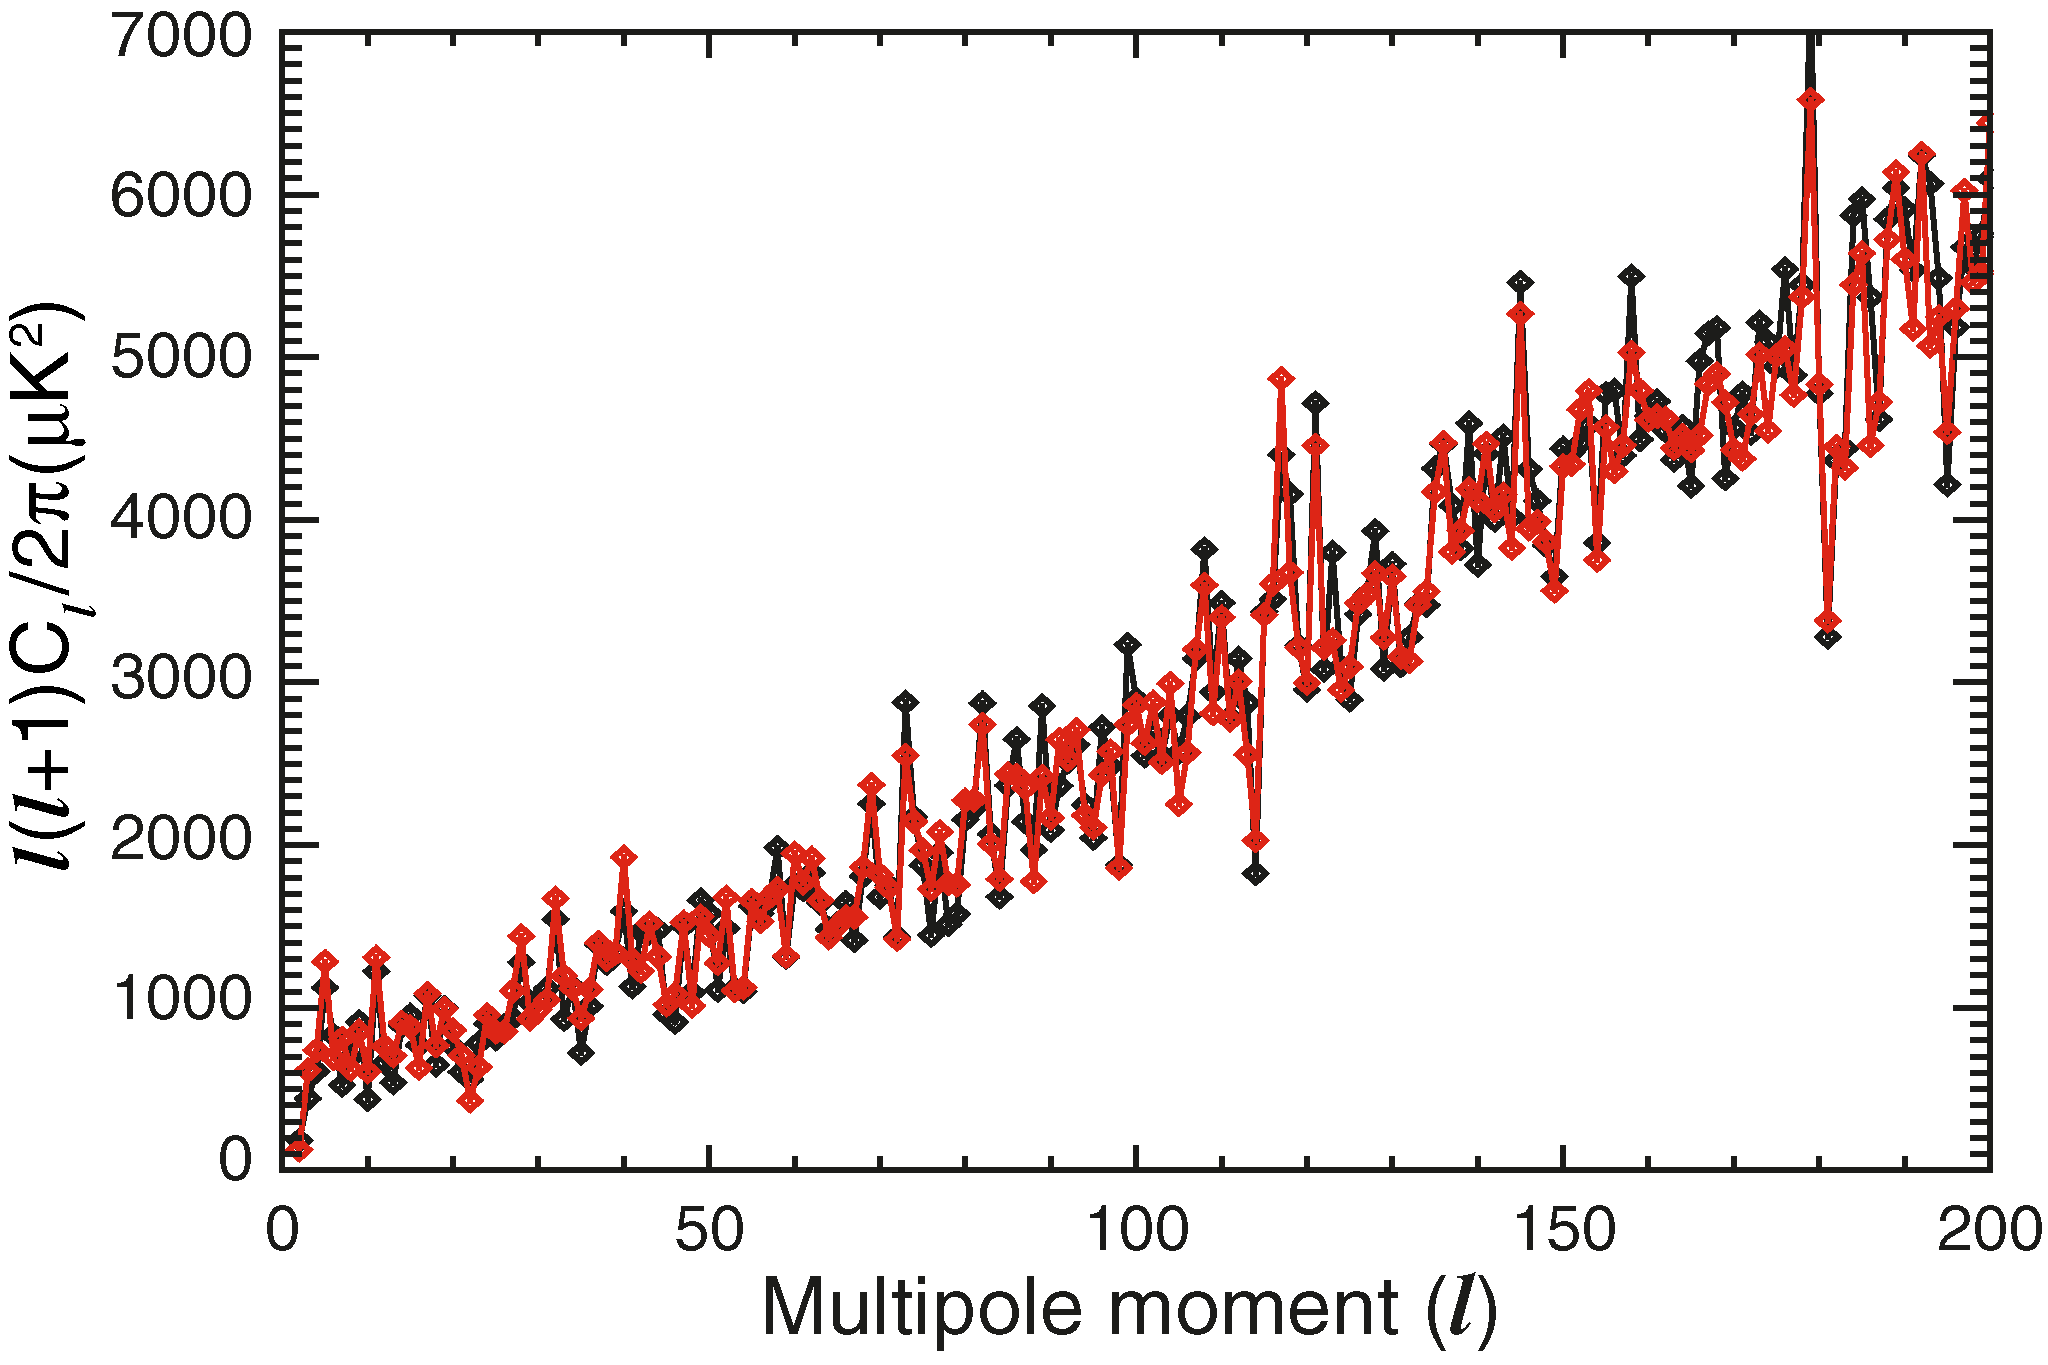
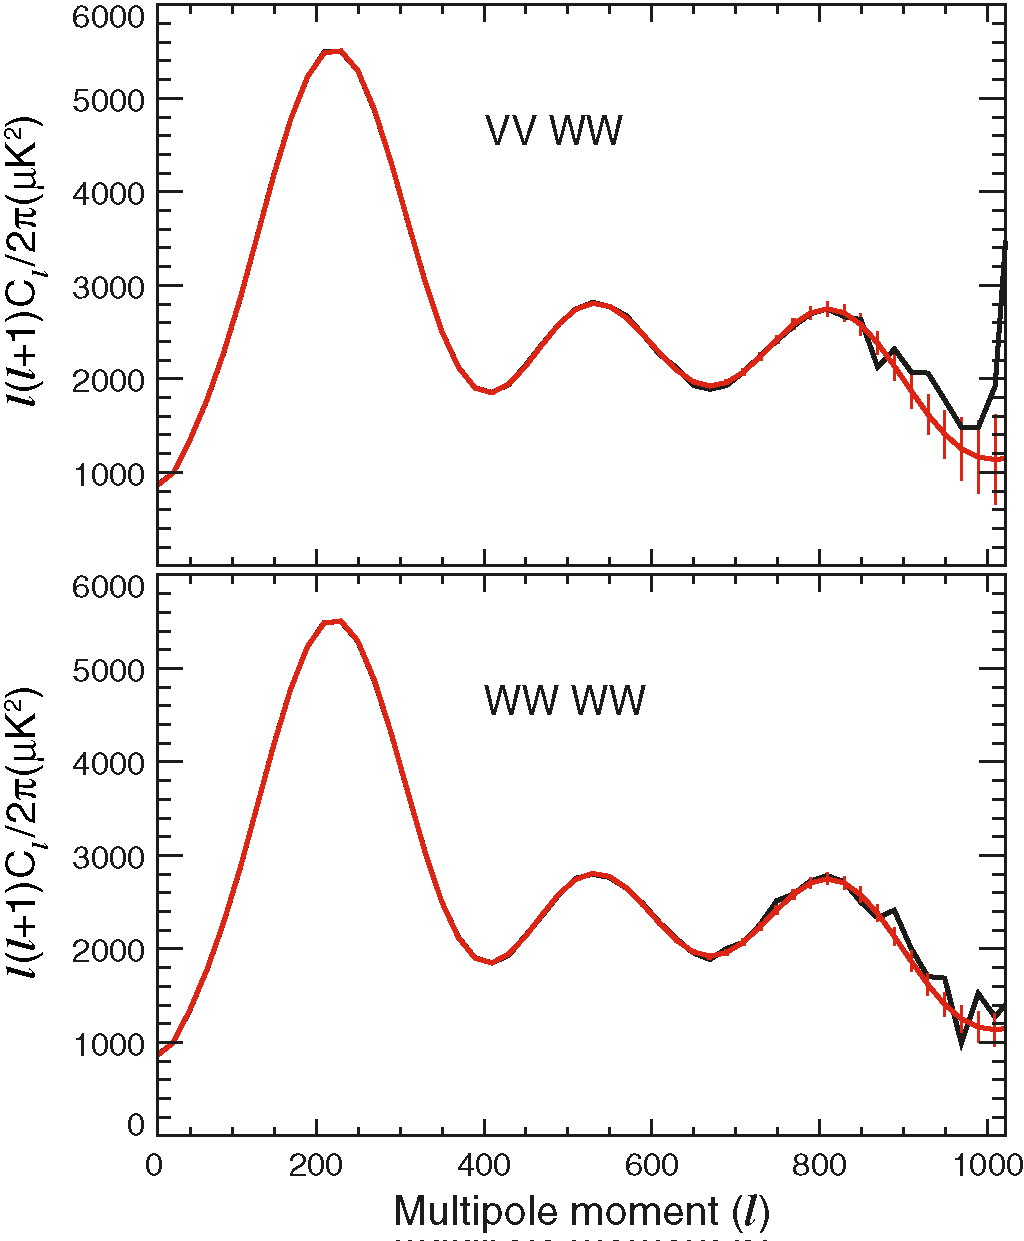
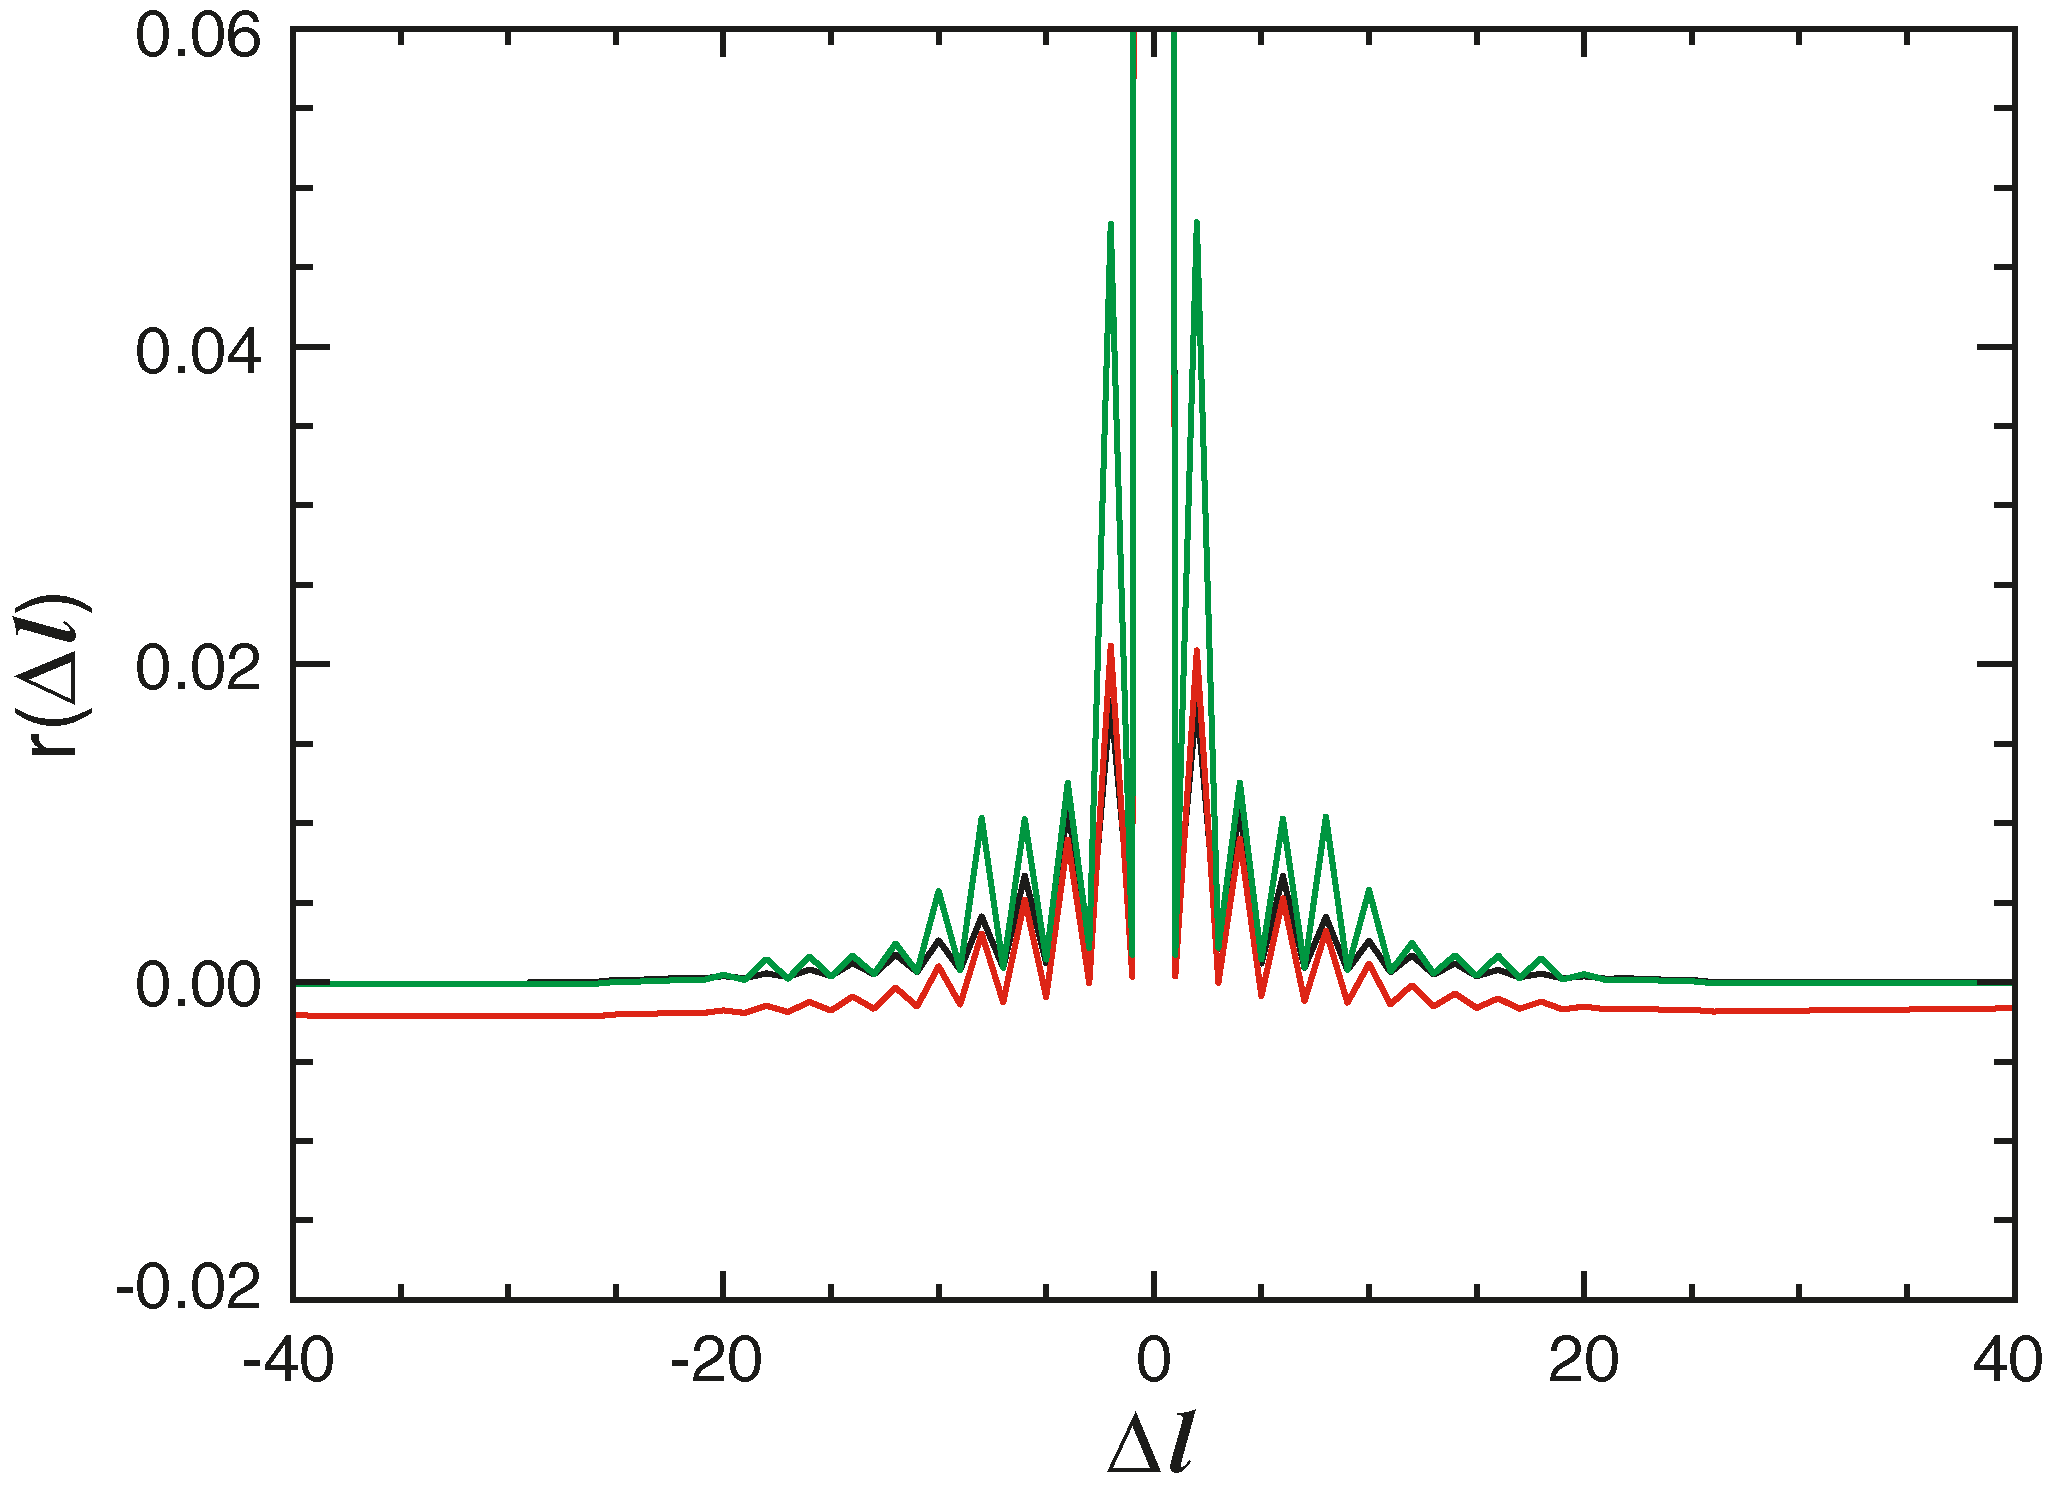
WMAP First Year Angular Power Spectrum

First Year Wilkinson Microwave Anisotropy Probe (WMAP) Observations: The Angular Power Spectrum, G. Hinshaw, et al., 2003ApJS..148..135H, reprint / preprint (811 Kb) / individual figures / ADS / astro-ph

WMAP First-year Paper Figures, G. Hinshaw, et al.
Individual figures are provided for use in talks. Proper display of PNG transparency in PowerPoint requires saving files to your computer before Inserting them. Please acknowledge the WMAP Science Team when using these images.

Image Credit: NASA / WMAPScience Team

Hinshaw Fig.1
Effective noise as a function of l for the eight DAs used in the combined power spectrum analysis. These spectra were computed from end-end simulations of noise maps, as discussed in § 2.2. For illustration, the spectra shown here were computed using the quadratic estimator with uniform pixel weights. The actual noise model uses three separate weighting schemes in three separate l ranges and thus has discontinuities where the effective noise level changes. The weights are defined in § A1.2.
PNG (21 kb 1024x1460 pixels)
PNG (54 kb - 2048x2919 pixels)
EPS (101 kb)
Hinshaw" Fig.2
Full set of individual cross-power spectra for l < 500, computed from the eight high-frequency DAs Q1 W4, 28 spectra in all. The spectra were evaluated from the uncorrected sky maps (no Galaxy model subtracted) using the Kp2 sky cut with uniform weighting. The data are plotted in color by effective frequency √νiνj with red corresponding to 41 GHz and blue to 94 GHz. The top panel shows a very robust measurement of the first acoustic peak with a maximum near l ~ 220. There is also a clear indication of the rise to a second peak at l ~ 540 as discussed in § 6. The bottom panel shows the ratio of each channel to the combined spectrum presented in § 5. This clearly shows the residual foreground emission due to diffuse Galactic radio emission at low l and to point sources at higher l. The level of contamination, which is strongest at Q band, is consistent with the expected level of foreground emission. See Fig. 3 for the spectra after foreground subtraction.
PNG (36 kb - 1024x1251 pixels)
PNG (86 kb - 2048x2503 pixels)
EPS (179 kb)
Hinshaw" Fig.3
Same set of cross-power spectra as shown in Fig. 2. Here the foreground model discussed in § 3.1 has been subtracted from each channel. The bottom panel shows the ratio of each of the 28 cross-power spectra to the combined spectrum presented in § 5. Aside from a ~10% discrepancy in the Q-band data at l < 20, the data are consistent with each other to the sensitivity limits of the individual spectra. Because the WMAP data are not sensitivity limited at low l, we use only V- and W-band data in the final combined spectrum forl < 100 (see § 5) to minimize residual Galactic contamination.
PNG (35 kb - 1024x1247 pixels)
PNG (82 kb - 2048x2495 pixels)
EPS (180 kb)
Hinshaw" Fig.4
Same set of cross-power spectra as shown in Fig. 3, but showing the low-l spectrum unbinned. The agreement between the individual spectra is striking. The low value of the quadrupole moment, C2, that was first seen by COBE DMR is also seen in the WMAP data. The steep, nearly linear rise in the spectrum from l = 2 to 5 translates to a near absence of power in the angular correlation function at separations larger than ~6° (Spergel et al. 2003; Bennett et al. 2003b). This was also seen in the COBE DMR data, but it is now clear that this is not due to Galaxy modeling errors. The bottom panel shows the fractional rms among the 28 WMAP cross-power spectra in black, while the red curve shows the same statistic averaged over an ensemble of 1000 Monte Carlo realizations. Based on this, we estimate the measurement error on the combined spectrum to be less than 2% 5% for l < 100.
PNG (34 kb - 1024x1242 pixels)
PNG (86 kb - 2048x2084 pixels)
EPS (282 kb)
Hinshaw Fig.5
Auto-power spectrum of the combined Q+V+W map evaluated with the three weighting schemes defined in § A1.2. In each case, the spectrum was computed over the entire l range; black shows uniform weights, red shows inverse noise weights, and green shows transitional weights. The agreement is excellent.
PNG (12 kb - 769x1024 pixels)
PNG (29 kb - 1538x2048 pixels)
EPS (23 kb)
Hinshaw Fig.6
Comparison of the auto-power spectrum computed from the combined Q+V+W map (gray) to the optimally combined cross-power spectrum (black). The two methods agree extremely well, with the only notable deviation being at the highest l range probed by the first-year data. This is the regime where the auto-power spectrum will be most sensitive to the noise bias subtraction. As can be seen in the error estimates shown in Fig. 8, the deviation is less than 1 σ. Note that the auto-power spectrum is not used for parameter estimation.
PNG (14 kb - 772x1024 pixels)
PNG (33 kb - 1544x2048 pixels)
EPS (19 kb)
Hinshaw" Fig.7
Comparison of the V x W cross-power spectrum computed with data from the ecliptic plane (|β| < 30°; green) vs. data from the ecliptic poles (|β| > 30°; blue). The difference between the two spectra is plotted in black, along with a 1 σ error band computed from Monte Carlo simulations that include the effects of sample variance. The χ2 of the difference spectrum in the range 2 ≤ l ≤ 800 is 750 for 799 degrees of freedom. There is no evidence that beam ellipticity, which would be more manifest in the plane than in the poles, systematically biases the spectrum. This is consistent with estimates of the effect given by Page et al. (2003b).
PNG (19 kb - 937x1024 pixels)
PNG (39 kb - 1875x2048 pixels)
EPS (21 kb)
Hinshaw Fig.8
Final angular power spectrum, l(l + 1)Cl/2π, obtained from the 28 cross-power spectra, as described in § 5. The data are plotted with 1 σ measurement errors only, which reflect the combined uncertainty due to noise, beam, calibration, and source subtraction uncertainties. The solid line shows the best-fit ΛCDM model from Spergel et al. (2003). The gray band around the model is the 1 σ uncertainty due to cosmic variance on the cut sky. For this plot, both the model and the error band have been binned with the same boundaries as the data, but they have been plotted as a splined curve to guide the eye. On the scale of this plot the unbinned model curve would be virtually indistinguishable from the binned curve except in the vicinity of the third peak.
PNG (13 kb - 772x1024 pixels)
PNG (31 kb - 1544x2048 pixels)
EPS (37 kb)
Hinshaw Fig.9
Compilation of recent CMB power spectrum measurements compared to the best-fit ΛCDM model from the first-year WMAP data. The data points include noise and cosmic variance uncertainty (but not calibration uncertainty); thus, we omit the cosmic variance band from the model curve in the figure. On average, the pre-WMAP data agree well with the WMAP power spectrum. The references for the previous data are as follows: Tegmark (1996) for COBE; Benoit et al. (2003) for ARCHEOPS; Miller et al. (2002) for TOCO; Ruhl et al. (2002) for BOOMERANG; Lee et al. (2001) for MAXIMA; Halverson et al. (2002) for DASI; Pearson et al. (2003) for CBI; Kuo et al. (2002) for ACBAR.
PNG (19 kb - 772x1024 pixels)
PNG (45 kb - 1544x2048 pixels)
EPS (31 kb)
Hinshaw Fig.10
WMAP combined power spectrum, in black, compared to a compilation of all CMB data published prior to WMAP from Wang et al. (2002a), in red. The WMAP data are plotted with cosmic variance plus measurement uncertainties here in order to facilitate a comparison with the compiled data that is reported in this way. The data agree well on COBE scales, l < 20 (but note that the WMAP cosmic variance errors are computed from the best-fit model rather than the data, thus they appear larger than the COBE errors at the quadrupole). However, the overall normalization of the WMAP spectrum is ~10% higher on smaller scales.
PNG (12 kb - 771x1022 pixels)
PNG (27 kb - 1543x2046 pixels)
EPS (24 kb)
Hinshaw Fig.11
WMAP combined power spectrum compared to the locus of predicted spectra, in red, based on a joint analysis of pre-WMAP CMB data and 2dFGRS large-scale structure data (Percival et al. 2002). As in Fig. 8, the WMAP data are plotted with measurement uncertainties, and the best-fit ΛCDM model (Spergel et al. 2003) is plotted with a 1 σ cosmic variance error band. The locus of predicted spectra lies systematically below the WMAP data at intermediate l.
PNG (11 kb - 771x1022 pixels)
PNG (27 kb - 1543x2046 pixels)
EPS (44 kb)
Hinshaw Fig.12
Comparison of two power spectra computed from a single V-band map. The black points result from the maximum likelihood method, the red points from the quadratic estimator computed with uniform pixel weighting. In both cases a noise model has been assumed to treat the noise bias. At higher l, the two spectra would be nearly identical since both impose inverse noise weighting on the data.
PNG (17 kb - 683x1024 pixels)
PNG (43 kb - 1365x2048 pixels)
EPS (49 kb)
Hinshaw Fig.13
Quadratic estimator discussed in § A1, which has been extensively tested with Monte Carlo simulations of first-year WMAP data. The top panel shows a model spectrum (red ) and the mean of 600 realizations of the cross-power spectrum, computed from the V- and W-band averaged maps (black). The red error bars show the uncertainty in the mean in bins with Δl = 20. The cross-power spectrum estimator is unbiased. The bottom panel is similar, but with auto-power spectra computed from the W-band averaged map. Here the noise bias term was estimated from Monte Carlo simulations of noise maps. This simple auto-power spectrum estimator is unbiased if the noise is white and is suitable for V-band data, but see Fig. 1 for examples of W-band noise spectra.
PNG (18 kb 1024x1241 pixels)
PNG (40 kb - 2048x2482 pixels)
EPS (18 kb)
Hinshaw Fig.14
Slices of the Fisher (or curvature) matrix normalized as Fll' / √ Fll Fl'l', plotted vs. δl = l - l', from the Fisher matrix for the combined spectrum. Black is l = 30, red is l = 300, and green is l = 600.
PNG (8 kb - 751x1024 pixels)
PNG (19 kb - 1500x2046 pixels)
EPS (9 kb)

A service of the HEASARC and of the Astrophysics Science Division at NASA/GSFC
Goddard Space Flight Center, National Aeronautics and Space Administration
HEASARC Director: Dr. Andrew F. Ptak
LAMBDA Director: Dr. Thomas M. Essinger-Hileman
NASA Official: Dr. Thomas M. Essinger-Hileman
Web Curator: Mr. Michael R. Greason